适用于MetaTrader 5的免费EA交易和指标 - 7

Hi-Lo is an indicator whose purpose is to more precisely assist the trends of a given asset - thus indicating the possible best time to buy or sell.
What is Hi-lo?
Hi-Lo is a term derived from English, where Hi is linked to the word High and Lo to the word Low. It is a trend indicator used to assess asset trading in the financial market.
Therefore, its use is given to identify whether a particular asset is showing an upward or downward trend in value. In this way, Hi-Lo Activator can be t
FREE

If you heard about The Wyckoff Method, Volume Spread Analysis, etc... You are probably searching for the candlestick indicator that shows you the Volume spread all over the current bar, signaling every types of market status... You can control the several Market Levels with custom colors...
It is up to you to decide how to use it. Our job is provide you with the indicator...
If you like this indicator, all I am asking is a little Review (not a Comment, but a REVIEW! )... This will mean A
FREE
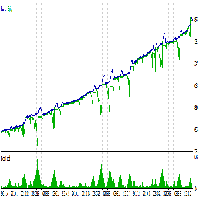
Notes: 1. Martingale is a betting system. You just download this for entertainment purposes. 2. For MT4 version please contact via private message.
Strategy description 1. This bot uses supertrend indicator to decide entry and exit. 2. Every supertrend signal causes entry but exit if already in profit. You do not need to download the indicator. It is embedded in EA source code. 3. The bot works in both direction simultaneously(Hedging). 4. Trading decisions are based on candle closure. So thi
FREE

This indicator uses the Zigzag indicator to identify swing highs and swing lows in the price chart. Once it has identified the swing highs and swing lows, it can use them to determine potential support and resistance levels. A support level is formed when the price drops and bounces back up from a swing low, indicating that there is buying pressure at that level. A resistance level is formed when the price rises and reverses downward from a swing high, suggesting selling pressure at that level.
FREE

The Heikin Ashi indicator is our version of the Heikin Ashi chart. Unlike competitor products, this indicator offers extensive options for calculating Heikin Ashi candles. In addition, it can be displayed as a classic or smoothed version.
The indicator can calculate Heikin Ashi with moving average by four methods: SMA - Simple Moving Average SMMA - Smoothed Moving Average EMA - Exponential Moving Average LWMA - Linear Weighted Moving Average
Main features The indicator shows Heikin
FREE

介绍强大的NRTR(Nick Rypock Trailing Reverse)指标 - 这是一个必备的技术工具,用于帮助交易员识别趋势反转并设置有效的跟踪止损水平。由Nick Rypock开发,该指标采用独特的算法,可以适应不断变化的市场条件,成为任何交易者工具箱中不可或缺的一部分。
以下是交易员使用该指标的两种常见方式:
1. 趋势反转:NRTR指标在趋势即将反转时生成清晰的信号。留意指标线穿过价格图表,这是潜在趋势方向转变的信号。
2. 跟踪止损:NRTR还可作为可靠的跟踪止损工具,可在趋势市场中保护利润。当价格朝着预期方向移动时,NRTR线会动态地跟随价格,提供灵活的止损水平。
可自定义参数:通过调整指标的参数,将NRTR指标调整为适合您的交易偏好和时间框架。尝试不同的设置,找到最适合您独特交易风格的配置。为了提升交易策略,考虑将NRTR指标与其他技术指标结合使用。使用多个指标可以验证信号,并提高整体交易准确性。
总之,NRTR指标对于希望识别趋势反转并实施有效的跟踪止损的交易员来说是一个宝贵的资产。其适应性和用户友好的设计使其成为交易者中受欢迎的选择,有助
FREE

Developed by Chuck LeBeau, the Chandelier Exit indicator uses the highest high / lowest low -/+ a multiple of the ATR value to draw trailing stop lines (orange under buys, magenta over sells) that advance with the trend until the trend changes direction.The value of this trailing stop is that it rapidly moves upward in response to the market action. LeBeau chose the chandelier name because "just as a chandelier hangs down from the ceiling of a room, the chandelier exit hangs down from the high
FREE

ChannelRSI5 具有超买和超卖区域动态水平的相对强弱指数 (RSI) 指标。
动态水平随指标和价格的当前变化而变化和调整,代表一种通道。
指标设置 period_RSI - 计算 RSI 指数的平均周期。 Applied_RSI - 应用价格。它可以是任何价格常数:PRICE_CLOSE - 收盘价,PRICE_OPEN - 开盘价,PRICE_HIGH - 期间的最高价,PRICE_LOW - 期间的最低价,PRICE_MEDIAN - 中间价(高 + 低) / 2, PRICE_TYPICAL - 典型价格(最高价 + 最低价 + 收盘价)/ 3, PRICE_WEIGHTED - 加权平均价,(最高价 + 最低价 + 收盘价 + 收盘价)/ 4。
period_channel - 超买超卖区域动态通道的计算周期。
FREE

This indicator displays buy or sell signals according to Bill Williams' definition of the Trading Zone. [ Installation Guide | Update Guide | Troubleshooting | FAQ | All Products ] Easy to use and understand Avoid trading flat markets Deterministic indicator with clear rules The indicator is non-repainting It implements alerts of all kinds It has straightforward trading implications. A blue arrow is a buy signal A red arrow is a sell signal According to Bill Williams trading in the zone helps t
FREE

The Expert advisor was created based on ORDER BLOCKS AND SMART MONEY CONCEPTS and Pit floor trading strategies. TRADING SETTINGS: Working Time frame : Current to 1 Month i recommend trading from 1Hr to Daily time frames as lower time frames are more prone to markets noise Stop loss : Use this to set your stop loss per trade taken Take Profit : Us
FREE

Easy ICT SP500 is an Expert Advisor meticulously crafted to execute trading strategies based on the simplified ICT Bullet Strategy, incorporating Fair Value Gap analysis for precise position entries. Tailored specifically for the SP500, this EA aims to provide traders with a reliable and optimized tool for navigating the dynamic landscape of the stock market. Distinguished Strategy: this EA distinguishes itself by employing a sophisticated yet simplified version of the ICT Bullet Strategy, stra
FREE

O indicador criado por Didi Aguiar, o mestre das Agulhadas!
O padrão do indicador é o cruzamento de três médias móveis simples. Média rápida, período 3. Média normalizada, período 8. Média lenta, período 20.
Quando as três médias se cruzam próximas o suficiente, acontece a agulhada! Pela posição das médias é possível identificar: Agulhada de compra, agulhada de venda, ponto falso e beijo da mulher aranha.
Quer saber mais? Procure pelo site dos robôs oficiais da Dojistar: tradesystembots.co
FREE

海龟交易指标实现了原始的 Dennis Richards 和 Bill Eckhart 的交易系统, 俗称海龟交易法。这个趋势跟踪系统依据突破历史高点和低点来下单或平仓: 它与“低买高卖”方式完全相反。主要规则是 "在 N-日突破时下单,并在 M-日的高点或低点突破时获利了结 (N 必须在 M 之上)"。
介绍 海龟交易法的传奇始于美国千万富翁、大宗商品交易商 Richard Dennis,和他的商业伙伴 William Eckhardt 之间的赌局。Dennis 相信交易者可以通过培养而成功; Eckhardt 不认可这种主张,他认为遗传是决定因素,而娴熟的交易者对于明晰市场趋势拥有与生俱来的敏锐感觉。而在 1983-1984 发生的事件,成为交易史上的著名实验之一。平均每年 80%,计划成功,表明任何人如果具有良好的规则和足够的资金,都可以成功。 在 1983 中期,Richard Dennis 开始在华尔街日报上刊登广告,他征求申请者参加他自己的交易理念培训,无须任何经验。他最终召集了具有不同背景的约 21 名男性和两名女性。这群交易者被集中到芝加哥市中心一座家俱稀少的大房间
FREE

Bollinger Bands % or Bollinger Bands Percentage is one of the indicators used in the Sapphire Strat Maker - EA Builder .
It is calculated using the following formula:
Perc = (CLOSE_PRICE - LOWER_BOLLINGER) / (UPPER_BOLLINGER - LOWER_BOLLINGER) * 100
Thus, by taking the difference between closing price to the lower band and dividing it by the difference of the upper and the lower price levels of a Bollinger Bands indicator, we can calculate this indicator.
It shows how far the price is f
FREE

加入 考拉交易解决方案频道 在MQL5社群中,获取有关所有考拉产品的最新信号和新闻,加入链接如下: https://www.mql5.com/en/channels/koalatradingsolution 欢迎使用BTC级别指示器
考拉BTC液位指示器
这个指标适合那些喜欢购买BTC的人,正如您所知,BTC是过去几年以及现在的最佳投资项目之一,因此该指标仅向我们显示了比特币的购买水平。
考拉BTC等级指示器可以根据深度参数确定最低点,深度参数可以作为输入进行调整,然后从最低点扩展线到当前时间,并绘制箭头和价格水平,向我们展示您需要在哪里购买BTC。
这些支撑位是购买BIT COIN的最佳和最安全的水平,因此当比特币开始下跌时,请不要担心,只需在这些水平上进行购买即可。
考拉BTC级别输入参数:
BTC支持深度:通过此参数,您可以影响支撑的力量,更高的值向我们展示更多的力量全支撑水平。 (20对H1和H4有利)
最高历史记录:此参数询问历史记录中必须扫描多少支蜡烛才能计算支撑线。
我对谁爱考拉BTC指标的要求:
**尊
FREE

Tired of plotting trendlines? The PZ TrendLines MT5 indicator applies a mechanical approach to the construction of trend lines for you! [ Installation Guide | Update Guide | Troubleshooting | FAQ | All Products ] It can draw up to 18 trendlines Trendlines can be optionally based on fractals Each line represents a breakout level Each trendline can be broken or rejected Configurable amount of lines Configurable colors Support I am happy to provide free products but given my limited time, they com
FREE

I'm sure after a lot of research on the internet, you haven't found any indicator that can help you with forex or binary trading in the latest probability strategy created by famous trader Ronald Cutrim. The strategy is based on a simple count of green and red candles, checking for a numerical imbalance between them over a certain period of time on an investment market chart. If this imbalance is confirmed and is equal to or greater than 16%, according to trader Ronald Cutrim, creator of the pro
FREE

The Weis Waves RSJ Indicator sums up volumes in each wave. This is how we receive a bar chart of cumulative volumes of alternating waves. Namely the cumulative volume makes the Weis wave charts unique. It allows comparing the relation of the wave sequence characteristics, such as correspondence of the applied force (expressed in the volume) and received result (the price progress).
If you still have questions, please contact me by direct message: https://www.mql5.com/en/users/robsjunqueira/
FREE

This indicator can send alerts when a Heiken Ashi Smoothed color change occurs. Combined with your own rules and techniques, this indicator will allow you to create (or enhance) your own powerful system. Features Can send all types of alerts. Option to delay the alert one or more bars in order to confirm the color (trend) change. Input parameters Candle shift for alert: Default is 1. Setting it to 0 will alert you on color change on the current candle. This should be regarded as a pending (uncon
FREE

CAP Moving Average EA MT5 trades using the Moving Averages Indicator. It offers many customizable Moving Averages trading scenarios and flexible position management settings, plus many useful features like customizable trading sessions, a martingale and inverse martingale mode. [ Installation Guide | Update Guide | Submit Your Problem | FAQ | All Products ]
Functions Easy to use and customizable Moving Average setting. Customizable indicator settings Built-in money management Grid
FREE

Adaptive Moving Average (AMA) is a trend indicator using moving average and market noise filter. Indicator feature are blue and red points, showing the power of trend. Recommendations for trading: Auxiliary Indicator Detecting trend Detecting power of trend Detecting potential reversal points Main indicator Shows entry points for swing trading Serves as dynamic support and resistance Recommendations for use: Any instrument Any timeframe Input parameters: Period - AMA period Fast Period - fast MA
FREE

该指标显示任何时间范围内任何品种的最小化图表。显示的最大图表数为 28。图表可以位于主窗口和底部窗口中。两种显示模式:蜡烛图和条形图。显示的数据量(条形图和蜡烛图)和图表大小是可调的。 要使用迷你聊天,您必须首先将所需的指标放在常规图表上,然后将其保存为模板并通过适当的参数为迷你图表应用模板,例如,对于第一个图表,参数称为“模板名称 1”。 参数: Charts base corner - 基角 Charts subwindow number - 子窗口编号 Charts X/Y shift - 起始 X/Y 偏移 Charts width/height - 窗口宽度/高度 Space X/Y between charts - 图表之间的 X/Y 距离 Charts scale - 比例 Show date/price scale - 显示时间/价格比例 Charts in background mode - 后台模式 Columns count - 列数
FREE

Best Pivot Point Indicator display pivot points and support and resistance lines for the intraday trading. It calculates them using its own formula based on the previous trading session The indicator can display the following levels in addition to plain pivot points: Previous session's High and Low, today's Open. Sweet spots. Fibonacci levels. Camarilla pivots. Midpoint pivots.
FREE

The Rapid Reaper EA is a fully automated hybrid averaging EA that trades in sequences of lot increase and multiplication on both sides of the book. The system trades using market orders with take profits set across trade groups. This EA will work on any pair but works best on GBPUSD and USDCAD on the M5 timeframe. A VPS is advisable when trading with this EA. Check the comments for back test results and optimized settings. Please note: I have made the decision to give this EA away and many more
FREE

Like most things that work in trading, it's really simple. However, it's one of the most powerful tools I have that makes entries of many systems much more precise.
In its essence, it measures the recent volatility against the medium-term average. How does it work? Markets tend to be prone to strong trending movements when relative volatility is low and tend to be mean-reverting when relative volatility is high.
It can be used with both mean-reversion systems (like the Golden Pickaxe) an
FREE

对于那些使用趋势线、矩形和文本等元素进行技术分析的人来说,VR 颜色级别是一个方便的工具。可以直接向图表添加文本并截取屏幕截图。 设置、设置文件、演示版本、说明、问题解决,可以从以下位置获取 [博客]
您可以在以下位置阅读或撰写评论 [关联]
版本为 [MetaTrader 4] 一键点击 即可使用该指标。为此,请单击带有线条的按钮,之后光标下方将出现一条趋势线。然后,通过移动光标,您可以选择 行位置 并通过再次单击来修复它。 该指标的特点 是,样式和颜色的所有更改都会自动保存,并随后应用于所有 新创建的 图形对象。 该指标配备了两个独立的按钮,用于设置不同样式的趋势线,两个独立的不同样式的矩形,一个具有自己风格的文本字段以及一个用于创建屏幕截图的按钮。 屏幕截图在 MetaTrader 终端目录的 Files 文件夹中创建,保存路径和文件名写入专家日志中。 大致路径:C:\Users\用户名\AppData\Roaming\MetaQuotes\Terminal\Character set\MQL5\Files\VR Color Levels 有大量类似于 VR Color
FREE

精准交易分析,尽在掌握:新一代交易分析软件
市面上的主流交易分析软件,往往只提供小时或周的盈亏比统计,无法满足更精细的交易分析需求。然而,真实交易市场中,每天的情况都各不相同。周一清淡,周三活跃并有三倍隔夜利息,周五则异常活跃并伴随重大数据公布。显然,以天为单位进行统计分析并不科学,以周为单位较为合理。然而,以周为单位的图表只能看到每天的统计情况,而无法洞悉每小时的变化。更进一步,有些品种在做多或做空时表现出极大的差异,需要区分分析,这些都是现今交易分析软件所欠缺的。
除了时间单位过于粗略之外,现有的交易分析软件在刷选策略方面也存在不足。单用品种名称进行刷选并不科学,因为一个品种可能有多个策略同时运行。同样,单用魔术号进行刷选也不合理,因为有些交易程序用同一个魔术号管理多个品种的交易。因此,更为合理的方案是用品种和魔术号这一对数据来刷选策略,这样才能避免分析结果受到干扰。
虽然有些软件也用品种和魔术号来刷选策略,但他们的使用方法极不方便,每次只能查看一个策略,无法看到全局,而且切换策略操作复杂。
为了解决以上问题,新一代交易分析软件应运而生。本软件界面内容丰富,一个界面
FREE


The Candle Countdown Timer for MetaTrader 4 (also available for MT5) is a vital indicator designed to help you manage your trading time effectively. It keeps you updated about market open and close times by displaying the remaining time before the current candle closes and a new one forms. This powerful tool enables you to make well-informed trading decisions. Key Features: Asia Range: Comes with an option to extend the range. Broker Time, New York, London Time: Displays the current broker time
FREE

Exp5 - COPYLOT MASTER 是 МetaТrader 5 和 MetaTrader 4 的交易复制器。它从任何账户复制外汇交易。 安装 这个 Expert Advisor 是一个复制大师。在您想要复制交易的终端中安装“EA 交易”。 将任何文本标签名称指定为 pathWrite,例如,“COPY”。 在您想要复制交易的终端上安装 COPYLOT MASTER for MT5。 然后在您要复制到 的 MT4 终端上安装 COPYLOT Client MT4。 或 MetaTrader 5 的 Copylot 客户端 MT5
您也可以下载 COPYLOT MASTER for MT COPYLOT - 完整说明和手册 PDF 指南 注意:可以在“注释”选项卡上找到设置列表。 EA 需要设置为 1 个图表!默认情况下,我们的顾问会从您的账户复制所有头寸和订单! 订单在激活时被复制(头寸)并复制到客户账户。 不支持部分关闭!订单只能在与打开时相同的批次中关闭!如果您的主人使用不同的批次进行关闭,那么复印机可能会失败!
# 它是当今最好的 MT5 到 MT4 贸易复
FREE

Trading has never been easier! Let's check this out! MT4 version: https://www.mql5.com/en/market/product/72153 Strategy There are some news within a day that can make the price jumps up or down very quickly and that is a good opportunity for traders to get some profits. Looking to scalp a news release? Here's how you can do it: Open two stop orders (a buy stop and a sell stop) 3 to 5 minutes before the news release. Place them about 15 to 20 pips away from the current market price. When the ne
FREE

该指标基于“The Secret Mindset”YouTube 频道在视频中提出的策略 “经过 1 个月的价格行为交易,我发现了一种可靠的剥头皮策略” 视频中完整详细地解释了信号过滤的策略和条件。 * YouTube 频道创建者与此指标开发无关 信号应与其他指标相结合,并根据每个交易者的判断进行过滤
指标
在前一根柱线的高/低范围内的柱线,可以称为内柱线。 指标可以选择绘制这些条形图 两个连续的 inside bar 将创建一个通道,通常也用作支撑或阻力位
信号
指标可以在两种不同的模式下显示信号箭头: FAST: 信号 将重新绘制直到 bar 收盘,因此交易者应仅在信号 bar 已经关闭后,在下一个 bar 开盘时进场。 这允许在确认之前期待可能的下一个信号• 慢: 信号 不会重新绘制。 箭头 只有在信号栏已经关闭并确认通道中断后才会出现 条件: 购买: 当价格向上突破通道的上层时 卖出: 当价格向下突破通道的较低水平时 可选地,指示器将显示通道的所有信号或仅显示第一个出现的信号。
建议级别
止损:最后一个低点 当 买入 /最后一个高点当 卖出 止盈:1
FREE

The indicator displays a renko chart and a supertrend indicator in real time. After installing the indicator, the window will display the Renko chart and the supertrend indicator in the same window. This allows you to more clearly and visually see the entry and exit points when a trend reversal occurs. The signal to open a position is the intersection of the Renko candlestick of the supertrend indicator point and the appearance of the opposite signal of the supertrend indicator.
The indicator
FREE

Auto Fibo Expansion is an indicator that projects the Fibonacci expansion levels above and below the opening price of the day. It does the calculation based on the previous day and projects the levels on the current day. It is very efficient to find "psychological" zones of support and resistance. Its appearance is all configurable and you can set up to 30 different levels. Enjoy! This is a free indicator, but it took hours to develop. If you want to pay me a coffee, I appreciate a lot <3 PayP
FREE

This indicator is designed to detect high probability reversal patterns: Double Tops/Bottoms with fake breakouts . This is the FREE version of the indicator: https://www.mql5.com/en/market/product/29957 The free version works only on EURUSD and GBPUSD! Double top and bottom patterns are chart patterns that occur when the trading instrument moves in a similar pattern to the letter "W" (double bottom) or "M" (double top). The patterns usually occur at the end of a trend and are used to signal tren
FREE

A combined indicator of two famous indicators: RSI , Bollinger Bands Can be used in all currency pairs Can be used in all time frames with many signals Very simple and fast to use
Description:
This indicator is made from the combination of RSI and Bollinger Bands indicators
As you can see, it shows good signals and is worth using and testing
We hope you are satisfied with this indicator
Settings: show past show candle: Displays the number of candles that the indicator calculates.
For
FREE

About CrashBoom Stones is an expert advisor utility that gives you a signal to catch CrashBoom drops or spikes. It shows you a Red Sell arrow on Crash to sell, and a blue arrow on Boom to buy. It also gives you an alert when an arrow is shown. Note:
The utility does not show signals for the historical data in live mode, use the strategy tester to test this utility. The arrows shown are independent to the trends pane. The trends pane is more accurate when H1 and M30 agree.
Recommendations
FREE

这是一个统计小组,提供MetaTrader 5交易账户的分析。 分析结果实时显示在图表上。 多币种交易非常受欢迎。但是,交易量越大,分析每个交易的盈利能力就越困难。按月分析交易并计算每笔交易的统计数据是更具挑战性的任务。 MT4版本
详细描述 +PDF 如何购买
如何安装
如何获取日志文件 如何测试和优化 Expforex 的所有产品 然而,交易量越大,分析每笔交易的盈利能力就越困难。 按月分析交易和计算每笔交易的统计数据更是具有挑战性的任务。 如果您想全面了解交易系统的表现,有多种工具可以帮助您实现这一目标。 其中一些工具包括报告、统计、myfxbook、交易日志、账户分析、性能统计、分析和创新的仪表盘。 利用这些工具,您可以详细分析自己交易系统的表现,并获得有关优势领域和潜在弱点的宝贵见解。 无论您是希望提高业绩的新交易员,还是希望优化交易策略的经验丰富的交易员,这些工具都能为您提供所需的信息,帮助您做出明智的决策,实现您的财务目标。
该面板提供了一种有效的解决方案,可以分析您的帐户并实时准备详细的统计数据 亲爱的朋友和我们的EA用户 Ex
FREE

The TRIXs Indicator is the combination of the TRIX (Triple Exponential Moving Average) indicator with the addition of a SMA (Simple Moving Average) signal. It provides signs of trend continuity and the start of a new trend.
The entry and exit points of operations occur when the indicator curves cross.
It performs better when combined with other indicators.
FREE

The MACD 2 Line Indicator is a powerful, upgraded version of the classic Moving Average Convergence Divergence (MACD) indicator.
This tool is the embodiment of versatility and functionality, capable of delivering comprehensive market insights to both beginner and advanced traders. The MACD 2 Line Indicator for MQL4 offers a dynamic perspective of market momentum and direction, through clear, visually compelling charts and real-time analysis.
Metatrader4 Version | All Products | Contac
FREE
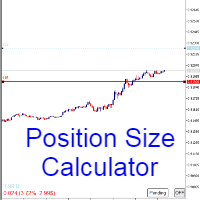
Calculating the volume of orders every time you create an order is an extremely important thing in risk management Let this tool simplify your work! ----------------------------------------------------- How to use? Attach the indicator to the chart and set its parameters: Risk size in % or money and Risk Reward Ratio. Click on the ON button and locate the horizontal line to your would-be StopLoss level. Options: Click on the Pending/Instant button to locate the horizontal line to your would-b
FREE

Advanced Market Analysis Tool : Dive into market depth with the MT5 Volume Profile Indicator. Seamless MT5 Integration : Perfectly compatible with the MT5 platform. Enhances Pro Thunder v9 : Integrates smoothly with Pro Thunder v9 for deeper market insights. Detailed Volume Analysis : Explore market dynamics through in-depth volume data. ️ Simple Installation : Easy-to-follow setup steps for quick integration with MT5. Efficient Single Chart Application : Best used on a single c
FREE

The idea of a Value Chart indicator was presented in the very good book I read back in 2020 , " Dynamic Trading Indicators: Winning with Value Charts and Price Action Profile ", from the authors Mark Helweg and David Stendahl. The idea is simple and the result is pure genius: Present candlestick Price analysis in a detrended way!
HOW TO READ THIS INDICATOR
Look for Overbought and Oversold levels. Of course, you will need to test the settings a lot to find the "correct" one for your approach.
FREE


Highly configurable Macd indicator.
Features: Highly customizable alert functions (at levels, crosses, direction changes via email, push, sound, popup) Multi timeframe ability Color customization (at levels, crosses, direction changes) Linear interpolation and histogram mode options Works on strategy tester in multi timeframe mode (at weekend without ticks also) Adjustable Levels Parameters:
Stochastic RSI Timeframe: You can set the lower/higher timeframes for Stochastic RSI. Stochastic RSI
FREE
Unlock the power of synchronized chart analysis with Chart Sync, your ultimate solution for harmonizing technical objects across multiple charts on the same trading symbol,
ChartsSync Pro MT5 is a groundbreaking MetaTrader 5 utility designed to streamline your trading workflow, enhance analysis precision, and amplify your trading decisions.
Features:
Effortless Object Synchronization.
Multi-Chart Harmony.
User-Friendly Interface.
Real-Time Updates.
Sync Objects Color,Width and Style.
FREE

This indicator forms a channel based on the readings of the ADX (Average Directional Movement Index) indicator, displays and informs the trader of a price reversal at the boundaries of this channel, and can also report when the price touches the channel boundaries. It also draws additional dotted lines, which depend on the readings of the + DI and -DI of the ADX indicator. It also has an option for filtering signals depending on the readings of the stochastic. The channel drawn by this indicato
FREE

Trade easily from the chart with CAP Trade Pad EA . It handles risk management for you and can perform several useful tasks with your existing trades. Trade easily from the chart Trade with precise risk management hassle free Set your desired stop loss and take profit levels Close all existing trades with a single click Delete all pending orders with a single click Reap partial profits with a single click It has no input parameters
How to Use Please Read this blog - Details Information in o
FREE

The Donchian Channel Channels are among the most popular tools of technical analysis, as they visually convey to the analyst the limits within which most price movement tends to occur. Channel users know that valuable information can be obtained at any time, whether prices are in the central region of a band or close to one of the border lines.
One of the best known techniques to explore these concepts is Bollinger Bands. However, John Bollinger was not the only one to research the applicatio
FREE

Elliot Waves Analyzer calculates Elliot Waves to Help Identify Trend direction and Entry Levels. Mainly for Swing Trading Strategies. Usually one would open a Position in trend direction for Wave 3 or a Correction for Wave C . This Indicator draws Target Levels for the current and next wave. Most important Rules for Elliot Wave Analysis are verified by the Indicator. This free version is limited for Analyzing one Timperiod Waves. Waves are Shown only in PERIOD_H4 and above. Not Useful for Intr
FREE

Another request from my brotherhood was putting the name of the Symbol being seen - a little bigger - on the Chart, just to get sure that they are seeing the correct one... Mistakes pay a high price on the market... It is a very effective, and almost resource-null-consuming indicator that displays the current Symbol Name and Timeframe in almost any position of your Chart, with any color, and any Font Size... And also you can change the divisor character that is presented between the Symbol Name
FREE
我向您介紹一位可靠的顧問,該顧問可從箭頭指標「RSI Arrow out of Zone iMA Trend」( https://www.mql5.com/ru/code/29363 ) 產生清晰、透明的訊號。
從程式碼庫下載該指標並將其安裝在 Indicators 資料夾中。
最佳時間範圍 H1。
我為顧問配備了:保護性停損 (SL/TP)、多貨幣測試的可能性、從一張圖表進行交易(在設定中指定貨幣清單)、追蹤停損和交易時間、根據總利潤平倉一個百分比。
祝交易愉快!!!
.........................................................................................................................................................................................
FREE

GiGa FX is designed to work on EURUSD Subscribe to our new channel for promo/FREE and updates! : https://www.mql5.com/it/channels/genkidamasolutions Subscribe to profile to get new announcements and look behind the scenes! https://www.mql5.com/en/users/asodoco Please support us to building FREE EAs! Leave a review ! Thank you
Recommendations
Timeframe: H1 Symbol: EURUSD An Ecn broker is always recommended A low latency vps is always recommended. The recommended Leverage a
FREE

【ZhiBiDW Trend】是一款简单、直观、有效的趋势和震荡的指标。它适合用在15分钟以上并且4小时以下的图表周期,适合所有市场品种。 Buy signal:出现蓝色向上箭头;箭头出现后会附带止损和止盈的预设价格。 Sell signal:出现红色向下箭头;箭头出现后会附带止损和止盈的预设价格。 参数设置说明: 【Send_Alert】:这是警报开关,设置成true,如果出现箭头就会自动警报提示;设置成false,则不会警报提示。 【Send_Email】:这是发送邮件的开关,设置成true,如果出现箭头就会发送邮件到你在MT4设置好的邮箱里面;设置成false,则不会发邮件。 【Send_Notification】:这是发送即时消息的开关,设置成true,如果出现箭头就会发送消息到你的移动设备;设置成false,则不会发消息。 更多好用的指标网址: https://www.mql5.com/en/users/zhengqiuyang/seller
FREE
It's a two (2) pairs correlation system to use 3 currencies to make 2 pairs to open hedge orders on those.
The expert starts opening four orders for each couple (2 plus and 2 minus) and wait to move prices in one direction to make a grid of orders.
The expert can use a maximum of 5 currencies to make 10 pairs and make 30 couples.
It is important the order of currencies is from the strongest to the weakest.
Strongest... EUR/GBP/AUD/NZD/USD/CAD/CHF/JPY ...weakest.
Canto inputs minimum o
FREE

Aggression Volume Indicator is the kind of indicator that is rarely found in the MQL5 community because it is not based on the standard Volume data provided by the Metatrader 5 platform. It requires the scrutiny of all traffic Ticks requested on the platform... That said, Aggression Volume indicator requests all Tick Data from your Broker and processes it to build a very special version of a Volume Indicator, where Buyers and Sellers aggressions are plotted in a form of Histogram. Additionally,
FREE

We often need to know the sudden change in trend that happens on the graph and this can be confirmed through indicators.
This indicator shows the moments of trend reversal and how in which trend the price is shifting.
Custom background, no need to configure the colors in the chart, just drag the indicator!
Indication with arrows.
- Blue arrow: Upward trend.
- Pink Arrow: Downward Trend.
NOTE: Free indicator, support may take a while to respond.
FREE
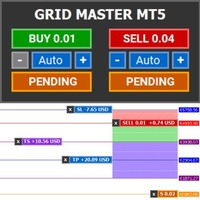
Introducing Grid Master MT5, your ultimate trading utility designed to revolutionize the management of single or multiple orders with unparalleled ease and effectiveness.
Evaluation version of Grid Master MT5 Some limitations are applied: - Maximum of 3 open positions and 1 pending order per side (Buy/Sell) - Trailing Stop feature disabled Features: Clean and user friendly UI: With the benefits of fellow traders in mind, the graphical interface is beautifully designed to allow maximum clarity
FREE

Pivot Classic, Woodie, Camarilla, Fibonacci and Demark Floor/Classic Pivot points, or simply pivots, are useful for identifying potential support/resistance levels, trading ranges, trend reversals, and market sentiment by examining an asset's high, low, and closing values. The Floor/Classic Pivot Points can be calculated as follows. Pivot Point (P) = (High + Low + Close)/3 S1 = P * 2 - High S2 = P - (High - Low) S3 = Low – 2*(High - P) R1 = P * 2 - Low R2 = P + (High - Low) R3 = High + 2*(P - Lo
FREE
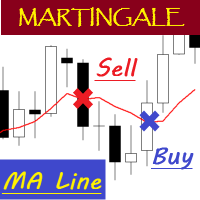
EA "MA Line" with martingale feature
To see how EA works, please watch the video below. In the video, I perform parameter optimization and do a backtest. The parameters that are optimized are: - MA Period - Stop Loss - Take Profit
For the future, I will try to optimize and test EA, especially the expert advisors in the mql5 community. hopefully it can be useful for colleagues in the mql5 community.
FREE

The Investment Castle Chances indicator will show signals on the chart for entering a buy or sell trade. There are 2 types of signals for each direction as follows: Buy / Sell (Orange colored candlesticks) Strong Buy (Green colored candlesticks) / Strong Sell (Red colored candlesticks) You may place a buy trade once you see the Buy arrow or vise versa, or you might prefer to wait for a further confirmation “Strong Buy” / “Strong Sell”. This indicator works best with the high time frames H1,
FREE
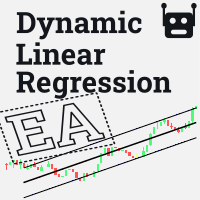
The Expert Advisor (EA) is based on the Dynamic Linear Regression indicator ( https://www.mql5.com/en/market/product/49702 ).
User inputs: Number of candles is considered when calculating linear regression; Distance to the top line; Distance to the bottom line; Stop the loss of. The EA executes purchase and sale orders in the market when the value of a line, higher or lower, is reached at the current price, when the lower line is reached, a buy order at market is executed and when the upper l
FREE

Gold TL MTF - this is a fine stock technical indicator. The indicator algorithm analyzes the movement of the asset price and reflects trend lines along the fractals of a specific timeframe (TF).
Benefits of the indicator: The indicator produces signals with high accuracy. The confirmed signal of the indicator does not disappear and is not redrawn. You can trade on the MetaTrader 5 trading platform of any broker. You can trade any assets (currencies, metals, cryptocurrencies, stocks, indices
FREE

Use this expert advisor whose strategy is essentially based on Bollinger bands as well as a personal touch.
Other free expert advisors are available in my personal space as well as signals, do not hesitate to visit and leave a comment, it will make me happy and will make me want to offer content. Expert advisors currently available: LVL Creator LVL Creator Pro LVL RSI mt5
If you want to get a configuration file to improve your experience, leave a comment on this robot, then contact me by di
FREE

Time your Entry and Exits with Average True Range (ATR) Trailing Stops ATR Trailing Stops are primarily used to protect capital and lock in profits on individual trades but they can also be used, in conjunction with a trend filter, to signal entries. The indicator will help make your calculation of stop loss easier as it will be visually aiding you in choosing where to put your stoploss level on the chart by calculating the current value of ATR indicator. For those who are unfamiliar with ATR, i
FREE

介绍适用于 MT5 的 NAS100 Auto SL 和 TP Maker: 有了我们的 NAS100 Auto SL 和 TP Maker,再也不会错过止损和止盈的设置,这是交易者在 MetaTrader 5 上浏览纳斯达克 100 市场时不可或缺的助手。该工具专为寻求自动管理止损和止盈水平的无缝解决方案的用户而设计。
主要功能
轻松实现自动化:
自动监控无止损和/或止盈的纳斯达克 100 指数交易。 根据用户配置设置动态调整水平。 订单类型的多样性:
兼容纳斯达克 100 指数的市价订单和挂单。 支持 MetaTrader 5 中的各种订单类型。 定制配置:
用户友好的参数设置允许自定义跟踪偏好和止损/止盈水平。 范围灵活:
可选择为其运行的特定 NAS100 工具或所有交易工具设置止损和止盈。 快速执行:
确保快速设置所需的 StopLoss 和/或 TakeProfit 值,无需等待新的 tick 即可迅速响应。 MetaTrader 5 兼容性:
与 MetaTrader 5 中的所有订单类型兼容,实现无缝集成。 使用 NAS100 Auto
FREE

The original author is David Weis, an expert in the Wyckoff Method. The Weis Wave is a modern adaptation of the 1930's Wyckoff Method, another expert in Tape Reading techniques and Chart Analysis. Weis Waves takes market volume and stacks it into waves according to price conditions giving the trader valuable insights about the market conditions. If you want to learn more about this subject you can find tons of videos in YouTube. Just look for "The Wickoff Method", "Weis Wave" and "Volume Spread
FREE

This comprehensive technical indicator calculates and plots up to 3 moving averages with 3 different periods. By employing three moving averages of distinct lookback periods, the trader can confirm whether the market has indeed experienced a change in trend or whether it is merely pausing momentarily before resuming its prior state. SX Golden MA Pack for MT4 is available here . The shorter the moving average period, the more closely it tracks the price curve. When a security initiates an upt
FREE
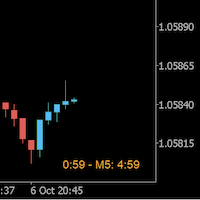
Always wanted to know when the M5 candle closes when you are in M1 ? This indicator allow to display a candle timer (countdown) on the current time frame as well as any higher time frame you have configured for this time frame. So this is easy now to see when the H4 candle closes when you are in H1.
Congifuration Label position, size, color HFT time frame per time frame Any questions or comments, send me a direct message here https://www.mql5.com/en/users/mvonline
FREE

US 30 BOT This is a simple quantitative model that trades US30 Index from NASDAQ top 30 American stocks It uses volatility contraction and expansion as a basic theory. Place it on US30 chart ,any timeframe. Hedged accounts are advised. NB: Standard accounts are preferred and well regulated brokers eg ICMarkets are advised to avoid unnecessary losses eg slippage ones,commissions and large spreads. Minimum account balance ADVISED : USD 100 HOW TO USE: A VPS is highly recommended. AWS offers 1 y
FREE
MetaTrader市场是您可以下载免费模拟自动交易,用历史数据进行测试和优化的唯一商店。
阅读应用程序的概述和其他客户的评论,直接下载程序到您的程序端并且在购买之前测试一个自动交易。只有在MetaTrader市场可以完全免费测试应用程序。
您错过了交易机会:
- 免费交易应用程序
- 8,000+信号可供复制
- 探索金融市场的经济新闻
注册
登录