 MetaTrader 5
 エキスパート
 インディケータ
 ライブラリ
 ユーティリティ
 ウィジェット
 ルール
YouTubeにあるマーケットチュートリアルビデオをご覧ください
ロボットや指標を購入する
仮想ホスティングで
EAを実行
EAを実行
ロボットや指標を購入前にテストする
マーケットで収入を得る
販売のためにプロダクトをプレゼンテーションする方法
MetaTrader 5のための無料のエキスパートアドバイザーとインディケータ - 105
 自動売買ロボットとインジケータを使用して、外国為替取引の収益性を高めます。 自動売買ロボットを使用すると、取引の開始と終了を自動化でき、インジケータは市場の行動をより正確に予測するのに役立ちます。
このページには、MetaTrader5アプリケーションのカタログが掲載されています。

Trend Quality Filter Market Structure Overview Trend Quality Filter Market Structure visualizes the currently identified market condition directly below the chart. Each evaluated candle is assigned to one of four phases according to a fixed market-structure logic. This provides traders with a clear additional classification of previous price behavior without generating buy or sell signals. What This Indicator Does The indicator analyzes the existing price structure and displays the resulti
FREE

RH Trade Info Panel - Professional Trading Dashboard A comprehensive and elegant trading dashboard for MetaTrader 5 that displays your trading performance with real-time statistics,and advanced drawdown monitoring. Key Features Multiple Time-Frame Views Daily view (last 7 days) Weekly view (last 4 weeks) Monthly view (last 3 months) Easy toggle between views with intuitive button controls Performance Tracking Real-time profit/loss tracking in dollars Pip performance calculation per period
FREE

This is a RISK MANAGER utility for MetaTrader. To activate it, after downloading it, you must enable all autotrading controls on MetaTrader, as with EXPERT ADVISORS. The user must enter control settings as indicated in the indicator properties, which initially have default data. RISK MANAGER will perform checks and display pop-up alerts when certain behaviors exceed the user-entered settings. It's free; use it, try it, develop it, or contribute ideas. It's just a utility; the programmer assumes
FREE

Highlights a specific candle after a designated time interval. This feature is particularly useful for evaluating the potential profitability of breakout strategies that are triggered at specific candle intervals. It allows traders to visually assess whether a breakout strategy, set to activate at a certain candle, would have been successful in past market conditions.
FREE
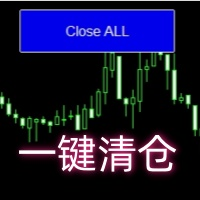
Close all open orders, delete all pending orders, and clear the entire account's orders. Please use caution! After clicking the button, the account order will be 0! Help us quickly clear account orders! As it is a free version, only the function of closing all orders is available. If other functions are needed, customization is required! The paid version has more features!
FREE
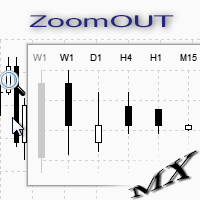
ZoomOUT allows you to have a quick look at a selected bar on a higher timeframe in a pop-up window. After the launch, the indicator works in the background mode occupying no place in the chart and consuming no resources. When activating the indicator by Shift + o (customizable), a pop-up window with a chart displaying bars of higher timeframes is created. To hide a pop-up window, left-click on any clear place on the chart. The indicator is simple and requires no settings.
FREE

RealCost Gold Session Zones MT5 is an entry-level session map utility for gold traders using MetaTrader 5. It draws Asia, London and New York session zones on the chart and shows a compact live dashboard for current-session context.
The utility is designed for visual market timing, manual preparation and quick broker-condition checks. It does not trade, does not open or close positions, and does not provide buy or sell signals.
Main features: - Asia, London and New York session zones. - Config
FREE

``` Bneu GLA Trend Indicator — Grover Llorens Activator
This indicator for MetaTrader 5 displays a dynamic trend activation line based on the Grover Llorens Activator method. The line changes color based on price position relative to the activation level, with signal arrows appearing on trend changes.
What It Does
Plots a dynamic activation line on your chart: - Green line when price is above (bullish condition) - Red line when price is below (bearish condition) - Arrows appear on trend cha
FREE

We all know that the start of an H4 candle can be 'shifted' depending on the broker. I wrote an indicator that draws candles "shifted" to the desired value. Plus, it draws H4 candles on smaller timeframes too. Works on timeframes up to H4, allowing for a clear comparison with the broker's results. There's a separate option to customize the candlestick body and outline fill. You can also customize the drawing for a specific period on history.
FREE

Supports displaying up to 4 trading sessions with fully adjustable start and end times. Each session can be customized individually with unique colors and visual styles. Users can choose between drawing rectangles or filling areas, while the indicator clearly displays each session’s price range for better market insight.
Free to use until the end of 2025. The paid version will be available starting from 2026.
FREE
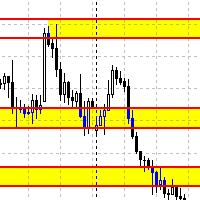
Данный советник автоматически переносит SL в зону безубытка, и по мере увеличения текущей прибыли переносит SL все выше. В отличие от стандартного трейлингстопа, этот автоматически работает со всеми открытыми позициями, которые открыты у текущего символа. Так же если выставлен флаг автоматически выставлять SL, то в случае пустого SL, автоматически выставит его.
FREE

To calculate strength of currencies and to show in table There is 1 parameter: . Show recommended pairs: true/false -> To show top 1 of strong and weak currency Tips to trade: . To trade only with strongest vs weakest currency . When H1, M30, M15, M5 of specific currency is up or down -> consider to open BUY/SELL . It can combine: + strongest currency vs weakest currency + strongest currency vs 2nd weakest currency + 2nd strongest currency vs weakest currency
FREE

Nexa Gold Relative is a professional Gold trading indicator designed for XAUUSD traders who prefer cleaner and more selective trade signals.
The indicator combines a Gold-focused price calculation engine with RSI confirmation, ATR-based trade zones, candle confirmation, session filtering, signal cooldown, and mobile alerts.
Nexa Gold Relative is built to help traders identify structured BUY and SELL setups directly on the chart, with clear Entry, Stop Loss, and Take Profit areas.
Main Featur
FREE

TSD-47 Tactical Candle Matrix Tactical Multi-Timeframe Candle Intelligence Dashboard TSD-47 Tactical Candle Matrix is a professional compact tactical dashboard designed to provide traders with instant multi-timeframe candle structure awareness in a clean, lightweight command-style interface. The indicator displays live candle direction, structure, and momentum across multiple timeframes simultaneously, allowing traders to quickly identify bullish and bearish pressure, timeframe alignment, and ov
FREE

NewsOnChart is the ultimate MetaTrader 5 indicator that integrates a sleek, lightweight, and fully interactive economic calendar right onto your trading screen. Key Features 1-Click Interactive Dashboard: Instantly switch between major currencies (USD, EUR, GBP, JPY, AUD, CAD, CHF, NZD) with a simple click on the on-screen buttons—no need to open the indicator settings. Smart Auto-Detection: The moment you drop the indicator onto a chart, it automatically recognizes the base currency (e.g., EUR
FREE
White label available. contact us for more info. dushshantharajkumar@gmail.com Replica Local Trade copier by Chart Walker
Replica, a MetaTrader 5 (MT5) local trade copier, is a powerful tool designed to streamline and automate trading processes for users within the MT5 platform. This innovative software allows traders to replicate trades from one account (master) to another (slave) in real-time, enabling efficient and synchronized trading across multiple accounts. With its user-friendly inte
FREE

This indicator will help you track performance of your trades, even scalping trades. You can use it with the Arab, and many other traders.
This indicator displays essential trading account information directly on your chart. It positions itself in one of the four corners of the screen and showcases details such as: Symbol: The symbol of the asset currently displayed on the chart. Profit/Loss: The total profit or loss in dollars for the current symbol. Pips: The total number of pips gained or
FREE

ATRRange-MT5-Ind — an indicator for MetaTrader 5 that builds volatility channels based on ATR with three multiplier levels. Indicator: Calculates ATR — uses the standard Average True Range Draws three channels around the closing price: Top1/Bottom1 (blue) — Close ± ATR × Multi1 Top2/Bottom2 (orange) — Close ± ATR × Multi2 Top3/Bottom3 (red) — Close ± ATR × Multi3 Dynamic levels — channels automatically expand/contract depending on volatility Parameters ATR Period : ATR period Default: 14 Multi1
FREE

Volume Above Average Indicator - MQL5 Introduction The Volume Above Average Indicator is a custom indicator for the MetaTrader 5 (MQL5) platform that helps traders identify the current trading volume compared to the historical average. The indicator uses three different sensitivity levels to classify volume into weak, medium, and strong, providing a clear visualization of market momentum. Key Features Displays trading volume in a separate window. Compares the current volume with the historical a
FREE

Manage your trading schedule with Raba Time Scheduler EA. Functionalities: Set up infinit time ranges. Choose between these actions when out of schedule. Close all positions. Close all negative positions and protect the positive ones. Notes: Auto enabling/disabling algo trading is disabled due to MQL Market policies.
I you have any doubt you can leave it in comments and I will anwer it asap. If you found this tool helpful for you, a comment and a good rating will be appreciated. Also any propos
FREE

Introducing the Scalping Expert Advisor (EA) for Short Trades This Expert Advisor (EA) is meticulously designed for short trades scalping, offering a blend of precision and efficiency to maximize your trading performance. Below, we delve into the key functions and features that make this EA an essential tool for scalpers.
Key Features: Automatic Take Profit (TP) and Stop Loss (SL) Settings: Take Profit Input: Allows you to set a specific TP value, enabling precise control over your exit points
FREE
RTS5PatternBTCPrice is an analytical tool for MetaTrader 5 that systematically searches for historical similarities in price action and evaluates how the market behaved after similar situations.
The indicator provides both visual and statistical information that can be used to support trading decisions. It compares the current price pattern, defined by a selected number of candles, with historical data.
The similarity results are displayed using a histogram with three categories: Good Match –
FREE

BreakEven Finder は、スキャルパーやデイトレーダーのために設計された、無料かつ軽量な MetaTrader 5 用インジケーターです。リアルタイムで保有ポジションを分析し、チャート上に損益分岐点を視覚的に表示することで、迅速かつ的確な判断をサポートします。 主な特徴: 複数ポジションの損益分岐価格を自動で計算 各エントリーポイントを平均化し、現在価格との関係を示す 見やすく整理されたデザインで、過度な情報表示を排除 あらゆる通貨ペアと時間足に対応可能 システムに負荷をかけずにスムーズに動作 おすすめのユーザー:
超短期売買を行うスキャルパー、1日複数回取引するデイトレーダー、損益の細かい変動を意識するリスク管理重視のユーザーに最適です。 トレードの精度を高めるためのツールとして、日々の取引に活用する価値があります。
FREE
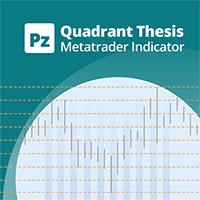
This is a general purpose indicator that displays colored lines at fixed and customizable price intervals, entered as parameters. It offers universal, constant, and familiar price ranges that allow quick and precise price analysis of a currency pair. With default parameters, this indicator implements The Quarters Theory , as described originally by Ilian Yotov . [ Installation Guide | Update Guide | Troubleshooting | FAQ | All Products | Get Help ] Easy to use No optimization needed Customiz
FREE

Investment Castle Engulfing — Never Miss an Engulfing Candle
Whether you scalp or trade the daily, bullish and bearish engulfing candles are some of the most reliable signals — but spotting them across timeframes is tedious and easy to miss. This indicator finds them for you, including an engulfing candle forming on a higher timeframe while you trade a lower one.
What it does for you Automatic engulfing detection: bullish and bearish engulfing candles are flagged for you. Multi-timeframe aware
FREE

The indicator draws two simple moving averages using High and Low prices. The MA_High line is displayed when the moving average is directed downwards. It can be used for setting a stop order for a sell position. The MA_Low line is displayed when the moving average is directed upwards. It can be used for setting a stop order for a buy position. The indicator is used in the TrailingStop Expert Advisor. Parameters Period - period of calculation of the moving average. Deviation - rate of convergence
FREE

STAMINA HUD – Advanced Market & Trend Dashboard (MT5) STAMINA HUD is a professional market information panel designed for traders who want clarity, speed, and control directly on the chart. It provides a clean heads-up display (HUD) with essential market data and multi-timeframe trend direction , without cluttering the chart or generating trading signals.
What STAMINA HUD Shows Current Price
Spread (in real pips)
Today High–Low range (pips)
Average D
FREE

Friends, join us!
Ask questions and connect with like-minded traders: MetaCOT Public Group
MetaCOT Information Channel: news, CFTC reports, and signals: MetaCOT Channel
Here’s to successful trading and new profitable signals for us all! Attention! Recently, certain countries have been blocking access to the cftc.gov website. As a result, users in these countries are giving the product low ratings. MetaCOT has always adhered to the highest quality standards and is in no way associated with th
FREE

Tired of manually clicking through every chart just to check the current spread or overnight swap fees? The Dynamic Spread and Swap is a must-have utility that solves this problem by displaying all critical cost information for your favorite trading symbols in one clean, convenient dashboard. This lightweight tool automatically detects all symbols from your open charts and presents the data in a non-intrusive panel on your screen. Stop guessing your trading costs and start making more informed
FREE

XQRR v4 FUSION – Le guide stratégique ultime Arrêtez de deviner, passez à l'action. Cette indicateu r Il présente la méthode FUSION : une stratégie clé en main pour maîtriser les marchés. Ce que vous maîtriserez : Configuration optimale : configurez vos graphiques comme un pro pour une lecture instantanée du marché. La stratégie « FUSION » : Comment aligner les périodes (MTF) pour ne capturer que les flux à forte probabilité. Entrées et sorties : règles précises pour entrer en position et pla
FREE

A script for closing positions If you need to quickly close several positions, this script will make all the routine for you! The script does not have any input parameters. Allow AutoTrading before running the script. Usage:
Run the script on a chart. If you need to specify the maximal deviation and the number of attempts to close positions, use the script with input parameters https://www.mql5.com/en/market/product/625 You can download MetaTrader 4 version here: https://www.mql5.com/en/market/
FREE

This dashboard is a complete technical command centre designed for traders who need real-time data and chart control without cluttering their workspace. It transforms a standard chart into an interactive, data-driven trading environment.
Here is a breakdown of what the Phoenix Tech Analysis dashboard offers: Real-Time Technical HUD The dashboard provides a "Heads-Up Display" that constantly calculates and displays: Trend Sentiment: Instantly tells you if the trend is Bullish or Bearish base
FREE
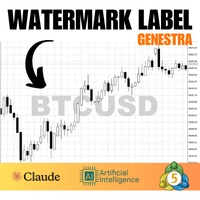
This indicator creates a watermark with the asset symbol (e.g., BTCUSD) in the center of the MetaTrader 5 chart. The text is displayed in Arial Black sans-serif font, with customizable size, color, and opacity through indicator settings. The watermark stays centered both horizontally and vertically on the chart, remaining behind candles and other elements to avoid interfering with visualization. By default, it uses light gray color with 30% opacity, creating a subtle effect that helps quickly id
FREE

The Horse Signal 1.26 – Price Action AI Indicator for Gold & Forex Overview: Start your 2026 trading year with "The Horse Signal," the latest precision tool from the WinWiFi Robot Series. Designed specifically for traders who demand high-accuracy entries, this indicator utilizes advanced Price Action analysis combined with an AI scanning algorithm to identify high-probability reversal and trend continuation points in real-time. Key Features: Dynamic Price Action Scan: Automatically analyzes can
FREE

If you can not create a background image for yourself (photo size and format must be changed), let me know. I make your photo for free. Otherwise, you can read the help file . A tool for chart management You can change the background image You can change the background color Change the color of the candles Volume colors, line charts and everything else You can also enable and disable some items Read the help file for more information
Settings:
Save Changes After Remove Tool
Back Ground Phot
FREE

Risk Pilot MT5 — 高速な約定とリスク管理パネル
MetaTrader 5のマニュアルトレーダーのための究極のインタラクティブアシスタント「Risk Pilot」で、取引リスクを完全にコントロールしましょう。精度とスピードを追求して設計されたRisk Pilotは、手動でのロット計算を不要にし、市場が動く前に瞬時に取引を開始できるようにします。
主な機能: 自動ロットサイズ設定 :選択したリスク比率と口座残高に基づいて、リアルタイムでロットサイズを自動的に調整します。 価格ベースのSL/TP:正確な価格の入力やチャートとの直接操作により、ストップロス(SL)とテイクプロフィット(TP)レベルを簡単に設定できます。 カスタムサウンドアラート :重要な瞬間を見逃しません。エントリー時、TP到達時、SL到達時に、それぞれ異なる音で通知します。 ワンタップ・ブレークイーブン :ワンクリックでSLをエントリー価格に移動させ、即座に元本を保護します。 部分決済管理 :ポジションの残りをそのまま保有したまま、50%を部分決済することで、早期に利益を確保できます。 リアルタイ
FREE

FLAT ADVANCED TREND V1.5 – Identify Trends with Professional Precision
Flat Advanced Trend is your ultimate solution. It combines the power of ADX, ATR and RSI into a visually intuitive, easy‑to‑use tool designed for serious traders. Key Features: Smart Trend Detection – Filters out market noise using ADX + +DI/–DI and displays only the most reliable signals. Advanced Filters – Includes ATR for volatility and RSI for momentum (fully customizable). Real‑Time Info Panel – Shows current trend, stre
FREE

Calculates pivot levels. It paints the histogram depending on the location of prices relative to these levels.
Parameter values: style - select the type of display (Histogram, Line, Arrow) price - price, has little effect on the final look, but this can be customized timeframe - select a timeframe for calculating levels. color over pivot line - color of everything above the pivot level color under pivot line - color of everything below the pivot level pivot line intersection color - the color
FREE

DIRECTION STRENGTH is an indicator designed to analyze the current market movement. It helps you understand not only where the price is moving , but also how strong the movement is, how long the current series has lasted, and how likely it is to continue based on historical matches. What do you see on one screen? DIRECTION → where the market is moving
STRENGTH 0–100 → how strong the movement is
SERIES → how many candles the movement has continued
TIME → how long the current series has lasted
H
FREE
Only Exponential Moving Average at Close Price is used in standard Bears Power limiting the possibilities of that indicator to some extent. Bears Power Mod enables you to select from four Moving Averages and seven applied prices, thus greatly expanding the indicator's functionality.
FREE
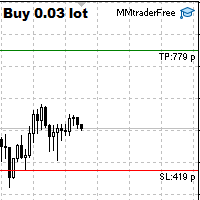
This tool is designed to quickly calculate the lot depending on the Stop Loss.
The control is done by hot keys
By default:
1 - Limit order price level
2 - Stop Loss Level
3 - Take Profit Level
Space Bar - Open an order
Escape - Cancel All 9 - Open 2 orders
Market Order
To open a Market order, click (2) and set up Stop Loss with the mouse If you want to put Take Profit - click (3) and set up Take Profit with the mouse
FREE

Your balance tells you where you are. It does not tell you how close you came to the edge.
Kingdom Guard is a free, read-only panel that puts the numbers that actually decide survival on your chart:
REAL DRAWDOWN, RIGHT NOW How far your equity sits below its own historical peak - not below your deposit. The single number most traders never watch.
YOUR LOSING STREAK - CURRENT AND WORST EVER When you are four losses deep it matters enormously whether your worst streak was five or fifteen. Know
FREE

==================================================== ENGLISH DESCRIPTION - MQL5 MARKET COMPLIANT ====================================================
GoodVibe EA is a trade management utility designed to assist traders in managing open positions automatically. It does not open trades on its own. All entry decisions remain with the trader.
The EA runs in the background and applies the configured management rules to positions that are already open — either on the current chart symbol or across
FREE

Ever wonder when next candle is due?.. This indicator, developed for the Phoenix Trading suite (v3.06), is a high-precision Visual Utility and Time-Management Dashboard. It is designed to bridge the gap between institutional-grade aesthetic and retail functional needs by providing a clean, non-intrusive environment for professional traders. Key Features Dynamic Phoenix Branding: A centrally-anchored, high-definition logo that automatically scales to your chart size. It uses an ARGB Alpha-channel
FREE

Nem Nem is super accurate mt5 indicator it is working with any pair any time frame it will show and provide you with high Winrate signal you can use for forex pairs , gold and any other pairs it is easy to use also you can see the white lines for starting and end of signals it will help you to read the chart and enter and make correct decisions in trades. also it will be clear for you when to enter and exit from any trades
FREE

The best and the only World Time Display for MT5
Features :
- JAPAN, LONDON & NEW YORK Time Display
- You can customize with different Font, Color And Text Size
- You can customize Box Position and Box Color to meet your satisfaction
- Only For Metatrader 5
- Customize GMT according to your Time Zone
- Simple To Use. Just Attach to your MT5
- No hidden code or no errors
FREE

Simple candle countdown - never again miss how much time is left to open a new bar!
This indicator doesn't plot any line on the chart - it uses only objects and calculates the time left to open a new bar.
You can set custom colors for the panel background and border and for the text color. Simple as that, the indicator is ready to use.
If you find any bugs, feel free to contact me.
FREE

This EA provides: Grid buy button and grid sell button When pressed, it enters market then subsequent layers as pending order separated by pips value for each layer. Close all button When pressed it closes all running positions and pending orders. This expert advisor does not provides means to automatically add take profits and stop losses. User must specify it manually.
FREE
Мультивалютный индикатор в отдельном окне отображает движение валютных пар в пунктах с расхождением от начала дня. Во время работы, динамически возможно включать и отключать различные пары прямо на графике. При первом запуске, возможно, потребуется продолжительное время, пока загрузиться история для основных валютных пар. Для валют CAD, CHF, JPY - график перевернут.
При повторном открытии, все настройки индикатора восстанавливаются автоматически.
FREE
This is a Price Projection for Current Candle from Time Frame M15 To Weekly, It's shows Market Trends Teji (Bullish) Or Mandi (Berries). It's Show Teji High & Low for Bullish Market and Mandi High & Low for Berries Market. We can Plan Our Trade in Well Advance for our Current Open Trade. It's Generate New Data for Every New Candle. You are requested to Please Test it with demo Ac before Use in Real Trade. Please Save it to your Mql\Indicator folder and attache to your chart. if any quay Please
FREE
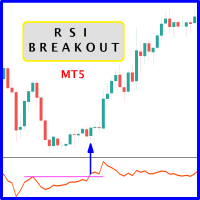
The likelihood of farther price movement increases when Relative Strength Index oscillator "RSI" breaks through its historical resistance levels in conjunction with prices breakout of resistance levels. It's strongly encouraged to confirm price breakout with oscillator breakout since they have comparable effects to price breaking support and resistance levels; similar perception is applied to short trades. Concept is based on find swing levels which based on number of bars by each side to confir
FREE
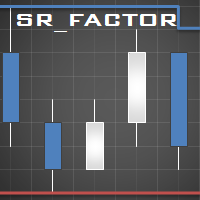
This indicator identifies short-term, medium-term and long-term highs and lows of the market according to the method described by Larry Williams in the book "Long-term secrets to short-term trading".
Brief description of the principle of identifying the market highs and lows A short-term high is a high of a bar with lower highs on either side of it, and, conversely, a short-term low of a bar is a low with higher lows on either side of it. Medium-term highs and lows are determined similarly: a
FREE
This indicator allows to hide OBV (on all MT5 timeframes) from a date define by the user with a vertical line (Alone) or a panel (with "Hidden Candles"). Indicator Inputs: Apply To Information on "On Balance Volume" indicator is available here: https://www.metatrader4.com/en/trading-platform/help/analytics/tech_indicators/on_balance_volume ************************************************************* Hey traders!! Give me your feeds! We are a community here and we have the same objective....
FREE
This indicator allows to hide Bill Williams Fractals (on all MT5 timeframes) from a date define by the user with a vertical line (Alone) or a panel (with "Hidden Candles"). Indicator Inputs: Indicator Color Indicator Width Information on "Fractals" indicator is available here: https://www.metatrader4.com/en/trading-platform/help/analytics/tech_indicators/fractals ************************************************************* Hey traders!! Give me your feeds! We are a community here and we ha
FREE

O Indicador identifica relação do Índice com a soma dos principais ativos, funciona para qualquer mercado do mund o, possui um oscilador WPR com a soma dos principais ativos escolhidos, indicando a antecipação do movimento em relação ao Índice. Características WPR com a soma dos papéis escolhidos - branco WPR do papel atual - vermelho Canal de Tendência O indicador pode indicar movimento de entradas, sendo: cruzamento das linhas cruzamento da linha Multi Symbols no -50 cruzamento entre os canai
FREE

Maximize your trading performance with Dd-uP , a revolutionary indicator based on an Exponential Moving Average (EMA) smoothing. This indicator is represented by a distinct yellow line on your charts, making it easy to identify market trends and providing precise and reliable trading signals. Key Features: Advanced EMA Smoothing : Track market trends with an EMA smoothing that reacts quickly to price changes, offering precise and real-time analysis. Buy and Sell Signals : Receive clear signals w
FREE

Risk Mirror is a read-only risk dashboard for prop firm challenge traders and funded account holders on MetaTrader 5. It watches your account and your open positions and does the risk arithmetic for you — daily loss limit, daily profit target, trailing drawdown, maximum drawdown and per trade position size — then shows the result on your chart. It places no orders, modifies no orders and closes no positions. Why read-only matters Many funded account programmes restrict or forbid expert advisors
FREE

EMA Offset Bands is a MetaTrader 5 indicator that plots a central EMA surrounded by percentage-based offset bands. The bands act as dynamic support and resistance that adjust automatically as the EMA moves. Features Central EMA trend line as the directional anchor. Percentage offset bands: upper and lower bands set as a percent of the EMA, so they scale with price. Dynamic support/resistance: the bands move with the market instead of being fixed lines. Simple, clean overlay that works on any sym
FREE

The "Price change from zero" indicator is designed to display price changes over a selected period in points.
1. The basic idea The indicator calculates the difference between the closing price on the current bar and the opening price on the bar set back by the Candle Period. The result is displayed as a line in a separate window.
2. Interpretation Positive value: The price has increased over the period.
Negative value: The price decreased during the period.
Zero value: The price has retur
FREE

Quasimodo Genie Indicator for MetaTrader 5 Introducing the Quasimodo Genie , a technical analysis indicator for MetaTrader 5 that is designed to automatically identify the Quasimodo or "Over and Under" pattern on your charts. This tool provides visual signals based on the structure of this popular chart pattern. This indicator is built to assist with pattern recognition and analysis by highlighting key swing points. It also offers a range of customizable settings, allowing you to fine-tune the
FREE

If you like this product, please give it a 5 star rating as a token of appreciation.
This indicator draws vertical lines marking key Forex trading sessions (Asian, London, New York) for a configurable number of past days. These “Silver Bullet” lines help traders quickly visualize session start and end times on the chart.
DaysToDisplay: How many previous days’ session lines to show. Session colors: Customizable line colors for each session. Session start hours: Local server hours for each sessi
FREE

Versión Beta El indicador técnico Non Lag MA MTF (Non-Lagged Moving Average Multi-Time Frame) es una versión avanzada del Non Lag MA que permite visualizar la media móvil en varios marcos temporales simultáneamente. Pros: - Visión integral: Proporciona una visión más completa al mostrar la media móvil en diferentes marcos temporales en un solo gráfico. - Anticipación de tendencias: Ayuda a anticipar cambios de tendencia al observar la convergencia o divergencia de las medias móviles en distint
FREE

ATR Master – チャート上のボラティリティ・マスター! ATR Master は、 プロ仕様の ATR インジケーター で、重要なデータをチャート上に瞬時に表示します! 価格変動範囲の分析、移動距離の測定、残りの変動可能性の評価 に加え、ローソク足のタイマーや現在のスプレッドも監視できます。 なぜトレーダーは ATR Master を選ぶのか? 日次 ATR 分析 – その日の平均価格変動範囲を確認でき、選択した期間が括弧内に表示されます。
ATR 移動済み – 価格がすでに移動した pips 数を追跡。
ATR 残り – 価格がまだ動く余地があるかを判断。
ローソク足タイマー – 現在のバーが閉じるまでの残り時間を確認。
スプレッド監視 – 取引開始前に市場状況を把握。
言語選択 (JP/EN) – ワンクリックで表示言語を切り替え可能! ATR Master の主な特徴: リアルタイムデータ – 情報は遅延なく更新。
柔軟なカスタマイズ – カラー、サイズ、テキストの位置を調整可能。
簡単な操作性 – す
FREE

このスクリプトは、トレーダーが可能な利益と損失の比率が最適になる貿易取引の平均期間を決定できるように設計されています。 まず、貿易取引の最適期間を決定するための一般的なアプローチを見てみましょう。以下の変数を紹介します。 R - トランザクションの結果 T - トランザクションが開かれていた時間 W - 前のトランザクションの終了と次のトランザクションの開始の間の時間 すべてのトレーダーは、最短時間で最大の利益を得ることを目指しています。この欲求は次の簡単な表現で説明できます。 R/(T+W)→max 。 変数 T と W がトレードの合計期間と行われたトランザクションの数の両方に依存することは明らかです。トランザクションの平均期間を ATD 、トランザクションの合計数を N とします。その場合、トランザクションの平均期間は、合計の平方根に比例して増加するはずです。つまり、 ATD~√N しかし、現存する十分に根拠のある質問があります - 他の取引期間と同等の取引期間はありますか?そして、取引期間はトレーディング業務の結果にどのように影響しますか?提起された質
FREE

This is the MT5 version. Get Dual Onset MT4 here
It is an algorithm to detect trend changes early. You should try multiple values for the Multiplier parameter (1 <value <10 recommended). At first glance you can see effective entries. This is, in fact, one of the rows that Geleg Faktor initially had. But it was removed because it was no longer needed. The other rows were sufficient for G.Faktor's effectiveness, but I still wanted to share this one.
Always test before using it on your live ac
FREE

Multi-Period Profit Display Indicator for MetaTrader 5 Brief Description A sophisticated indicator that displays real-time profit/loss across 4 different time periods simultaneously in the top-right corner of your MetaTrader 5 chart. Features detailed Buy/Sell position breakdown for comprehensive daily analysis. Key Features 4 Time Periods Displayed Daily Buy & Sell - Breakdown by position type (Buy/Sell) for today Daily Total - Total daily profit/loss Weekly - A
FREE
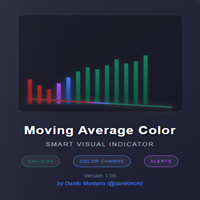
Moving Average Color - Indicador Inteligente para MT5 Descrição Geral O Moving Average Color é um indicador avançado que combina média móvel tradicional com sistema visual inteligente de cores. O indicador muda automaticamente as cores da média móvel e das velas (candlesticks) baseado na posição do preço em relação à média, oferecendo uma análise visual clara e instantânea da tendência do mercado. Principais Características Funcionalidades Principais: Média Móvel Configurável : Suporte a
FREE

The Moving Average
( https://www.youtube.com/c/TheMovingAverage/ )
inspired to create All in One 4MA-s with his color setting.
It Put up 4 Smoothed Moving Averages
With Arty chosed colors.
You can modify the settings / Parameters of the indicator
It's easy to use don't have to waist time to set up all 4 MA-s
just put this up.
Hope its helpfull and Arty don't mind it.
You can donate my work here:
https://discotechnika.hu/MQL/PayPal_Donate.jpg
or here
PayPal.Me/HunSkippy
FREE

The indicator draws a normal chart by coloring it in colors based on prices calculated by the Heiken Ashi indicator algorithm.
That is, the shape of the candles does not change.
In fact, this is the same Heiken Ashi that does not distort the price chart.
Then there will be a drawing of a cat, because there is nothing more to write about the indicator. .
FREE
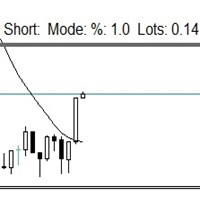
この小さなツールは、チャート上で線をドラッグするだけでリスク管理を定義するのに役立ちます。アカウント%または固定金額に基づいて計算された実際のロットサイズがラインで直接表示されます。
キーボードの「t」キーを押してラインをアクティブにし、ラインをストップロスポイントまでドラッグするだけです。それでおしまい。
設定では、線とテキストの色と幅、行と右側のテキストのスペースを定義でき、リスクを口座または固定金額のパーセントで設定できます。
ご質問やご希望がございましたら、お気軽にお問い合わせください。
この小さなツールは、チャート上で線をドラッグするだけでリスク管理を定義するのに役立ちます。アカウント%または固定金額に基づいて計算された実際のロットサイズがラインで直接表示されます。
キーボードの「t」キーを押してラインをアクティブにし、ラインをストップロスポイントまでドラッグするだけです。それでおしまい。
設定では、線とテキストの色と幅、行と右側のテキストのスペースを定義でき、リスクを口座または固定金額のパーセントで設定できます。
ご質問やご希望がございましたら、お気軽にお問
FREE
MetaTraderプラットフォームのためのアプリのストアであるMetaTraderアプリストアで自動売買ロボットを購入する方法をご覧ください。
MQL5.community支払いシステムでは、PayPalや銀行カードおよび人気の支払いシステムを通してトランザクションをすることができます。ご満足いただけるように購入前に自動売買ロボットをテストすることを強くお勧めします。

取引の機会を逃しています。
- 無料取引アプリ
- 8千を超えるシグナルをコピー
- 金融ニュースで金融マーケットを探索