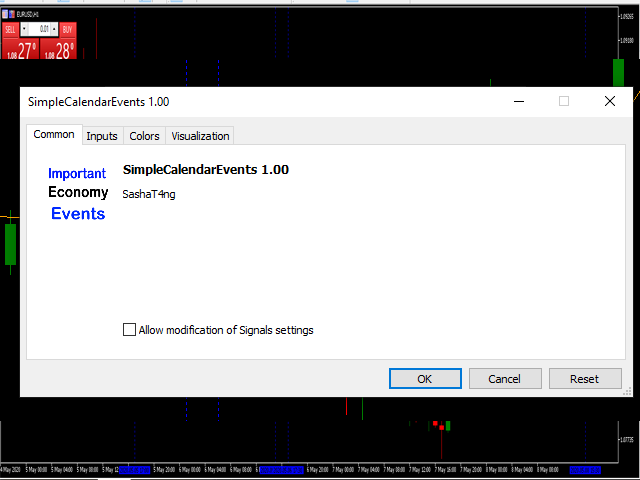
Simple Calendar Events
- インディケータ
- バージョン: 1.0

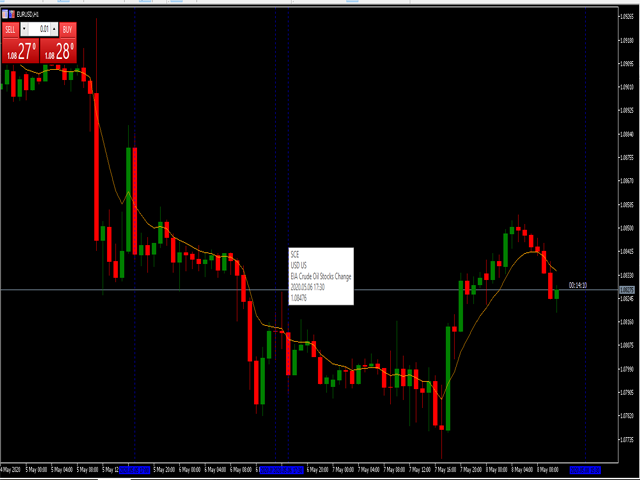
Simple Calendar Events is an indicator that will mark important Important Economy Events on your chart. For example, if you are trading something that is USD based, you would like to know when some important events are coming, you can expect some volatility or some different Price action, so you can base your strategy on it. If you trade something that is country based you can also choose that, and it will show you when the event is, so you can be prepared for it.
When you hover with the mouse on the line that represents the event, it will tell you what the even is.
For
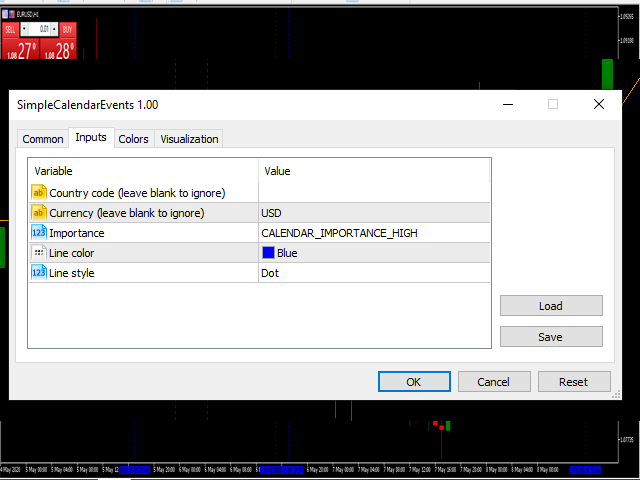
currency let say EURUSD you want USD news, and related events and you want EUR, you should put 2 times the indicator on the chart, and one is made
on USD, second, you put EUR currency in inputs.
If you trade NA100, SPX500, and you need country related you put on country code the US, EU for Europe.
It's easy to use, and I find it useful myself, and I am using it. Hope it will help you also.


ユーザーは評価に対して何もコメントを残しませんでした