 MetaTrader 5
 Experts
 지표
 라이브러리
 유틸리티
 위젯
 규칙
MetaTrader 4용 Expert Advisor 및 지표 - 65
 트레이딩 로봇은 자동으로 시장거래를 수행하는 반면 지표는 가격을 더 잘 분석하고 가격 행동을 예측할 수 있게 해줍니다.
이러한 어플리케이션을 사용하면 MetaTrader 4에서 더 많은 기회를 포착하는 동시에 보다 정보에 입각한 방식으로 거래를 수행할 수 있습니다.

This indicator continuously, smoothly changes the color of candlestick edges and bodies, as well as the color of volumes in real time like a lamp. The indicator is easy to use. The palette of colors is diverse. This product is a graphical solution, so it is difficult to describe what it does by text, it is easier to see by downloading it, besides the product is free. The indicator is suitable for bloggers who want to create a beautiful picture of a chart for video editing or traders who want to
FREE

Lord Info is an indicator for the financial market on the META TRADER 4 platform.
You can place Lord Info on any stock / currency pair on your platform.
Lord Info is able to show us the ATR report for the last (10) days or configurable, where we can see the base volatility of the pair, and its consequence.
The average true range (ATR) is an indicator of market volatility used in technical analysis. It is typically derived from the 14-day simple moving average from a series of real-range indi
FREE
이 표시기는 트레이딩 터미널에서 차트의 스크린샷을 편리하고 빠르게 만들 수 있도록 설계되었습니다. 차트를 특정 디렉토리에 저장하는 과정을 크게 단순화하여 한 번의 클릭으로 활성화되는 차트에 버튼이 있는 편리한 인터페이스를 제공합니다.
인디케이터의 주요 기능은 다음과 같습니다:
버튼을 누르면 차트 스크린샷이 자동으로 생성됩니다. 스크린샷을 저장할 디렉토리를 선택할 수 있습니다. 하나의 차트에서 여러 개의 인디케이터가 작동하는 경우 스크린샷을 구분하기 위한 사용자 지정 접두사. 파일 형식 선택: PNG 또는 GIF. 하나의 차트에서 버튼이 겹치지 않고 여러 개의 지표 인스턴스 지원. 인디케이터 매개변수:
디렉토리 - 스크린샷을 저장할 폴더입니다. 접두사 - 파일을 구분할 수 있는 스크린샷 이름의 접두사입니다. 확장자 - 파일 형식(PNG 또는 GIF). 스크린샷은 “MQL\Files\” 폴더에 있습니다.
FREE

This indicator simplifies the process of creating chart templates by allowing you to save your current chart settings to a template with just one click of a button. The indicator adds a button directly to the chart that automatically saves the template with a given name and prefix, making it easy to organize and use templates.
The main functions of the indicator are:
Creating a template of the current chart with a single click on the button. Possibility to specify a prefix for the template na
FREE

Investment Castle Panel — Your Trades, At a Glance
The Panel puts the numbers that matter right on your chart: floating profit and loss, drawdown and more — for manual trades and for any Expert Advisor. A clean, movable dashboard so you always know exactly where you stand.
What it does for you Live P/L on the chart: floating profit/loss for the current symbol, for both buy and sell orders, in your base currency and in pips. Max drawdown at a glance: keep an eye on risk without digging through
FREE

R Alligator 지표는 Bill Williams가 도입했으며 3개의 평활 이동 평균을 사용하여 추세를 따릅니다.
기본적으로 다음 값이 사용됩니다. 13주기 평활 이동 평균(조라고도 함) 8주기 평활 이동 평균(치아라고도 함) 5주기 평활 이동 평균(입술이라고 함)
R Alligator 표시기는 평활 이동 평균을 사용하여 잘못된 추세 거래 수를 줄입니다.
기본 거래 신호 R Alligator 표시기는 일반적인 크로스오버 시스템 표시기입니다.
구매 거래 조건:
5일 평활 이동평균선이 8일 평활 이동평균선 위에 있고 13일 평활 이동평균선 위에 있습니다. 13일 평활 이동 평균 위의 8일 평활 이동 평균 매도 거래 조건:
8일 평활 이동평균선과 13일 평활이동평균선 아래의 5일 평활이동평균 13주기 평활이동평균 아래의 8주기 평활이동평균 형질 통화쌍: 모두
플랫폼: 메타트레이더 4
유형: 차트 패턴 표시기
사용자 지정 옵션: 가변(턱 기간, 턱 이동, 치아 기간,
FREE

Quick Close Pro by one click: * Close Buy positions * Close Sell positions * Close Win positions * Close All positions * Close All pending orders To close all positions by one click from your Telegram, please refer Master Close . Thank you! Join my channel here for more useful EAs: - Tele Notify, Price Alert, Equity Alert, Remote Algo OnOff - Auto SLTP, Close Timer
FREE

ForexInsured — Risk Management, Loss Insurance & Trading Performance Analyzer Trade Smart. Manage Risk. Protect Your Capital. ForexInsured is a comprehensive trading risk-management and performance-analysis solution designed for MetaTrader 4 (MT4) and MetaTrader 5 (MT5) . ForexInsured is built around a simple idea: your first responsibility as a trader is to protect your capital. The system helps traders understand their exposure, manage potential losses, analyze trading performance, and learn f
FREE

R Wavy Dash 표시기는 가격 데이터를 거래 시작 및 종료에 작동하는 우수한 추세 추종 신호 표시기로 변환합니다. 메인 차트에 컬러 신호선으로 나타나며 독립형 거래 도구로 사용할 수 있습니다.
R Wavy Dash 지표는 매우 안정적이고 가벼우며 거래 플랫폼의 속도를 늦추지 않습니다.
키 포인트 추세 신호 표시기 초보자 친화적 다시 칠하지 않음 지표 컬렉션에 추가할 가치가 있음 이 지표는 가능한 추세 반전 확인 도구로 기존 거래 전략 또는 시스템과 함께 작동할 수 있습니다.
기본 거래 신호 R Wavy Dash 표시기의 신호는 해석하기 쉽고 다음과 같이 진행됩니다.
구입
녹색 신호선이 차트에 그리기 시작하면 새로운 매수 신호가 제공됩니다. 손절매를 지지선 아래에 두십시오. 미리 정해진 이익 목표를 위해 매수 거래를 종료하거나 매도 신호를 기다리십시오. 팔다
빨간색 신호선이 차트에 그리기 시작하면 새로운 매도 신호가 제공됩니다. 손절매를 저항 위에 놓습니다. 미리 정
FREE

동적 채널. 채널 너비는 가격 움직임에 따라 자동으로 변경됩니다. 채널의 중간에서 편차가 클수록 경계가 넓어집니다. 표시기는 사용자가 설정 한 차트 섹션("기간"매개 변수)의 움직임에 맞게 조정됩니다. 따라서 가격이 주어진 간격으로 급격한 변동을 한 경우 채널이 확장되어 더 강한 변동을 기대합니다. 즉,그 매개 변수는 항상 현재 시장 상황에 해당합니다.
이 채널은 과거 데이터 분석을위한 것이 아닙니다! 그 조작성을 확인하려면 테스터에서 실행!
채널은 이전의 움직임에 따라 넓어지고 좁아집니다. 이러한 움직임은"기간"매개 변수에 따라 다릅니다. "기간"=200 을 설정하면 채널이 마지막 200 바의 움직임에 맞게 조정됩니다. 채널의 위쪽 및 아래쪽 경계는"기간"에 대한 이전 움직임의 가장 큰 편차에 따라 접근하거나 멀리 이동합니다. 따라서 가격이 중간 선에서 더 일찍 이탈할수록 채널이 더 넓어지고 더 조용한 움직임으로 채널이 좁아집니다. 동시에,채널의 본질은 동일하게 유지하고있다.
FREE
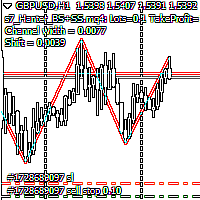
Script Hunting for the Channel Breakout The script is designed for semi-automatic trading. It can place required number of pending BuyStop and SellStop orders with preset StopLoss and TakeProfit levels in one go. The script calculates the channel width using the ZigZag indicator and places a grid of pending BuyStop and SellStop orders according to specified settings. The first pair of pending BuyStop and SellStop orders is placed at the specified distance from the channel's borders. This distanc
FREE

TradeFlow SR Analytics Pro is a high-performance analytical tool designed to automate the identification of key Support and Resistance (S/R) levels combined with market flow dynamics. The indicator pinpoints zones where institutional liquidity is concentrated and visualizes them instantly on your chart. Key Features: Smart SR Zones: Automatically plots significant price levels based on historical volatility and volume clusters. Flow Momentum Filter: Built-in logic to distinguish between g
FREE

버튼 하나. 클릭 한 번. 깨끗한 차트. MT5 version
모든 것을 그렸습니다. 추세선, 피보나치, 사각형, 구역, 화살표… 차트는 현대 예술 작품처럼 보입니다. 아름답지만 — 가격이 보이지 않습니다. NAKED CHART 이 한 번의 클릭으로 해결합니다. 한 번 클릭 → 모든 드로잉이 즉시 사라집니다 다시 클릭 → 모든 것이 원래대로 돌아옵니다 지표는 영향 없음 — 드로잉만 숨겨집니다 드래그 가능한 버튼 — 차트 어디에나 배치 가능 설정 없음. 복잡함 없음. 모든 것을 바꾸는 버튼 하나.----------------- --------------------------------------------------------- 「때로는 가장 깨끗한 차트가 가장 강력하다.」
— SPARTACUS2026
FREE

This indicator provides common shapes as drawing object options. The shapes are rotatable, resizable, draggable, and will keep their proportions (according to their handle trendline) across different chart scales. Multiple drawings are supported.
Shapes: Square Rhombus
Triangle (quadrilateral & isosceles) Circle (grid, overlapped grid, flexi grid, rotatable grid, concentric circles) Features: rays (all object edges will be rays) show/hide each individual drawing type, or all delete last drawn ob
FREE

PulseBar takes the guesswork out of trade management. It puts a horizontal line on your chart that you can drag anywhere. At whatever price you place it, PulseBar shows what your open positions on that symbol would make or lose if price got there. The figure is in your account currency and already includes swap and commissions. It suits Price Action traders, scalpers and day traders who want to see Take Profit targets, partial exits, risk zones and their exact breakeven without leaving the char
FREE

MNFM Trading Hub MT4 A local trading dashboard and manual order-management utility for MetaTrader 4. Review technical conditions, prepare market or pending orders, and optionally enable account-wide equity protection from one panel. Entries require your review and confirmation. New in version 1.48 ACCOUNT HEALTH now shows DD at the top right: current balance-to-equity drawdown, calculated as max(0, (Balance - Equity) / Balance x 100). DD is zero when equity is at or above balance and N/A when ba
FREE

What is the Market Sessions Indicator? The Market Sessions Indicator is a technical analysis tool designed for the MetaTrader 4 platform. It visually represents the trading hours of major financial markets (Asia, Europe, USA, and other key sessions) on the chart. By marking each market session with colored rectangles, it helps traders understand which markets are active and their impact on price movements. What Does It Do? Visualizes Market Sessions : Displays key trading sessions such as Asia,
FREE
스타일이 중요하기 때문에 매번 속성을 클릭하여 초의 색상을 변경하고, 배경을 밝거나 어둡게 만들고, 격자를 삽입하거나 제거하는 것이 얼마나 성가신 일인지 압니다. 클릭 한 번으로 해결하는 방법은 다음과 같습니다. 트레이더가 원하는 캔들 스타일을 선택할 수 있는 3개의 맞춤형 버튼. 낮과 밤 모드 사이를 전환하는 버튼입니다. 차트에서 그리드를 표시하거나 숨기는 버튼입니다. *****설정에서 화면에서 버튼을 표시할 위치를 선택할 수 있습니다.**** 내 다른 제품도 확인하십시오 https://www.mql5.com/en/users/javimorales.fer/seller MT5 버전 확인: https://www.mql5.com/en/market/product/69070 RSI 지표는 무엇입니까? RSI는 0에서 100까지 측정할 수 있는 오실레이터로 표시됩니다. 이 지표는 J. Welles Wilder Jr.가 개발했으며 1978년 그의 저서 New Concepts in Technica
FREE

The Complex Chaos EA is an automated system that uses a pair of exponential moving averages to detect the market direction and opens trades on candle open. If the market moves against a trade it will at a set distance open another trade in the same direction to move the take profit of the group of open positions closer to the current price and make the group of trades winners overall once the price reverses. If a change in direction is detected then all trades are closed and it starts trading in
FREE

!!! New faeture sending Signals as VIP EMAILS
MT4 Telegram Signal is tool, which sends selected trades via magic number to telegram channel, sms and email to user. Tool sends trades when open and close with chart to telegram chanel. It also sends every modification from trades to telegram. Tool can send multiple charts and magic numbers and pairs from a single chart. For this you have to fill in on the chart corresponding magic number to be sent by the chart. Send information of all type of ord
FREE

The Stoch_bot Expert Advisor is a simple robot for trading from overbought/oversold levels based on the Stochastic indicator.
For the convenience of traders, many features have been added to make trading more comfortable and secure.
The Expert Advisor has a built-in author's indicator of protection against unidirectional grid.
Recommended tools : USDCHF; GBPUSD;
EURUSD;
USDJPY;
USDCAD;
AUDUSD;
EURJPY;
recommended minimum mm and settings: usdchf, deposit = $ 1000 , lot = 0.01 , expected
FREE

Trading Robot "Donald V3.0" for MT4 Introduction Product Name: Donald Platform: MetaTrader 4 (MT4) For Sale: MQL4 Market Robot Characteristics Key Parameters TimeFrame: M15 (trading time frame) RiskPercent: 3.0% (percentage risk of the deposit for each trade) FixedLots: 0.0 (fixed lot size if not using percentages) ATRPeriod: 14 (ATR indicator period) StopLoss: 10 (Stop Loss value in ATR units) TakeProfit: 30 (Take Profit value in ATR units) TrailingStop: 20 (Trailing Stop value in ATR units) Tr
FREE
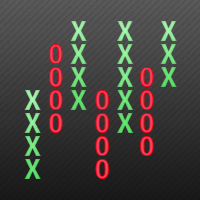
This indicator displays Point & Figure charts (PnF charts) in the indicator window. PnF charts show only price movements that are bigger than the specified box size. It helps to eliminate noise and allows focusing on main trends. Time is not a factor here. Only price movements are taken into account. That is why PnF chart is not synchronized with the main chart it is attached to. More about PnF charts: http://stockcharts.com/school/doku.php?id=chart_school:chart_analysis:pnf_charts Indicator wor
FREE

Flash Scalper is a scalper Expert Advisor that exploits acceleration of volatility of the market. It goes into action when there is an explosion of volatility for example during the news or special events. The minimum volatility is settable from input parameters. The EA work every time with stop loss and take profit, no martingale. Any initial deposit on account is allowed to start work with this expert advisor. The most important conditions for this expert advisor are low spread and fast execut
FREE

MT4 Tick History Sync – Real Tick Downloader, History Verification & Data Export Download. Synchronize. Verify. Export. Make Every Backtest Count. Are you confident that your MetaTrader 4 backtests are using complete real tick history? Missing historical ticks can compromise the reliability of your backtesting results, especially when testing scalping strategies, high-frequency trading systems, and Expert Advisors that depend on precise price movements. MT4 Tick History Sync by Zistilo is a prof
FREE

TradingPanel X EA is a simple trading panel with some nice addons: Integrated News Feature Dynamic Take Profit Multiple Trade handling The EA has integrated dynamic Take Profit, this means, if you reach your defined TP it gives you the chance to follow on the Trend by dynamic TP & SL and extend your profits. Also a News Filter function is integrated. The EA working with real TP & SL not virtual.
Important:
Get informed about new Products, join our MQL Channel: https://www.mql5.com/en/channel
FREE

Using hotkeys, you can create graphic objects of different drawing styles and different colors on the active chart. You can change the formatting styles for graphics. You can choose default drawing styles, or set them in the advisor properties selection window. Going to the graph, when creating graphic objects, the color, line type and line thickness are selected automatically. Drawing styles for graphical objects will depend on the current timeframe where drawing will be performed. Please watch
FREE

Buy a Coffee for Yuniesky Carralero Cuellar
This indicator draws the RED - GREEN and GREEN - RED candlestick pattern, the green candles that close above their previous red candle, and the red candles closing below your previous green candle. https://www.youtube.com/shorts/MdJvatl_mng Input Parameters 1. RED - GREEN: Draw the green candles that close above their previous red candle. 2. GREEN - RED: Draw the red candles that close below their previous green candle. 3. PREV CANDLE: Draw previous
FREE

Xauiq Trade Manager is a position management utility designed for manually opened XAUUSD trades. It does not generate entry signals and does not decide whether to buy or sell. After a manual position is detected, the utility manages risk, partial profit taking and the remaining position according to the confirmed settings. Main Features Manual Position Management The utility manages eligible manually opened positions and detects the actual Buy or Sell direction before calculating any level. Each
FREE

Auto Stop Trail And Profit is an expert advisor that monitors orders, when it detects that one has been placed, on the same chart that has been activated or on all assets, depending on its configuration, it will place its respective stop loss, take profit and perform trail stop loss (in a classic way, keeping a distance or "step by step").
You can see more of my products here: www.mql5.com/en/users/joaquinmetayer/seller
FREE

Features:
1. Your constructor strategies.
2. Large selection of standard indicators.
3. Exact market entry according to your strategy.
4. Slip filter.
5. Support for four and five characters.
6. Trend trading.
7. Trading in flat.
8. Minimum deposit.
9. Aggressive or quiet trade.
10. Limit the lot. 11. Position tracking.
12. Restoring balance after loss.
Input parameters
Lot - fixed lot size. StopLot - lot restriction. UseVxod - enable / disable login pattern. UseStop -
FREE
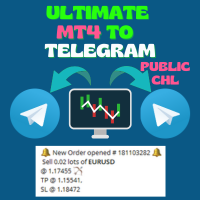
Ultimate MT4 to Telegram Public Channel sends controlled trades (via symbol, magic, comment) to a public telegram channel. It sends open and closed trades, including pending orders and TP/SL modifications, along with chart screenshots, to this public telegram channel. Additionally, you can send trade reports of open trades and summary profit/pip reports for day, week, or month. You can customize the design of the trade actions or reports with variables and emoticons.
A beautiful panel allows
FREE

Here are several indicators that work together. It basically works with moving averages and various levels of ATR creating a dynamic channel through which the price is drained. As I always recommend, you should try it before using it in live so that you understand how it works. The market entry signal is similar to other MA indicators, but with this one you also have a graphical analysis of the moment when the trend is found and dynamic levels to adjust your stop loss and take profit depending
FREE

This is a very fast and not redrawing ZiGZag; it supports switching the segments at breakouts of price levels located at a specified distance (H parameter) from the current extremum. MinBars parameter sets the depth of history for drawing the indicator; 0 means drawing on the entire history. SaveData parameter allows writing the coordinates of extremums to a file (time in the datatime format and price). Some statistics calculated on the basis of the ZigZag is displayed in the form of comments.
FREE

The Real Flow Defense Levels indicator is a proprietary tool designed to identify and plot significant, high-conviction price zones directly onto your main trading chart. It uses a dynamic, volume-based analysis to determine where the market has previously demonstrated the strongest defense or concentration of activity . These plotted lines serve as dynamic support and resistance levels , highlighting the prices where major participants are most likely to enter or defend their positi
FREE

ATR Pyramid ️: Your ticket to stacking profits higher than a Jenga tower on steroids , turning market volatility into a trend-surfing ️, position-adding party where only the first trade risks a wipeout , while you safeguard the rest by sliding your stop loss up like an elevator , creating a comfort zone that's the only real path to multiplying your forex account faster than a rabbit on espresso !!! Attention all you profit-stackers and trend-surfers! ️ This ATR Pyra
FREE
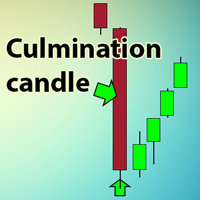
The indicator searches for the largest candles with minimum wicks for the last X candles. Sometimes, such candles mark the presence of a strong buyer, who quickly and strongly pushes the price in the right direction. However, most often, these are culmination candles, especially at the end of a prolonged trend when a single large candle knocks out stop losses of the most persistent traders and the price reverses instantly. The indicator allows you to open a position on the very edge of the marke
FREE

The indicator displays the RSX oscillator in a separate window. The indicator's signals are best used as signals for opening a deal when the price breaks the high or low of the bar on which the signal was given. The opposite signal cancels the previous signal. Settings: Data period for indicator calculation - data period for indicator calculation; Price used to calculate the indicator - price used to calculate the indicator; Oversold level (-1=> 0 <=1) - oversold level; Overbought level (-1=>
FREE

After 7 years I decided to release some of my own indicators and EAs for free.
If you find them useful please Show support with a 5-star rating! Your feedback keeps the free tools coming! See other my free tools as well here
_________________________________ Intraday Intensity Index (III) for Precision Forex Trading The Intraday Intensity Index, meticulously developed in MQL4, is a cutting-edge tool designed for enhancing forex trading analysis. This indicator offers a deep di
FREE

GMMA indicator that looks like a cloud. The GMMA indicator is easy to read, but to make it even more visually pleasing, we made it look like an Ichimoku Chart cloud. Colors have been changed where short-term and long-term overlap.
My other products https://www.mql5.com/ja/users/studiotam/seller
Please reduce the character limit a bit. I have nothing more to write.
FREE
Server Time On Chart is a simple indicator that shows the time of the broker's server with hours, minutes and seconds in the lower left corner of the chart's. Within the inputs you can only change the size of the font and the color you want depending on your taste. You can see more of my publications here: https://www.mql5.com/en/users/joaquinmetayer/seller
FREE

Aggressive trading robot, be careful over the long term but for a fun account to try to make gains quickly without fear of losing your investment, it can make a profit in a good period. This expert always takes at least two positions in buying and selling. It uses the so-called hedging system to compensate for losses on one side or the other. It can be used with or without indicators for the opening of a trade, it is however more judicious to enter the purchase or the sale with good signals. Tw
FREE

SmartStochasticMt4 is a universal indicator for making trading decisions. An indispensable tool for novice traders, as it has no settings and is ready to work after installation.
Advantages of the indicator:
1. Works with any trading symbol
2. Works on any time period
3. Has no configurable parameters
4. Provides a complete picture of the trading situation from different time periods
5. Not late
Working with the indicator
1. To set the indicator
2. To exclude from the time of the release of im
FREE

DAX MACD Bollinger Breakout (M15) is a fully automated MetaTrader 5 strategy designed to capture clean breakout moves on the DAX index using a momentum + structure confirmation model with rule-based pending STOP execution. The EA was tested on DAX on the M15 timeframe from July 8, 2017 to August 22, 2025 (MT5 hedged). No parameter setup is required — the system is delivered with optimized and fine-tuned settings.
Recommended broker: Any MT5 broker offering DAX (GER40) with EET server time (Rob
FREE

Introduction This Indicator Is Based On Average Price/Maximum Price Moves, And Using Moving Bollinger Bands And Moving Averages.
The Advantage Of Using It With YOUR own Analysis Will Confirm Potential Supports And Resistances While it Compliments With Your Analysis
The Indicator Is Non-Repainting
AND Along With Our Special Trend METRE that Changes With The Conditions OF A Bullish Or Bearish Trend....
Recommend Time-Frames: H1 H4 M15
Usage: The Indicator Is Very Profitable If Use
FREE

Удобная торговая панель для MT4 с поддержкой нескольких символов. Быстрые кнопки Buy / Sell / Close All. Гибкие настройки: лот, SL/TP в $, Magic, спред. Настраиваемый интерфейс (цвета, размеры, позиция). Максимум удобства для ручной торговли. Кому подойдёт: MultiSymbolPanel — это инструмент для трейдеров, которые хотят: Управлять сделками вручную, но быстрее и удобнее; Контролировать несколько валютных пар с одной панели.
FREE

The Robot's Logic
Check the longer time frame range, and if the price breaks that range, it opens an entry.
BUY and SELL entries are decided based on RSI overbought and oversold conditions.
The logic is very simple, but longer time frames such as H4 give the best performance. Please attach EA on the TF H4 and buy and sell entry is closed with profit target which is auto calculation.
FREE

This indicator softens the value of the RSI (Relative Strength Index) and reduces its volatility. You can use this indicator in your expert advisors, indicators and strategies. With this indicator, you don't need to have two indicators on the chart at the same time. For example, an RSI indicator and a Moving Average indicator If you have any questions or concerns, contact me.
FREE
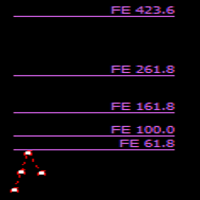
This is Fibo Expansion. You can use it, as profit target at any level... It use price Highs and Lows and price between... It is simple and easy to use... No Input menu, just drag it on your chart and it ready to use... The blue and red dot color indicate it direction... It also use as the same as fractal high and low price as the points to construct the levels... No more analysis to choose the points..
FREE

A simple, time-based execution utility that closes all open trades at a specific hour and minute each day. It operates continuously, checking every tick for the designated closing time.
Features: Inputs for `CloseHour` (0-23) and `CloseMinute` (0-59). Independent controls for closing Buy and Sell orders. Once the current time equals or exceeds the set time, all eligible orders are closed.
Effective Uses: Daily Cut-off: Automatically close all intraday trades at the end of your trading session
FREE

Uses of EA - Trailingstop: Move stoploss continuously. - Breakeven: Move the stoploss once. Custom parameters: All OrderOpenTime: + true: acts on all order + false: only affect the order opened since EA run All OrderType: + true: acts on all order. + false: only the order is running (Buy, Sell) TraillingStop: true (Use), false (do not use) TrailingStop Save (Point) TraililngStop Distance (Point) BreakEven: true (Use), false (do not use) BreakEven Save (Point) Brea
FREE
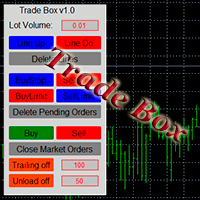
A small trading panel makes it easier for a trader to visually place pending orders, market, as well as trailing and unloading the grid of orders.
It is installed as a regular adviser. Parameters and description:
Lot Volume: 100 - in this field you can set, change the order volume at any time
Line UP - visual horizontal level for pending BuyStop and SellLimit orders
Line DN - visual horizontal level for BuyLimit and SellStop pending orders
Delete Lines - delete all lines from t
FREE
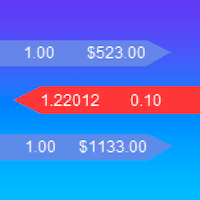
iExposure SYL displays information about opened trades considering commissions and swap, which affects the open price and the final outcome and and also allows drawing virtual transactions and calculating possible profits and losses in advance.
Differences from iExposure indicator of MT4: Separate profit column for BUY and SELL Trade open price considers commission and swap The indicator will come in handy for any hedging strategies that involve opening a large number of oppositely directed
FREE

There is a very simple and surprisingly effective indicator called Pi Cycle, which starts to give the first warning. It is worth a look, so as not to miss the giant elephant in the living room!))
What is Pi Cycle?
Pi Cycle is a very simple indicator created by analyst Philip Swift . It takes into account two (DMA biased moving averages ): 350-day average x 2 111-day average Both can be considered long-term indicators. The second one is obviously more sensitive to current market changes, since
FREE

Moving Average Rainbow Stack: Free: Single Currency & Single Timeframe MA Stack Very useful for finding current and higher timeframe trends. Best suited for long term trend based trading. Use fewer MAs for quick scalping. And not suitable during low volatility. Only use during high volatility and steady trending markets. Use this to enhance your existing Trend based strategies to find best trends.
Read detailed description https://abiroid.com/product/abiroid-ma-stack Available MTF and Scanner v
FREE
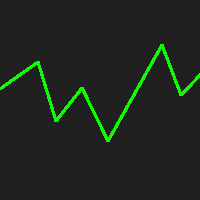
This indicator displays the historical spread values on the chart. This is an extremely useful tool for watching the spread rise and fall, allowing you to enter the market at just the right time. This indicator will help you stay out of the market when the spread begins to rise and help you get into the market as the spread begins to fall again.
ON SALE FOR FREE, GET IT FREE FOR A LIMITED TIME ONLY
FREE

This is a simple and free Expert Advisor that trades candlesticks. It compares several nearest bars and their volumes, and opens a trade based on that data. Unlike the professional version , it analyzes only 1 timeframe. The recommended timeframes for this EA are H1, H4, D1, it works with any currency pairs. The parameters always need to be optimized before trading, as well as after some period of trading.
Input Parameters Lots - lot size (if Lots=0, then the lot will be calculated based on the
FREE
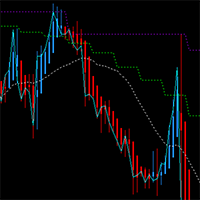
This MT4 chart trend checker cuts through the noise of market volatility to provide a clearer picture of trends and price movements. It includes the following features that can provide more clarity during market assessments: 1 customizable multi-period moving average Optional Heikin-Ashi candles 3 switchable focus modes Distinct colors for easy analysis
Link to MT5 version: https://www.mql5.com/en/market/product/106707/
This indicator shows your preferred moving average from multiple time fram
FREE

Designed to mark a specific price and time point on an MT4 chart based on a single mouse click, synchronizing this data across all timeframes for the same symbol. Its primary purpose is to help traders pinpoint and track critical levels or events (e.g., support/resistance or entry points) with persistent visual markers. The indicator uses dashed lines for price and time crosshairs, accompanied by labels that dynamically adjust to stay within chart boundaries, ensuring clarity regardless of win
FREE
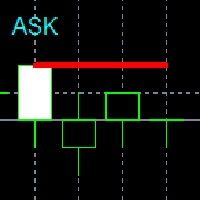
It is a very simple and useful micro indicator. Shows the current ask price, and the maximum relative ask price up to the current moment, on the chart, in the first N candles. It facilitates quick decision making by offering a visual reference. Likewise, when we position ourselves with the cursor over it, it shows us the maximum spread since the indicator is applied, until the current moment. It is perfect for scalping . By default, the parameter N has the value 4.
Especially recommended indi
FREE

<EA main logic>
1. EA reads candle pattern for most profitable of BUY & SELL.
2. If these pattern matches , then EA places the order.
3. If the order was closed with stoploss, then EA should stop trade on that day.
4. Next day EA will re-start again with increasing lot size to recover the loss.
<INPUT parameters> Slippage 3 pips MaxPosition 1 BaseLots 0,01 takeprofit 10pips stoploss 20pips Martingale True/False Max martingale 2 (times) Multiplier (lot size) 2,5
<Best pair & time frame>
FREE
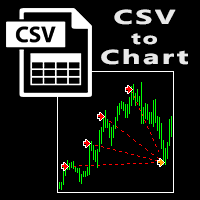
The script visually displays deals from CSV format reports on MT4 terminal charts. It automatically recognizes popular formats: MQL5.com Trading Signals for MT4 / MT5 platforms
MyFXBook service Copy the report file to the <Data Folder>\MQL4\Files folder and run the script on any chart. The script analyzes the CSV file, automatically creates new charts for all instruments that are found in the report, and draws the deals of each instrument on a separate chart. The script additionally calculates a
FREE

Reborn — A Trend Robot With Strategies Built In
Reborn is a trend-following trading robot built on the Investment Castle Indicator, with several ready-made strategies inside so you can match it to your style — from straightforward stop-loss and take-profit to kill-and-switch direction changes with recovery.
What it does for you Multiple built-in strategies: choose the approach that fits your market and risk appetite. Trend-driven entries: powered by the Investment Castle Indicator. Smart recov
FREE
The IT Moving RSI EA is a cutting-edge tool designed to empower traders with deep insights into market trends and price movements. This expert advisor is a powerful ally for both novice and experienced traders, offering the ability to make well-informed decisions by harnessing the combined power of moving averages and the Relative Strength Index (RSI). Whether you are starting your trading journey or are a seasoned trader, this EA is a must-have addition to your trading arsenal. Join our telegr
FREE

Symbol Changer (Custom) Indicator
This is a simple yet intuitive indicator. And its free.
The indicator provide easy navigation across various symbols and across different time frames all in a chart.
The buttons are displayed on the main chart.
It is flexible and easy to use with fast response speed.
FEATURES
UniqueID : This identifies the pairs for each chart
Use Custom Pairs : If set to true, load all the available symbols in the Market Watch. No means it loads the pairs selected be
FREE
YOU CAN NOW DOWNLOAD FREE VERSIONS OF OUR PAID INDICATORS . IT'S OUR WAY OF GIVING BACK TO THE COMMUNITY ! >>> GO HERE TO DOWNLOAD
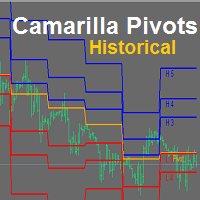
Camarilla Pivots Historical plots the historical data of the camarilla pivot point levels on the chart. The Camarilla Pivot levels was originated in 1989 by Nick Scott. The levels are used as primary support and resistance levels by Intraday traders. The levels are calculated with the following formula: R4 = C + RANGE * 1.1/2 R3 = C + RANGE * 1.1/4 R2 = C + RANG
FREE

Trade Entry Journal is your ultimate solution for streamlining trade entries and journaling. Designed specifically for forex traders, this powerful tool automates the tedious tasks of calculating lot sizes, placing trades, and documenting your trading activities. Say goodbye to manual entries and focus on making smarter trading decisions. Key Advantages: Automated Lot Size Calculation : Calculate the perfect lot size based on your stop loss level and risk amount. The lot size will be adjusted t
FREE

This EA trades the forex markets by a specific combination of ATR and parabolic SAR indicator signals and transaction management. the EA has stop loss and take profit. minimum trading account 500.
default settings for GBPUSD 1h. settings for optimization: ATRperiod lot sarStep sarMaximum tpFactor slFactor this EA(){ operates once per bar; fast methods of optimization are valid(){ user can optimize by model (control point); || (open prices only); }}
developed, tested and optimi
FREE
Description PirDpo is a mean reversion trading robot that works only LONG. It can be used on several indexes like sp500, dow jones 30, eurostoxx 50, dax 30, etc., on a daily timeframe. It basically applies this algorithm: Calculate detrended price with this formula detrend = (close - simple_moving_average(length))/simple_moving_average(length) if detrend <= min(detrend,length) the BUY SELL after timeExit days Key Features Absence of dangerous algorithms. It works just when the bar is closed. Ea
FREE
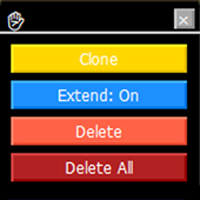
Trendline Toolbox (MT4) Trendline Toolbox is a utility indicator for MetaTrader 4 that helps manage trendlines and common chart objects. It does not provide trading signals and does not guarantee any profit. Main functions Clone the selected trendline (style, angle, and price levels are preserved). Toggle the “Extend” property for the selected trendline. Delete the selected trendline. Delete all objects on the current chart. Double-click the hand icon to enable move mode, then drag the panel to
FREE
MetaTrader 마켓은 거래로봇과 기술지표를 판매하기에 최적의 장소입니다.
오직 어플리케이션만 개발하면 됩니다. 수백만 명의 MetaTrader 사용자에게 제품을 제공하기 위해 마켓에 제품을 게시하는 방법에 대해 설명해 드리겠습니다.
