私たちのファンページに参加してください

Renko Time and Time Between Candles Indicator - MetaTrader 4のためのインディケータ
- ビュー:
- 52163
- 評価:
- パブリッシュ済み:
- アップデート済み:
-
 取引の機会を逃しています。
- 無料取引アプリ
- 8千を超えるシグナルをコピー
- 金融ニュースで金融マーケットを探索
-
 このコードに基づいたロボットまたはインジケーターが必要なら、フリーランスでご注文ください
フリーランスに移動
このコードに基づいたロボットまたはインジケーターが必要なら、フリーランスでご注文ください
フリーランスに移動
*Version 2, corrected array alignment and calculation of the current bar time.
*Version 2ma — added moving average as requested.
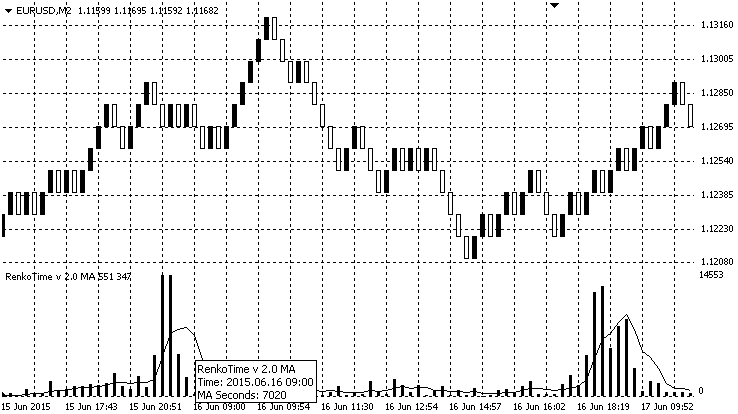
A very simple indicator to display the difference in time between candles in seconds.
Intended for use with offline renko charts to indicate how long each block or brick has taken to form.
On a regular timeframe chart, it can indicate dropped candles because the subsequent candle starts late.
My first indicator! Please comment!

Long indicator bars at the period separator as market closed.
You might expect indicator bars to be double height where the renko colour changes as the price has had to move twice as far to make the block.
My guess is that when the market moves then the bars are small, indecisive market produces longer bars as price takes longer to move.

On a regular timeframe chart, it can indicate dropped candles because the subsequent candle starts late.
Here, news was out at 15:30 but the candle was skipped so the 15:31 candle took 120 seconds to start, counted from the start of the previous (15:29) candle.
Comments:
Seems odd to put the time element back into renko charts but I figured it might produce useful information such as slow bricks indicating a turn in the market or price moving slowly inside a range. Or fast bricks indicating a real move in the price.
On a regular, standard timeframe chart, it can show where the chart / broker has skipped one or more candles. This is surprisingly often! Particularly at news times.
Added MA as requested.
HarmonikManual
This indicator will show the name of the pattern by placing point XABCD manually and also will search the next Potential Reversal Zone (PRZ) automatically.
Balance Sheet
This indicator will show balance sheet for a year.
MonEx indicator
MonEx indicator is the Weighted Close (HLCC/4) candlestick bar combined with ZigZag indicator.
MACD_2ToneColor
Custom MACD indicator with 2 tone color (MACD Up and MACD Down colors).