Volume Spread Analysis MT5 Indicator by PipTick
- Indicatori
-
Michal Jurnik
 "Talent is cheaper than table salt. What separates the talented individual from the successful one is a lot of hard work." - Stephen King. Those few words reflect myself very well. I am probably not the most talented developer in the world but I truly believe in hard work, professional attitude and
 - Versione: 1.9
- Aggiornato: 30 settembre 2022
- Attivazioni: 5
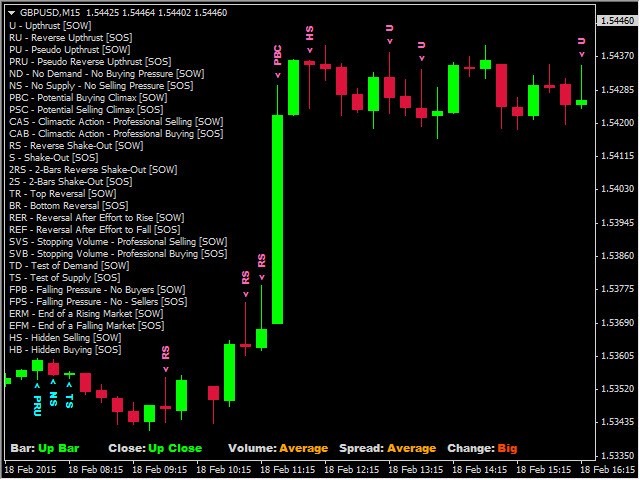
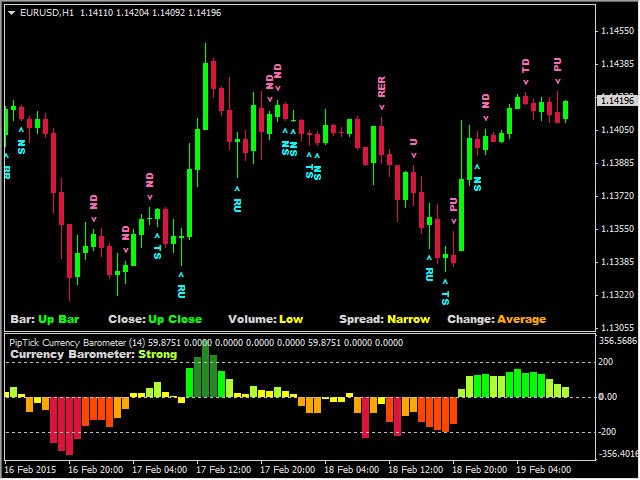
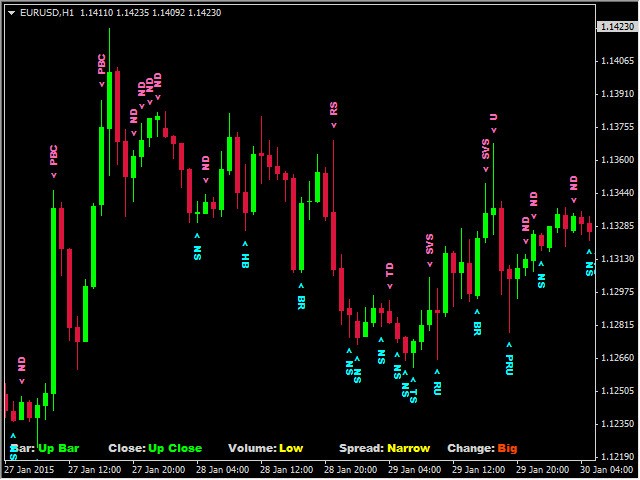
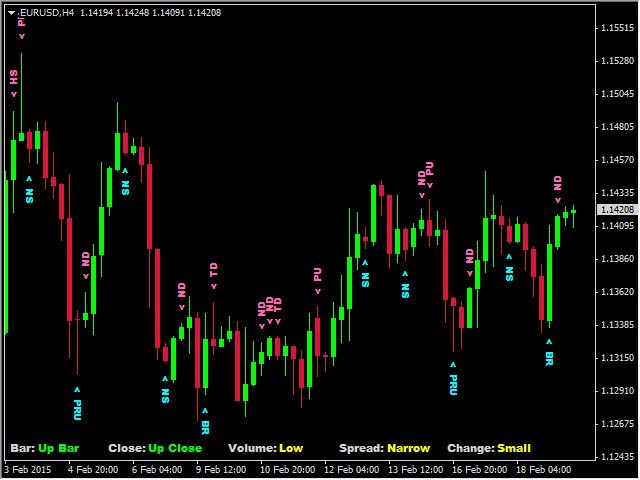
The Volume Spread Analysis indicator is based on the original Volume Spread Analysis method. It was designed for quick and easy recognition of VSA patterns. Even though this indicator looks very simple, it is the most sophisticated tool we've ever made. It is a really powerful analytical tool that generates very reliable trading signals. Because it is very user-friendly and understandable, it is suitable for every type of trader, regardless of his experience.
What is VSA?
VSA - Volume Spread Analysis is a form of technical analysis which attempts to look into price action in relation to volume. This is a proven method for analyzing financial markets. This approach works in all markets because the VSA evaluates the imbalance between supply and demand, which is constantly emerging.
More information can be found at this site: http://www.volumespreadanalysis.com/
Patterns
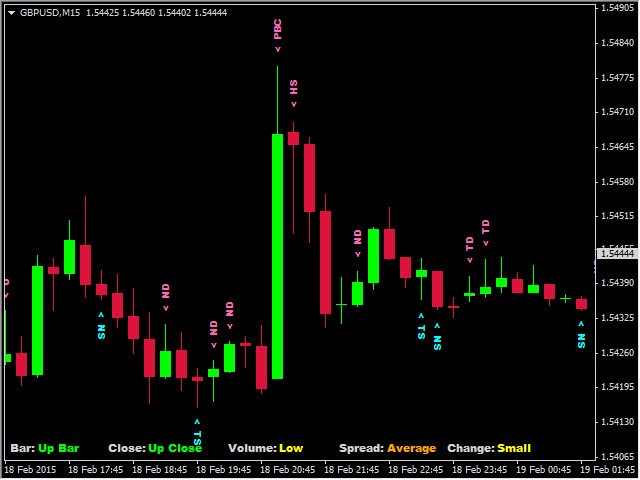
The Volume Spread Analysis indicator shows 28 patterns that are divided into two groups. Signs of Weakness [SOW] and Signs of Strength [SOS].
- U - Upthrust [SOW].
- RU - Reverse Upthrust [SOS].
- PU - Pseudo Upthrust [SOW].
- PRU - Pseudo Reverse Upthrust [SOS].
- ND - No Demand [SOW].
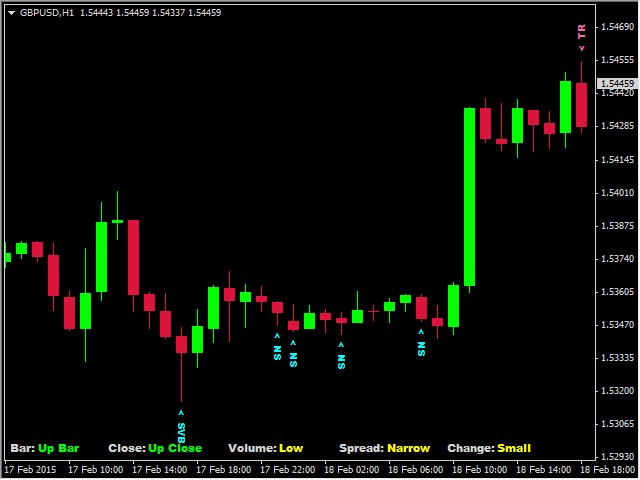
- NS - No Supply [SOS].
- PBC - Potential Buying Climax [SOW].
- PSC - Potential Selling Climax [SOS].
- CAS - Climactic Action - Professional Selling [SOW].
- CAB - Climactic Action - Professional Buying [SOS].
- RS - Reverse Shake-Out [SOW].
- S - Shake-Out [SOS].
- 2RS - 2-Bars Reverse Shake-Out [SOW].
- 2S - 2-Bars Shake-Out [SOS].
- TR - Top Reversal [SOW].
- BR - Bottom Reversal [SOS].
- RER - Reversal After Effort to Rise [SOW].
- REF - Reversal After Effort to Fall [SOS].
- SVS - Stopping Volume - Professional Selling [SOW].
- SVB - Stopping Volume - Professional Buying [SOS].
- TD - Test of Demand [SOW].
- TS - Test of Supply [SOS].
- FPB - Falling Pressure - No Buyers [SOW].
- FPS - Falling Pressure - No Sellers [SOS].
- ERM - End of a Rising Market [SOW].
- EFM - End of a Falling Market [SOS].
- HS - Hidden Selling [SOW].
- HB - Hidden Buying [SOS].
Main features
- The indicator shows 28 VSA patterns.
- Accurate signals.
- Based on the original VSA.
- Works on every timeframe (M1, M5, M15, M30, H1, H4, D1, W1, MN).
- The indicator is non-repainting.
- Ready for backtesting.
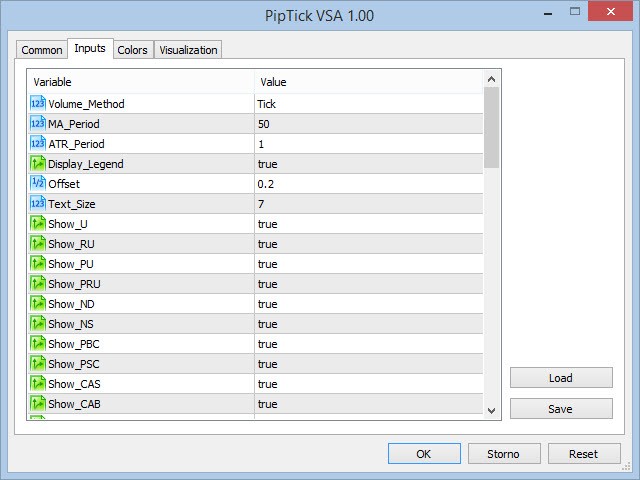
- Customizable parameters (Colors, Pattern Visibility, Text Size...).
- High-speed calculation.
- Can be used for creating EA (Expert Advisor).
- Available for MT4 and MT5.


Hi Michal just brought your indicator works great just one problem when the indicator is added to a chart om MT5 the text down at the bottom left all overlaps . So where it says Bar - Up Bar the Up Bar text overlaps and Bar text and the same with the Close if it says down close the down close overlaps the Close text to its left & the same with the Volume - Low the Low text overlaps the Volume Text. This happens with all the text at the bottom left of the chart could you sort this problem out please. The indicator works great because i know how to apply VSA . Would be great if you could sort this problem out Thanks for a great indicator. If you need a Screen Shot just Let me Know.