Wave Anatomy
- Indicatori
- Versione: 1.50
- Aggiornato: 18 gennaio 2024
- Attivazioni: 10

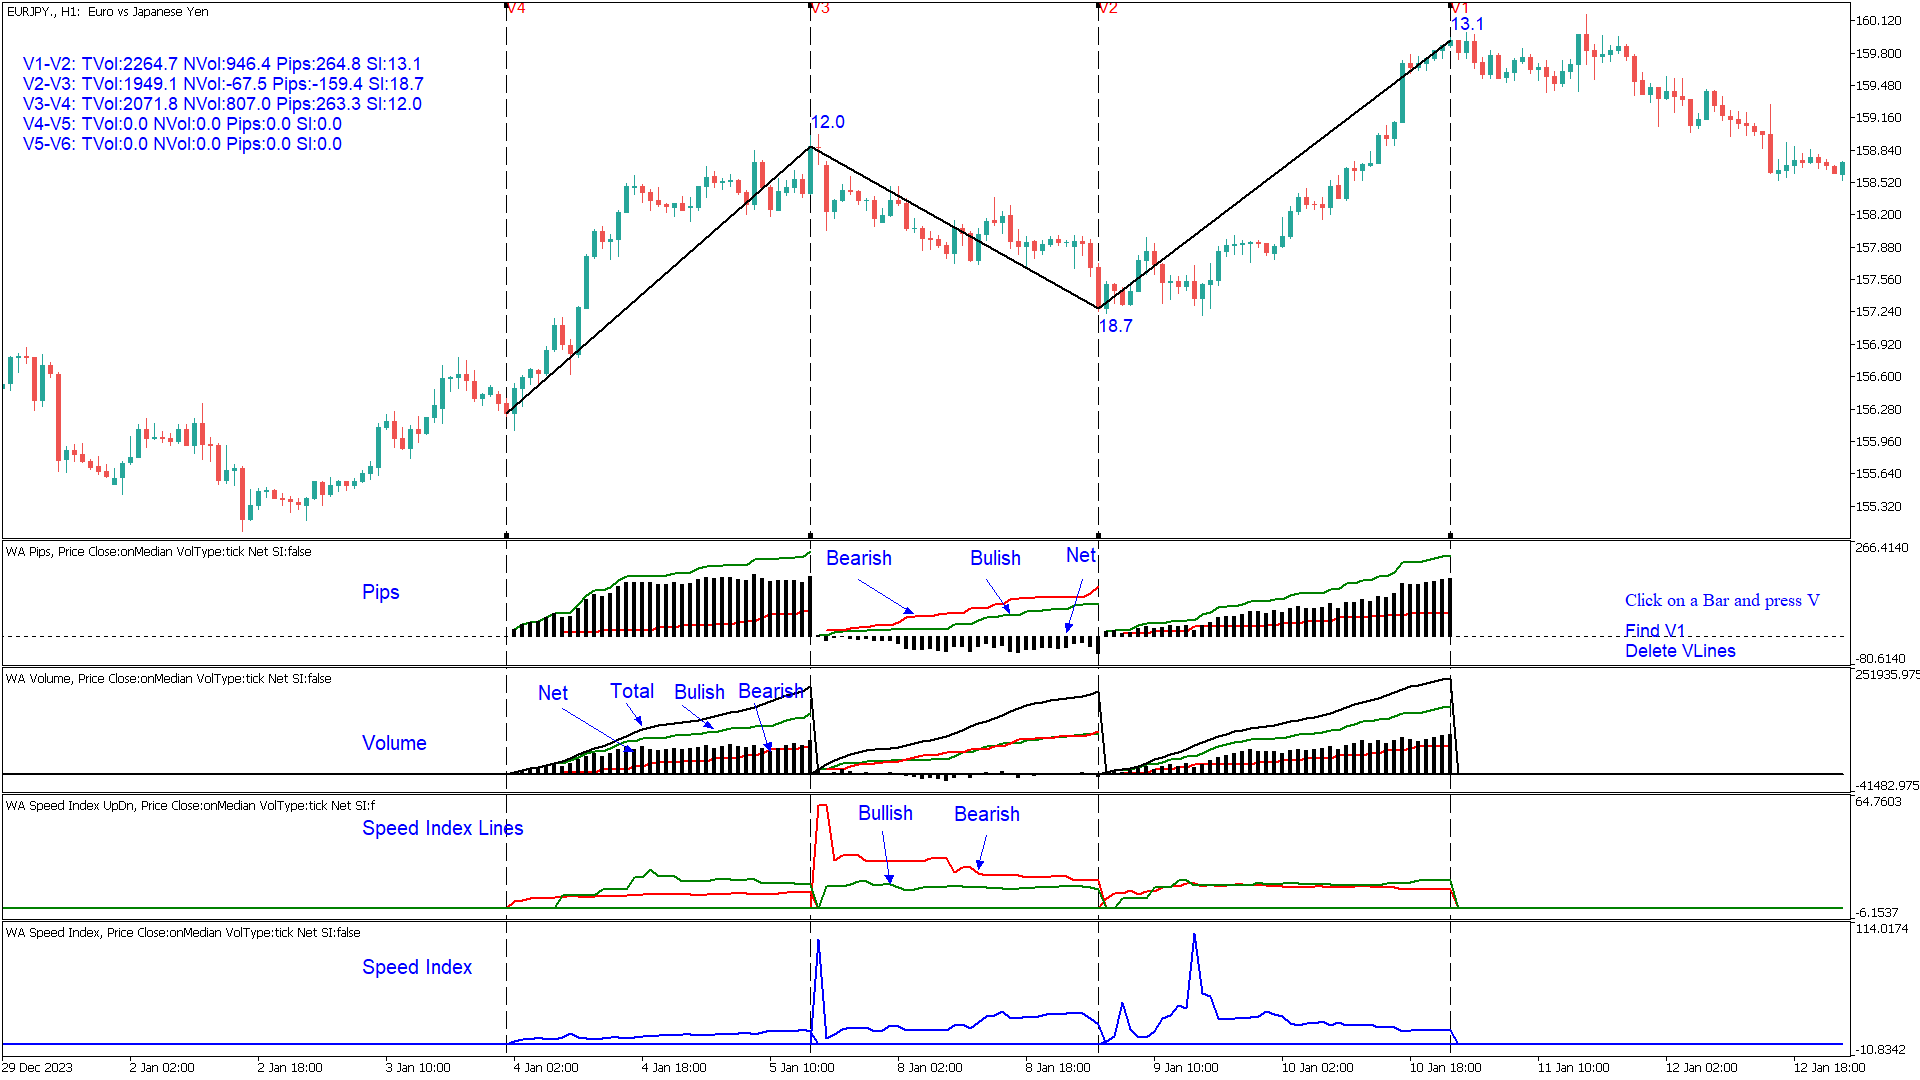
Construct your own 5 Waves and analyze the price movements stages:
- Easy Movement
- Hard time to move
- Fast move
This indicator is based on Wyckoff’s, David’s Weis and my Speed Index Theory. This indicator will you help analyze what is happening in 5 Price Waves that you can construct yourself. This tool is designed for scalpers and swing traders and will help them to analyze any wave on any timeframe at the same time. Furthermore, this tool is very useful to Elliot wave traders trying to identify wave numbering and turning points.
It can be used on any kind of chart and instrument that has price and volume like regular timeframe charts, tick charts (constant volume charts), renko and range bars.
The information provided by this indicator will give you an edge to understand when price has difficulty moving as well as ease of movement. Comparing the cumulative pip lines with the cumulative volume lines in combination with Speed Index will provide you a better understanding why Price moved in one or the other direction.
Wave Structure Analysis that this tool can be used are mentioned below:
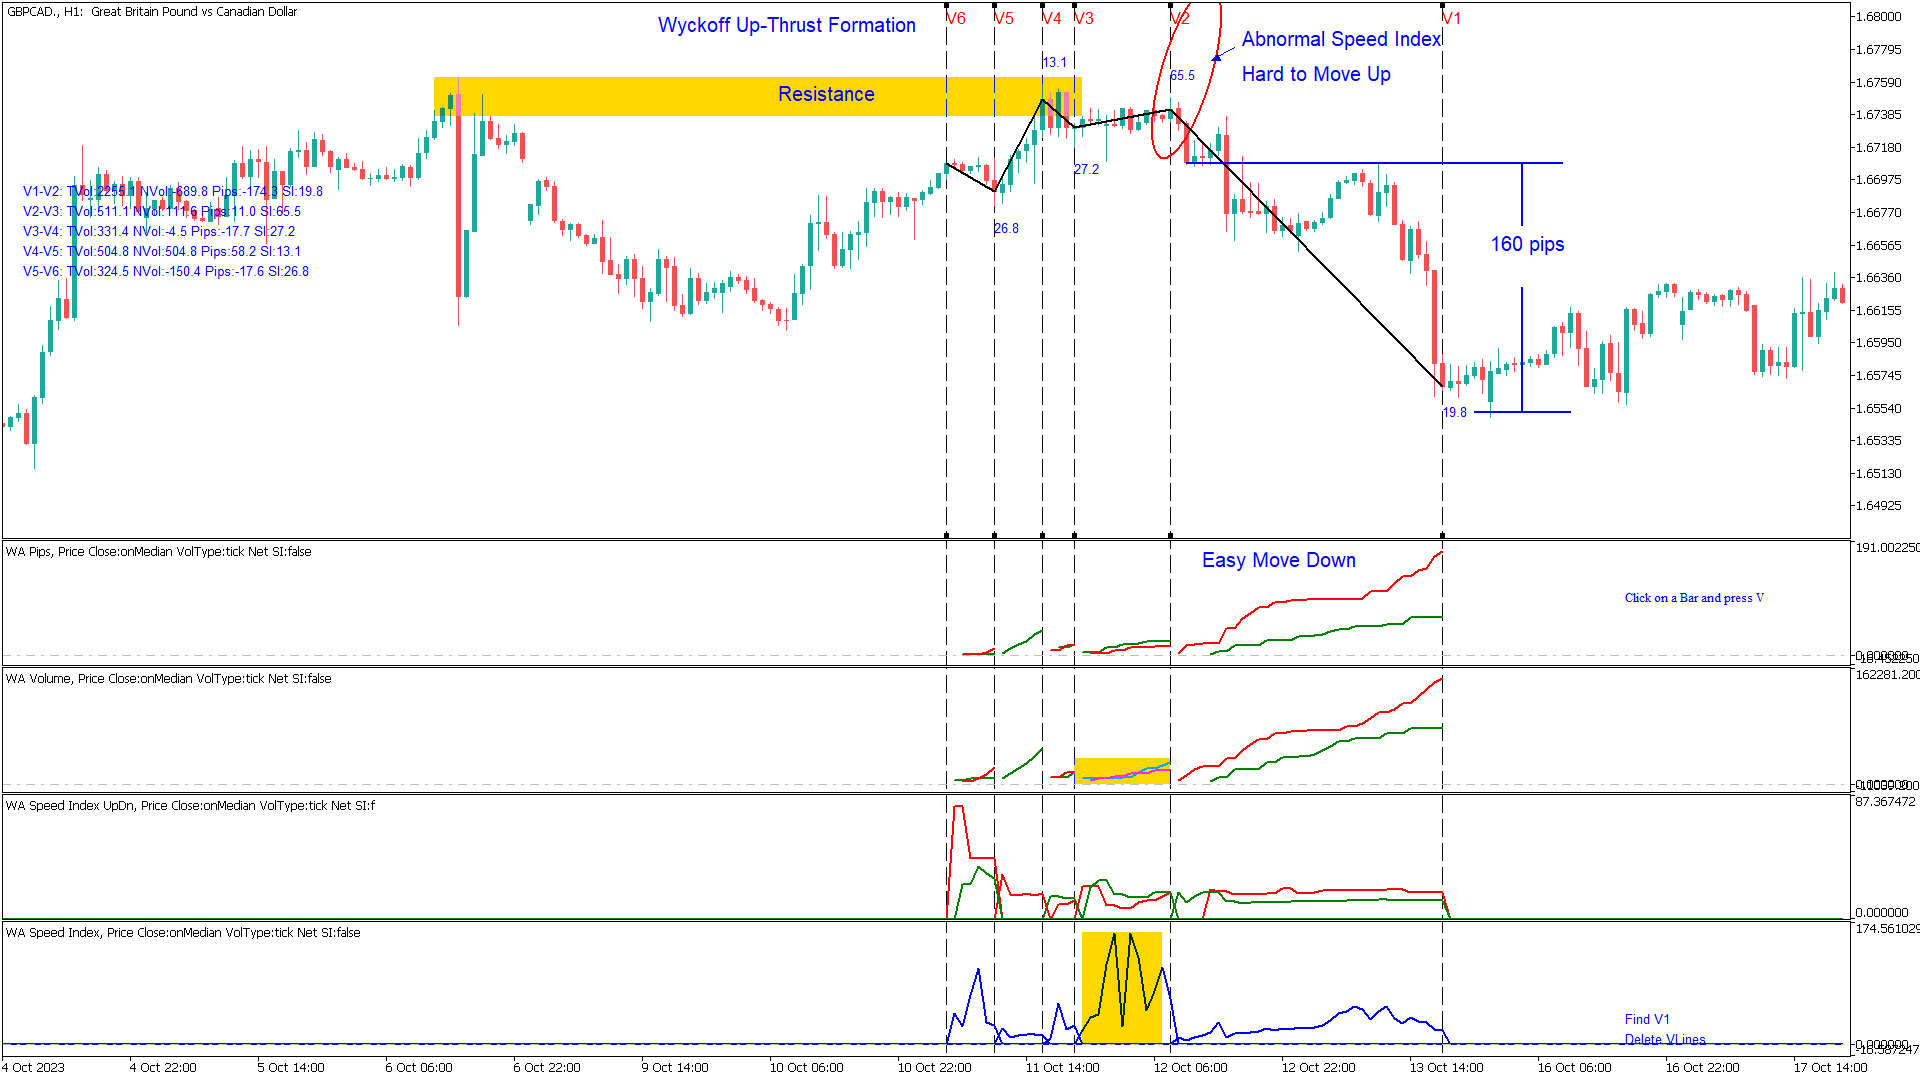
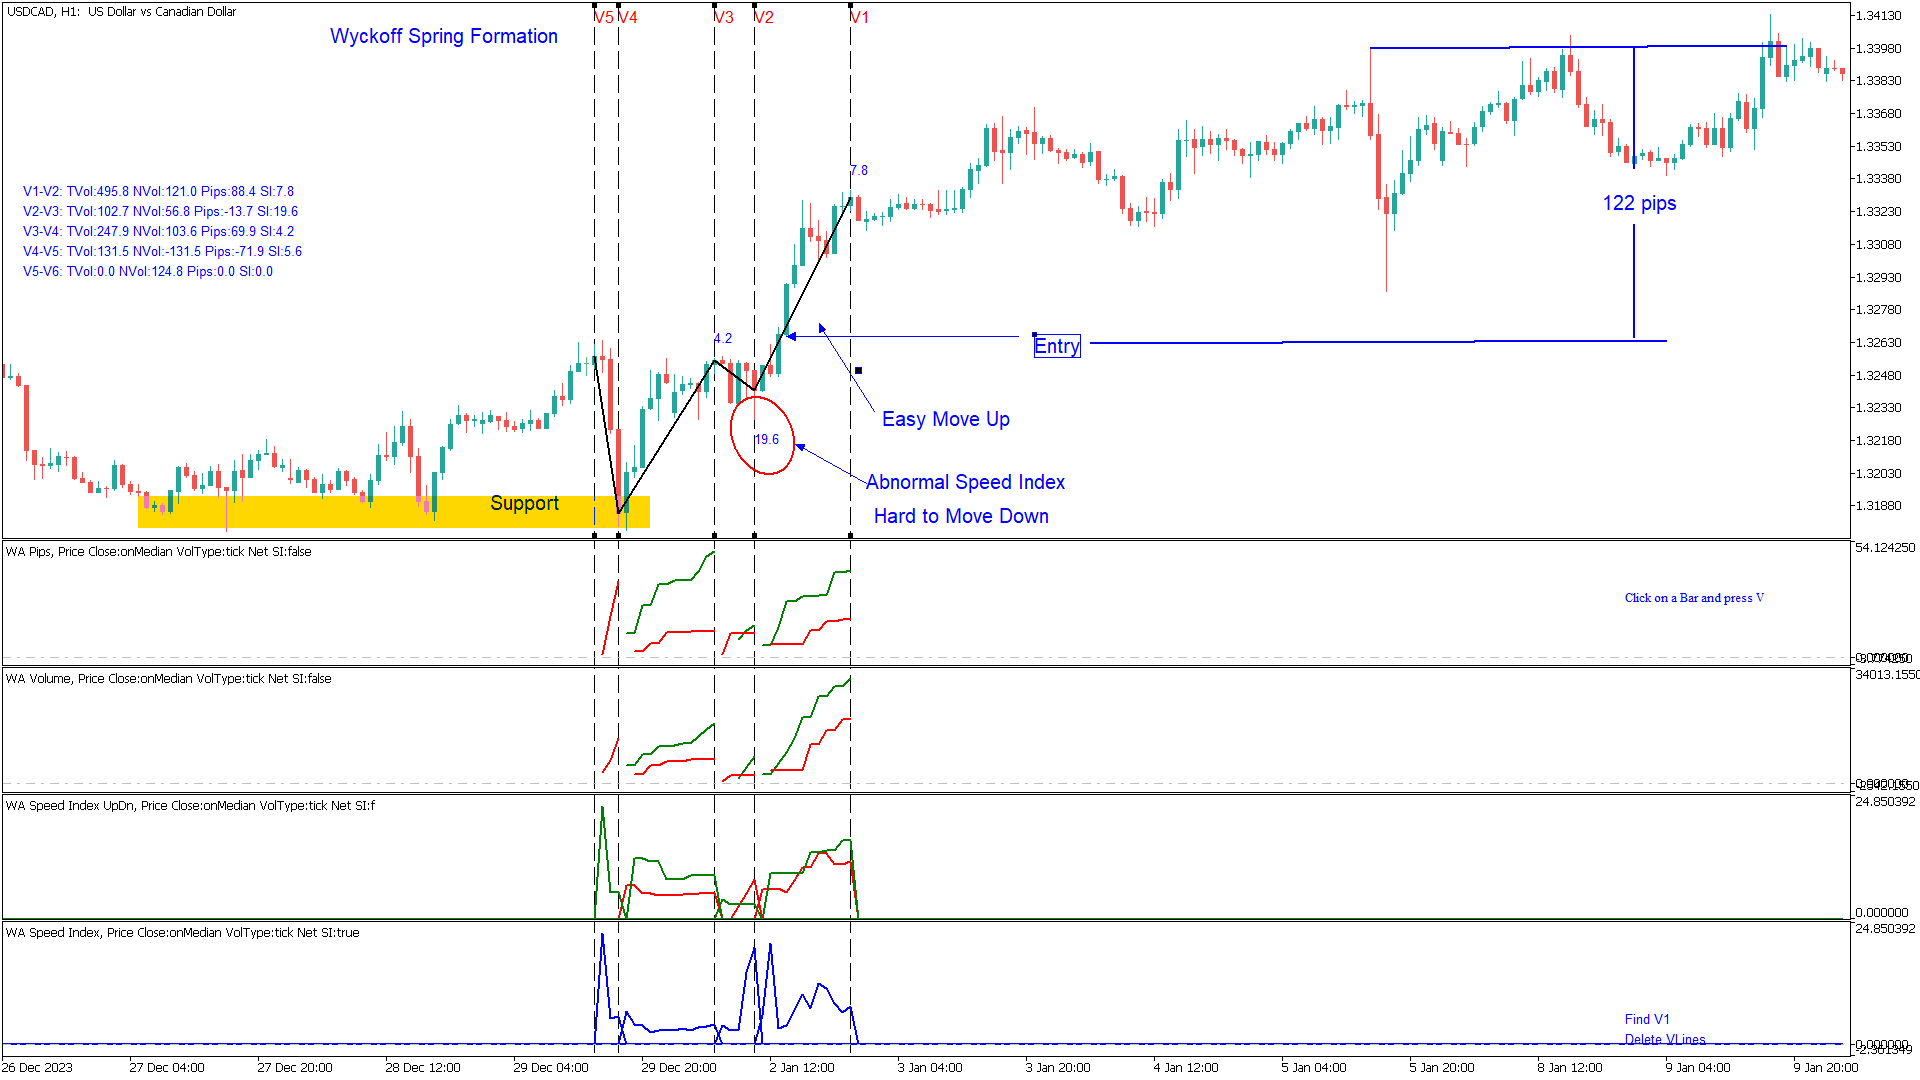
- Analyze Wyckoff Up Thrust and Spring Formations
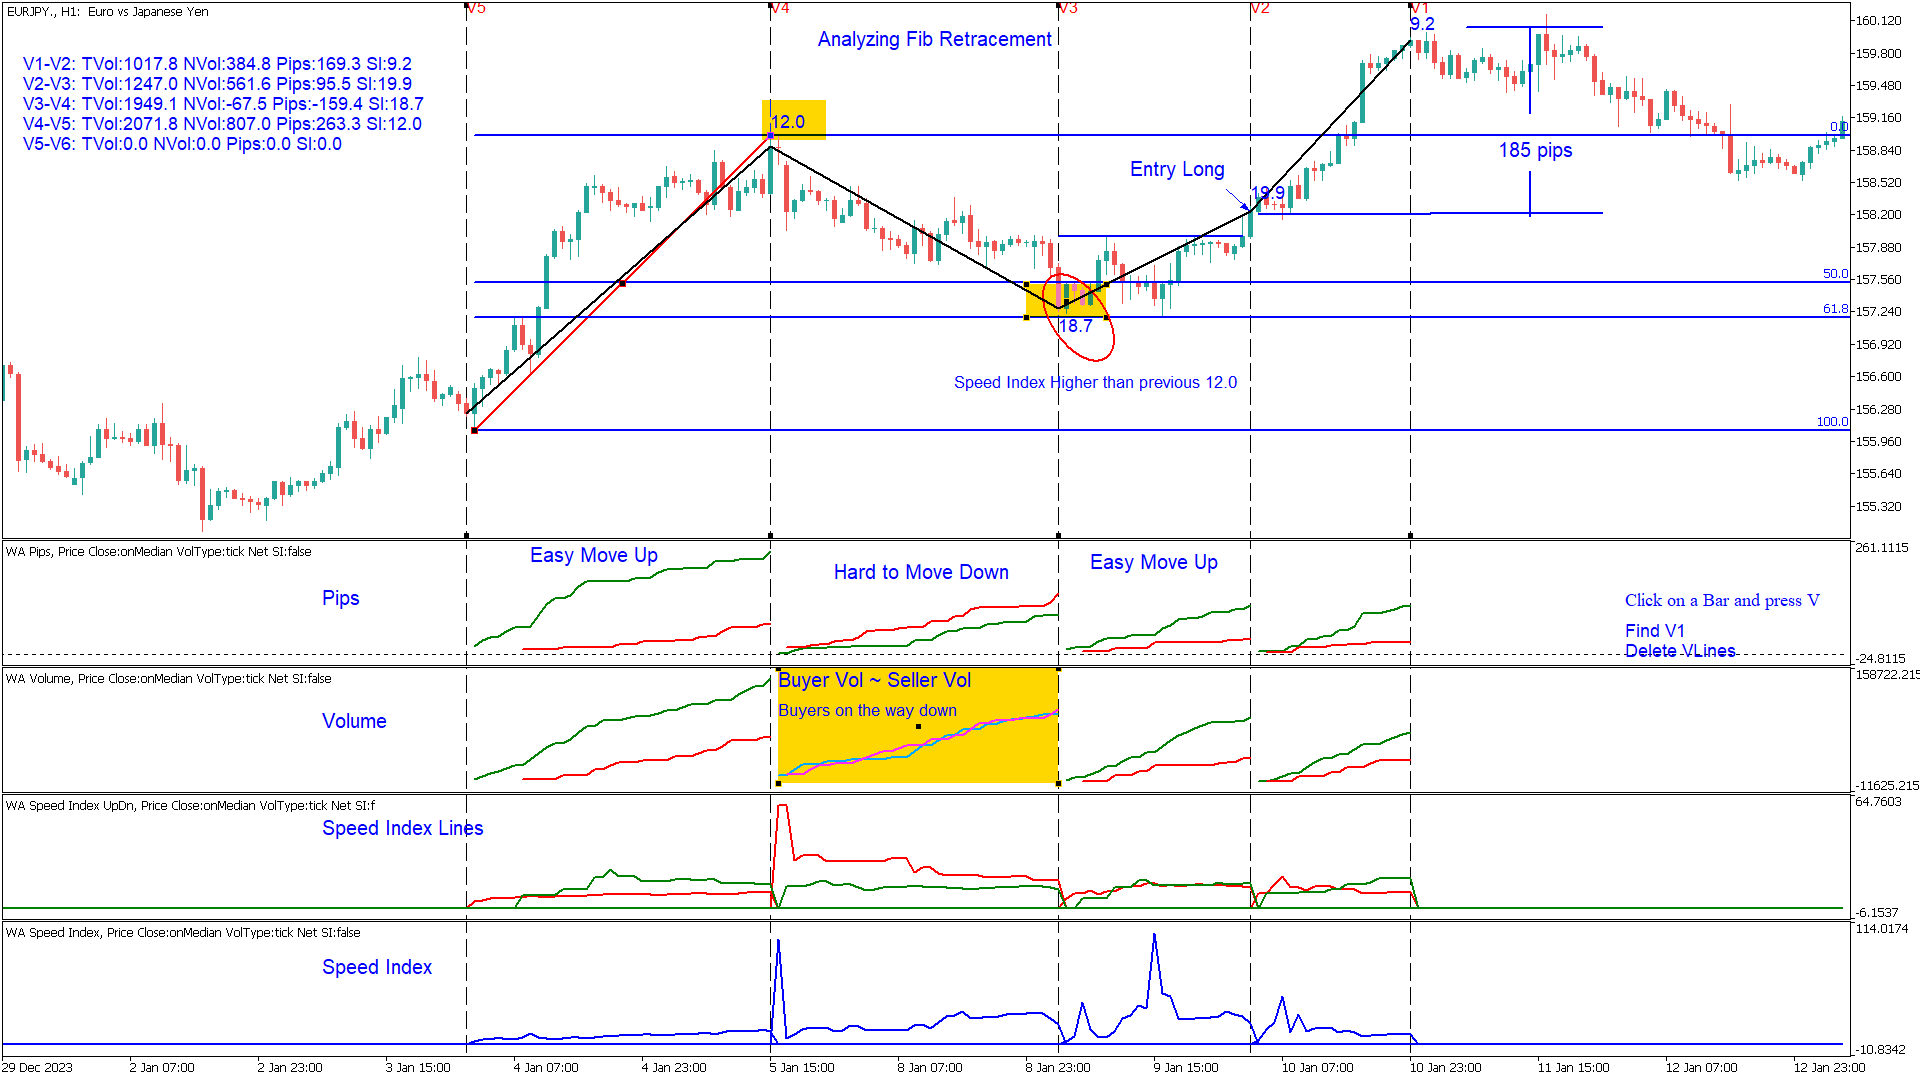
- Analyze Fibonacci Retracements
- Analyze Exit From Range
- Analyze Support and Resistance Level
- Analyze VWAP and/or AVWAP Levels
- Analyze A Single Wave Cut in 5 Pieces
- Analyze Elliot Waves
Contact me at info@tradethevolumewaves.com after your purchase to provide you with the manual.


I have purchased nearly all of Takis' indicators, but I think Wave Anatomy is probably the very best...it is a fabulous predictive tool if used properly...most importantly Takis is always willing to help by doing 1:1 sessions