Gunn Chart

Grafico di Gann: Sblocca la Geometria del Mercato per Previsioni Precise!

Stai cercando di andare oltre gli strumenti di analisi lineare e vedere il mercato da una nuova prospettiva geometrica? Desideri sfruttare la potenza del Quadrato di Gann per identificare i livelli chiave di supporto e resistenza, nonché i potenziali punti di inversione?

Ti presentiamo il Grafico di Gann – un indicatore innovativo che visualizza il movimento dei prezzi nel contesto del leggendario Quadrato di Gann. Questo strumento sblocca un modo unico per analizzare la struttura del mercato, basato sulle relazioni matematiche e geometriche sviluppate da uno dei più grandi trader di tutti i tempi – William Delbert Gann.

Cos'è il Quadrato di Gann e perché è così potente?

Il Quadrato di Gann è un potente strumento di analisi geometrica che utilizza una griglia quadrata per visualizzare i livelli di prezzo e le relazioni temporali. Gann credeva che il mercato si muovesse secondo leggi matematiche e modelli geometrici prevedibili. Il Quadrato di Gann aiuta i trader a visualizzare questi modelli, identificare i livelli chiave di supporto e resistenza, prevedere i potenziali inversioni di tendenza e stabilire livelli target per le loro operazioni.

L'idea centrale è che i livelli di prezzo significativi si trovano spesso all'intersezione di linee tracciate ad angoli specifici da massimi o minimi chiave, formando così una struttura quadrata. Osservando come il prezzo interagisce con questi livelli, i trader possono ottenere preziose informazioni sulla forza di un trend e sulle probabili direzioni del movimento futuro.

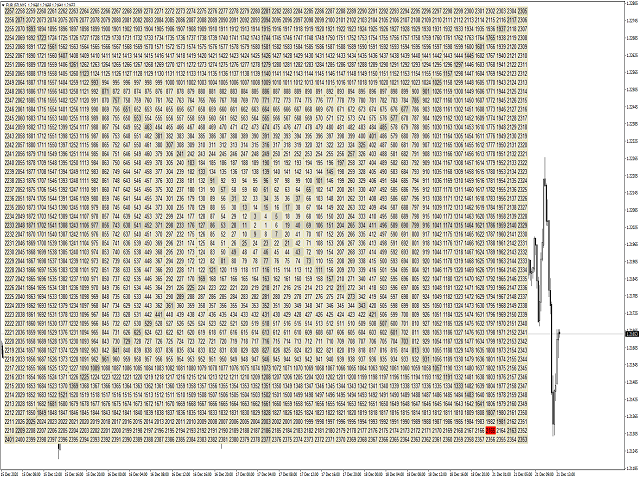
Come funziona l'indicatore Grafico di Gann?

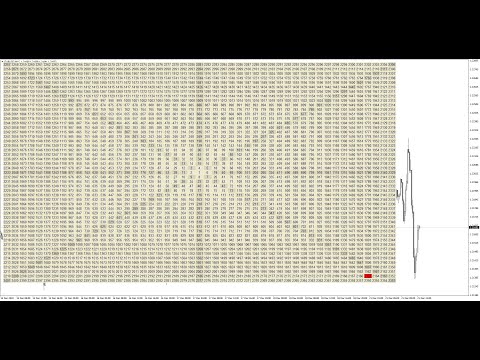
L'indicatore Grafico di Gann traccia automaticamente la griglia del Quadrato di Gann sul tuo grafico, in relazione al prezzo attuale. Una caratteristica chiave dell'indicatore è la sua flessibilità nel determinare il valore del prezzo centrale attorno al quale viene costruito il quadrato. Attraverso impostazioni specifiche, puoi scegliere quale parte del valore del prezzo attuale verrà utilizzata per il calcolo.

Esaminiamo in dettaglio le impostazioni che determinano il valore del prezzo centrale:

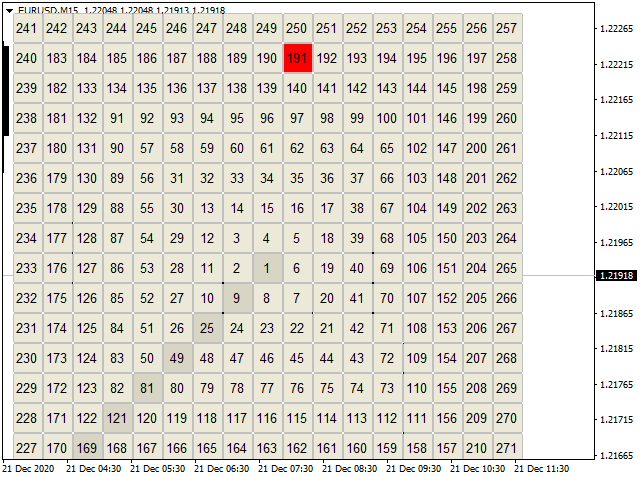
  • Digit (Cifra): Questo parametro definisce quante cifre del prezzo verranno utilizzate per il calcolo, a partire da una posizione specifica.

    • Ad esempio, se il prezzo attuale è 1.23456 e Digit è impostato su _5____ , verrà utilizzato il numero 23456 per il calcolo.
    • Se Digit è impostato su _6____ , verrà utilizzato 123456 .
    • Per Digit = __4____ , verrà utilizzato 3456 .
    • Per Digit = ___3___ , verrà utilizzato 456 .
  • minus_znak (Segno_meno): Questo parametro ti permette di rimuovere un certo numero di cifre a destra della parte selezionata del prezzo.

    • Ad esempio, se Digit è impostato su _5____ (risultando in 23456 ) e minus_znak è impostato su _0 , il valore centrale sarà 23456 .
    • Se minus_znak è impostato su _1 , il valore centrale sarà 2345 .
    • Se minus_znak è impostato su _2 , il valore centrale sarà 234 .

Utilizzando una combinazione delle impostazioni Digit (Cifra) e minus_znak (Segno_meno), puoi sintonizzare con precisione il valore del prezzo centrale da cui verrà costruito il Quadrato di Gann, concentrandoti sulle cifre più significative del prezzo attuale secondo la tua analisi.

Controllo Interattivo del Quadrato di Gann:

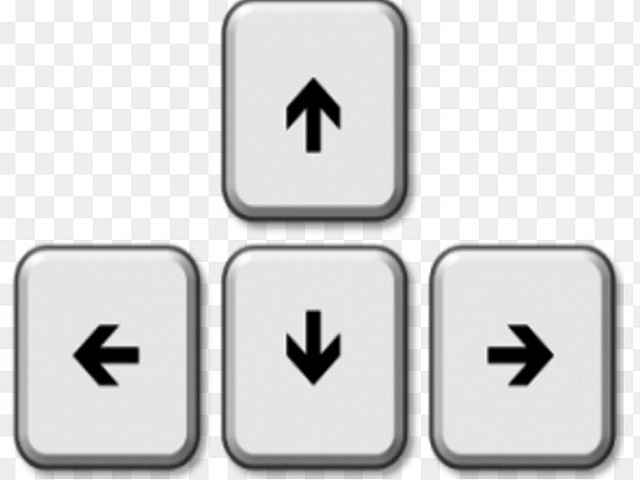
Per garantire la massima flessibilità nell'analisi, l'indicatore Grafico di Gann ti permette di spostare dinamicamente il Quadrato di Gann sul grafico utilizzando la tastiera:

  • Freccia su: Sposta l'intero Quadrato di Gann verso l'alto.
  • Freccia giù: Sposta l'intero Quadrato di Gann verso il basso.
  • Freccia destra: Sposta l'intero Quadrato di Gann verso destra.
  • Freccia sinistra: Sposta l'intero Quadrato di Gann verso sinistra.

Questa funzione ti permette di adattare rapidamente la posizione del quadrato a massimi e minimi storici chiave, o ai livelli di prezzo attuali, per identificare potenziali zone di supporto e resistenza.

Descrizione delle Impostazioni dell'Indicatore:

  • _width (larghezza): La larghezza di ogni cella del quadrato in pixel. Definisce la dimensione visiva della griglia orizzontalmente.
  • _height (altezza): L'altezza di ogni cella del quadrato in pixel. Definisce la dimensione visiva della griglia verticalmente.
  • _font_size (dimensione_carattere): La dimensione del testo visualizzato nelle celle del quadrato (generalmente i livelli di prezzo).
  • clr_txt (colore_testo): Il colore del testo nelle celle del quadrato.
  • clr_back (colore_sfondo): Il colore di sfondo delle celle del quadrato.
  • clr_border (colore_bordo): Il colore del bordo (cornice) delle celle del quadrato.
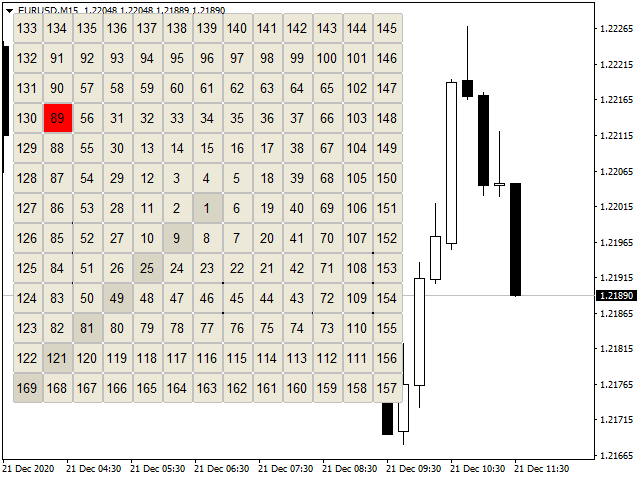
  • clr_new_back (nuovo_colore_sfondo): Il colore di sfondo della cella corrispondente al prezzo attuale. Ti permette di evidenziare visivamente il valore del prezzo attuale sulla griglia.
  • Digit (Cifra): Utilizzare il totale delle cifre nel valore che forma il prezzo.
  • minus_znak (Segno_meno): Quante cifre rimuovere a destra del valore che forma il prezzo.

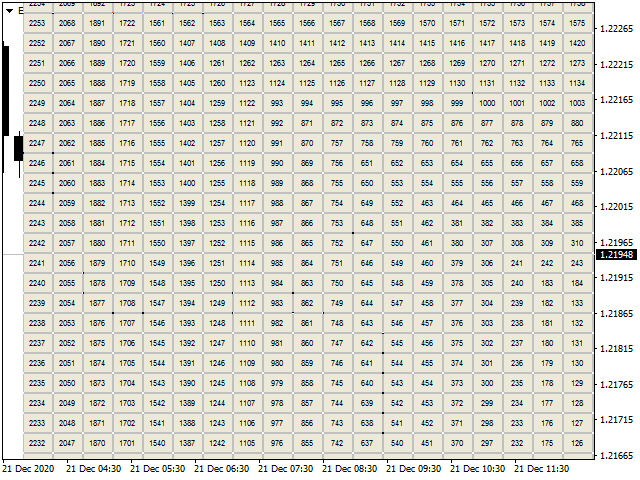
Raccomandazione sulle Prestazioni:

Si prega di notare che l'utilizzo di un gran numero di cifre nel prezzo (valori di Digit _5____ o _6____ ) può portare a un carico computazionale significativo sul computer, specialmente quando l'indicatore è attivo. Se si utilizza un computer meno potente, si consiglia di utilizzare valori più piccoli per il parametro Digit ( ___3___ o __4____ ) per garantire prestazioni ottimali del terminale.

Vantaggi dell'utilizzo dell'indicatore Grafico di Gann:

  • Approccio geometrico unico all'analisi di mercato.
  • Visualizzazione dei livelli chiave di supporto e resistenza basata sui principi di Gann.
  • Potenziale identificazione dei punti di inversione di tendenza.
  • Aiuta a stabilire i livelli target per le posizioni di trading.
  • Controllo interattivo per un'analisi flessibile di diverse fasce di prezzo.
  • Parametri personalizzabili per adattarsi a strategie di trading individuali.

Sblocca i modelli nascosti del mercato con l'indicatore Grafico di Gann! Ottieni un potente strumento per prevedere i movimenti dei prezzi e prendere decisioni di trading più informate!

Scarica subito l'indicatore Grafico di Gann e inizia a vedere il mercato con gli occhi di un trader leggendario!


Prodotti consigliati
Quantum Balance
Adolfina Denysenko
Quantum Balance is a modern arrow indicator that identifies key price reversal points in the market with high accuracy. It is based on a combination of WPR (Williams %R) and RSI (Relative Strength Index), which allows you to identify overbought/oversold moments and enter trades at points of maximum potential. The indicator analyzes price dynamics and market conditions, generating signals only when several confirming factors coincide. This reduces the number of false signals and increases tradin
"Dynamic Scalping Oscillator" - è un indicatore Crypto_Forex personalizzato avanzato - uno strumento di trading efficiente per MT4! - Nuova generazione di oscillatori - guarda le immagini per vedere come usarlo. - L'oscillatore Dynamic Scalping ha zone di ipervenduto/ipercomprato adattive. - L'oscillatore è uno strumento ausiliario per trovare punti di ingresso esatti dalle aree dinamiche di ipervenduto/ipercomprato. - Valori di ipervenduto: sotto la linea verde, valori di ipercomprato: sopra l
Chart Patterns Detect 15 patterns (Ascending Triangle, Descending Triangle, Rising Wedge, Falling Wedge, Bullish Flag, Bearish Flag, Bullish Rectangle, Bearish Rectangle Symmetrical triangle, Head and Shoulders, Inverted Head and Shoulders, Triple top, Triple Bottom, Double Top, Double Bottom) Use historical data to calculate the probability of each pattern to succeed (possibility to filter notification according to the chance of success) gives graphic indication about the invalidation level and
Forex Gump
Andrey Kozak
2.4 (5)
Forex Gump is a fully finished semi-automatic trading system. In the form of arrows, signals are displayed on the screen for opening and closing deals. All you need is to follow the instructions of the indicator. When the indicator shows a blue arrow, you need to open a buy order. When the indicator shows a red arrow, you need to open a sell order. Close orders when the indicator draws a yellow cross. In order to get the most effective result, we recommend using the timeframes H1, H4, D1. There
RTrends
Nikolay Likhovid
The RTrends indicator does two things: first, it automatically draws the layout of the price chart by plotting trend lines and, secondly, it produces bearish and bullish signals. The layout reflects the fractal nature of the market. Trends from different time horizons are applied simultaneously on the chart. Thus, from a single chart a trader can see trend lines of higher timeframes. The lines, depending on the horizon, differ in color and width: the older the horizon, the thicker the line is. T
The new update makes this indicator a complete tool for studying, analyzing and operating probabilistic patterns. It includes: On-chart Multi-asset percentage monitor. Configurable martingales. Twenty-one pre-configured patterns , including Mhi patterns and C3. An advanced pattern editor to store up to 5 custom patterns. Backtest mode to test results with loss reports. Trend filter. Hit operational filter. Martingale Cycles option. Various types of strategies and alerts. Confluence between patte
Super Reversal Pattern
Parfait Mujinga Ndalika
Super Reversal Pattern Indicator Unlock the power of advanced pattern recognition with our Super Reversal Pattern Indicator. Designed for traders seeking precision and reliability, this indicator identifies one of the most effective reversal patterns in technical analysis, offering a significant edge in your trading strategy. Key Features: Non-Repainting Accuracy: Enjoy the confidence of non-repainting technology. Once a Super Reversal Pattern is detected, it remains static, providing consiste
Indicatore di gestione del rischio e monitoraggio dei limiti per trader professionisti e account di valutazione (Prop) Questo strumento visualizza esclusivamente sul grafico informazioni precise su gestione del rischio e limiti, per aiutarti a decidere con maggiore concentrazione. L’indicatore non apre/chiude/modifica operazioni e non interferisce con gli Expert Advisor. Caratteristiche Monitoraggio del drawdown giornaliero e totale Calcola e mostra il drawdown giornaliero e totale in base a Ba
The indicator detects and displays Shark harmonic pattern (see the screenshot). The pattern is plotted by the extreme values of the ZigZag indicator (included in the resources, no need to install). After detecting the pattern, the indicator notifies of that by a pop-up window, a mobile notification and an email. The indicator highlights the process of the pattern formation and not just the complete pattern. In the former case, it is displayed in the contour triangles. After the pattern is comple
Auto Trendline Fibo Dow Theory - Automated Price Action & Structure Analysis Overview: Stop drawing manual trendlines and Fibonacci retracements! Auto Trendline Fibo Dow Theory  is a powerful price action utility designed to automate your technical analysis based on the classic Dow Theory and Fibonacci ratios. This indicator scans market structure using a customizable ZigZag algorithm to identify higher highs, higher lows (Uptrend), or lower highs, lower lows (Downtrend). It automatically plots
Daily Candle Predictor è un indicatore che prevede il prezzo di chiusura di una candela. L'indicatore è destinato principalmente all'uso sui grafici D1. Questo indicatore è adatto sia per il trading forex tradizionale che per il trading di opzioni binarie. L'indicatore può essere utilizzato come sistema di trading autonomo o può fungere da aggiunta al sistema di trading esistente. Questo indicatore analizza la candela corrente, calcolando alcuni fattori di forza all'interno del corpo della cande
L'indicatore SMC Venom Model BPR è uno strumento professionale per i trader che operano nell'ambito del concetto di Smart Money (SMC). Identifica automaticamente due modelli chiave sul grafico dei prezzi: FVG   (Fair Value Gap) è una combinazione di tre candele, in cui c'è un gap tra la prima e la terza candela. Forma una zona tra livelli in cui non c'è supporto di volume, il che spesso porta a una correzione dei prezzi. BPR   (Balanced Price Range) è una combinazione di due modelli FVG che for
This is an arrow indicator without a future function,developed based on the most advanced profit trading algorithms.It has the most innovative and advanced dual trend analysis module, as well as the latest and highly effective market trend prediction algorithm.Trends are your friends, and following larger trends can earn the maximum profit in foreign exchange. This indicator helps traders identify current trends and track them. Someone once made a profit of 10 times in a week by relying on it.No
Presenting one-of-a-kind Gann Indicator for XAUUSD IQ Gold Gann Levels is a non-repainting, precision tool designed exclusively for XAUUSD intraday trading. It uses W.D. Gann’s square root method to plot real-time support and resistance levels, helping traders spot high-probability entries with confidence and clarity. William Delbert Gann (W.D. Gann) was an exceptional market analyst whose trading technique was based on a complex blend of mathematics, geometry, astrology, and ancient calculation
Binary Options Support Resistance Indicator This indicator is designed for binary options trading and effectively shows retracements from support and resistance levels. Signals appear on the current candle. A red arrow pointing downwards indicates a potential selling opportunity, while a blue arrow pointing upwards suggests buying opportunities. All that needs adjustment is the color of the signal arrows. It is recommended to use it on the M1-M5 timeframes as signals are frequent on these timef
The Super Arrow Indicator provides non-repainting buy and sell signals with exceptional accuracy. Key Features No repainting – confirmed signals remain fixed Clear visual arrows: green for buy, red for sell Real-time alerts via pop-up, sound, and optional email Clean chart view with no unnecessary clutter Works on all markets: Forex, gold, oil, indices, crypto Adjustable Parameters TimeFrame Default: "current time frame" Function: Sets the time frame for indicator calculation Options: Can be set
Shark Deal Book
Philip Pankaj Suthagar
4 (3)
Term  "shark"  in the business world denotes a high volume investor who just made a good investment in a highly Potential business deal.So, sharks are the ones who make the market move. In our case, if an American shark bought a Japanese company, he/she has to convert American dollars into Japanese yen to make the deal. So, the demand for the Japanese yen will increase sharply. Thus USD/JPY will go short rapidly if the deal was from the shark. Another example, In the case of forex, if fed increa
VR Cub
Vladimir Pastushak
VR Cub è un indicatore per ottenere punti di ingresso di alta qualità. L'indicatore è stato sviluppato per facilitare i calcoli matematici e semplificare la ricerca dei punti di ingresso in una posizione. La strategia di trading per la quale è stato scritto l'indicatore ha dimostrato la sua efficacia per molti anni. La semplicità della strategia di trading è il suo grande vantaggio, che consente anche ai trader alle prime armi di commerciare con successo con essa. VR Cub calcola i punti di apert
Overview Harmonic Patterns MT4 is a technical analysis indicator designed for the MetaTrader 5 platform. It identifies and displays harmonic price patterns, such as Butterfly, Cypher, Crab, Bat, Shark, and Gartley, in both bullish and bearish directions. The indicator calculates key price levels, including entry, stop loss, and three take-profit levels, to assist traders in analyzing market movements. Visual elements and customizable alerts enhance usability on the chart. Features Detects six ha
DualVWAP
Kourosh Hossein Davallou
Dual Timeframe VWAP Indicator for MT4  Description Professional VWAP indicator that displays both **Daily** and **Weekly** VWAP simultaneously on your chart.   Features: - Dual VWAP Lines: Blue for Daily, Red for Weekly - Configurable Bands: Two deviation bands for each timeframe - Session Control: Customizable trading hours for Daily VWAP - Clean Visuals: Solid lines for main VWAP, dashed for bands - Optimizable: Parameters can be optimized using Genetic Algorithm Key Settings: - Enable/di
Trend PRO Expert Advisor
Nguyen Tran Ha
1 (2)
Trend PRO Expert Advisor  is developed base on the PipFinite Trend PRO Indicator, the best indicators on the market so far. PipFinite  Trend Pro's smart algorithm detects the trend, filters out market noise and gives entry signals with exit levels.  This EA open order when the indicator has buy/sell signals and set SL/TP follow the indicator rules. You can read more information about PipFinite Trend PRO indicator  here . Important Information   This EA will only work if you purchased  PipFinte
EARLY REMINDER: The Starting price is 65 price will rise soon up to 365$ and then 750$ after first 10 copies of sales. Grab this offer now! Introduction Hello, traders! Welcome to the demonstration of the Forex Beast Indicator , a comprehensive tool designed to assist aspiring traders in navigating the complexities of the forex market. This indicator incorporates seven essential components to provide a well-rounded trading experience: Moving Averages Colored Zones Support and Resistance Levels
Indicatore Crypto_Forex "Pattern 3 Black Crows" per MT4, senza ridisegnare, senza ritardi. Per i mercati in tendenza ribassista! - L'indicatore "Pattern 3 Black Crows" è molto potente per il trading di Price Action. - L'indicatore rileva i pattern ribassisti "3 Black Crows" sul grafico: segnale di freccia rossa sul grafico (vedi immagini). - Con avvisi su PC, dispositivi mobili ed e-mail. - È disponibile anche il suo indicatore gemello, il "Pattern 3 White Soldiers" rialzista (segui il link qui
PZ Harmonacci Patterns
PZ TRADING SLU
3.17 (6)
Trade smarter, not harder: Empower your trading with Harmonacci Patterns This is arguably the most complete harmonic price formation auto-recognition indicator you can find for the MetaTrader Platform. It detects 19 different patterns, takes fibonacci projections as seriously as you do, displays the Potential Reversal Zone (PRZ) and finds suitable stop-loss and take-profit levels. [ Installation Guide | Update Guide | Troubleshooting | FAQ | All Products  ] It detects 19 different harmonic pric
Professional Opening Range Breakout (ORB) indicator designed for precision session trading with automatic time handling, breakout alerts, and advanced target levels. This indicator automatically identifies the Opening Range for any configurable session, plots the High, Low, and Midpoint levels, and extends them across the trading day. Built-in breakout detection and alerts, range measurements, and extension targets provide traders with clear structure and actionable levels. Ideal for traders usi
Price Magnet — Price Density and Attraction Levels Indicator Price Magnet is a professional analytical tool designed to identify key support and resistance levels based on statistical Price Density. The indicator analyzes a specified historical period and detects price levels where the market spent the most time. These zones act as “magnets,” attracting price action or forming a structural base for potential reversals. Unlike traditional Volume Profile tools, Price Magnet focuses on price-time d
Auto Fibo Pro m
DMITRII GRIDASOV
Indicatore "Auto FIBO Pro" Crypto_Forex: è un ottimo strumento ausiliario nel trading! - L'indicatore calcola e posiziona automaticamente sul grafico i livelli di Fibo e le linee di tendenza locali (colore rosso). - I livelli di Fibonacci indicano le aree chiave in cui il prezzo può invertirsi. - I livelli più importanti sono 23,6%, 38,2%, 50% e 61,8%. - Puoi usarlo per lo scalping di inversione o per il trading di zone grid. - Ci sono molte opportunità per migliorare il tuo sistema attuale usa
Trend Bilio - an arrow indicator without redrawing shows potential market entry points in the form of arrows of the corresponding color: upward red arrows suggest opening a buy, green down arrows - selling. The entrance is supposed to be at the next bar after the pointer. The arrow indicator Trend Bilio visually "unloads" the price chart and saves time for analysis: no signal - no deal, if an opposite signal appears, then the current deal should be closed. It is Trend Bilio that is considered
We present you the indicator "Candle closing counter", which will become your indispensable assistant in the world of trading. That’s why knowing when the candle will close can help: If you like to trade using candle patterns, you will know when the candle will be closed. This indicator will allow you to check if a known pattern has formed and if there is a possibility of trading. The indicator will help you to prepare for market opening and market closure. You can set a timer to create a pre
Royal Dutch Skunk
Sayan Vandenhout
ROYAL DUTCH SKUNK USES THE TREND WAVE INDICATOR AND IT CAN IDENTIFY THE BEGINNING AND THE END OF A NEW WAVE TREND MOVEMENT. AS AN OSCILLATOR, THE INDICATOR IDENTIFIES THE OVERBOUGHT AND OVERSOLD ZONES. IT WORKS GREAT TO CATCH THE SHORT TERM PRICE REVERSALS AND USES A MARTINGALE STRATEGY TO CLOSE ALL TRADES IN PROFIT. USE DEFAULT SETTINGS ON H1 OR HIGHER TIME FRAME ON ANY PAIR FOR MORE ACCURATE TRADES WHY THIS EA : Smart entries calculated by 6 great strategies The EA can be run on even a $20000
Gli utenti di questo prodotto hanno anche acquistato
Neuro Poseidon MT4
Daria Rezueva
4.95 (41)
Neuro Poseidon is a new indicator by Daria Rezueva. It combines precise trading signals with adaptive TP/SL levels - creating best possible trades as a result! Message me and get  Neuro Poseidon Assistant  as a gift to automize your trading process! What makes it stand out? 1. Proven profitability on all assets and timeframes 2. Only confirmed BUY and SELL signals present on the chart 3. Adaptive TP & SL levels generated by the software for each trade 4. Easy to understand - suitable for all
Gann Made Easy
Oleg Rodin
4.84 (166)
Gann Made Easy è un sistema di trading Forex professionale e facile da usare che si basa sui migliori principi del trading utilizzando la teoria di mr. WD Gann. L'indicatore fornisce segnali ACQUISTA e VENDI accurati, inclusi i livelli di Stop Loss e Take Profit. Puoi fare trading anche in movimento utilizzando le notifiche PUSH. CONTATTAMI DOPO L'ACQUISTO PER RICEVERE GRATUITAMENTE LE ISTRUZIONI DI TRADING E OTTIMI INDICATORI EXTRA! Probabilmente hai già sentito parlare molte volte dei metodi d
Prop Firm Sniper
Mohamed Hassan
5 (1)
Prop Firm Sniper MT4  is a professional market structure indicator that automatically identifies high-probability BUY and SELL opportunities using BOS and CHoCH analysis. Recommended Timeframes: For backtesting, use the indicator on   M5 or M15   for Gold (XAUUSD), and   M15 or H1   for more volatile Forex pairs such as   GBPUSD, USDJPY, EURGBP , and similar markets. CONTACT ME AFTER PURCHASE TO CLAIM YOUR FREE BONUSES! Prop Firm Sniper  is a professional market structure indicator designed t
M1 Sniper
Oleg Rodin
5 (24)
M1 SNIPER è un sistema di indicatori di trading facile da usare. Si tratta di un indicatore a freccia progettato per l'intervallo temporale M1. L'indicatore può essere utilizzato come sistema autonomo per lo scalping sull'intervallo temporale M1 e come parte del tuo sistema di trading esistente. Sebbene questo sistema di trading sia stato progettato specificamente per il trading sull'intervallo temporale M1, può comunque essere utilizzato anche con altri intervalli temporali. Inizialmente ho pro
Trend Catcher ind
Ramil Minniakhmetov
5 (9)
INDICATORE TREND CATCHER L'indicatore Trend Catcher analizza i movimenti dei prezzi di mercato, utilizzando una combinazione di indicatori di analisi del trend proprietari dell'autore e personalizzati. Identifica la vera direzione del mercato filtrando il rumore a breve termine e concentrandosi sulla forza del momentum sottostante, sull'espansione della volatilità e sul comportamento della struttura dei prezzi. Utilizza inoltre una combinazione di indicatori personalizzati di smoothing e filtr
Questo prodotto è stato aggiornato per il mercato 2026 e ottimizzato per le ultime build di MT5. AVVISO DI AGGIORNAMENTO PREZZO: Smart Trend Trading System è attualmente disponibile a $99 . Il prezzo aumenterà a $199 dopo i prossimi 30 acquisti . OFFERTA SPECIALE: Dopo aver acquistato Smart Trend Trading System, inviami un messaggio privato per ricevere Smart Universal EA GRATIS e trasformare i tuoi segnali Smart Trend in operazioni automatiche. Smart Trend Trading System è un sistema di tradin
ORB Seeker
Marcela Goncalves De Oliveira
Prezzo speciale di lancio! Solo 59 dollari! Il prezzo aumenterà dopo 10 vendite, prezzo finale $199. Dopo l'acquisto, contattami per ricevere un Expert Advisor (EA) bonus GRATUITO in grado di automatizzare completamente i segnali di breakout e di fornire file di configurazione ottimizzati. Individua con sicurezza le eruzioni cutanee durante le sessioni di allenamento! ORB Seeker è un indicatore ORB (Opening Range Breakout) professionale, pensato per i trader che desiderano precisione, semplici
RelicusRoad Pro
Relicus LLC
4.65 (107)
RelicusRoad Pro: Sistema Operativo Quantitativo di Mercato 70% DI SCONTO ACCESSO A VITA (TEMPO LIMITATO) - UNISCITI A 2.000+ TRADER Perché la maggior parte dei trader fallisce anche con indicatori "perfetti"? Perché operano su Singoli Concetti isolati. Un segnale senza contesto è una scommessa. Per vincere serve CONFLUENZA . RelicusRoad Pro non è un semplice indicatore. È un Ecosistema Quantitativo completo . Mappa la "Fair Value Road", distinguendo tra rumore e rotture strutturali. Smetti di in
Indicatore Miraculous – Strumento Forex e Binario 100% Non-Repaint Basato sul Quadrato di Nove di Gann Questo video presenta l' Indicatore Miraculous , uno strumento di trading altamente accurato e potente, sviluppato specificamente per i trader di Forex e Opzioni Binarie . Ciò che rende unico questo indicatore è la sua base sul leggendario Quadrato di Nove di Gann e sulla Legge della Vibrazione di Gann , rendendolo uno degli strumenti di previsione più precisi disponibili nel trading moderno. L
BTMM State Engine Pro is a MetaTrader 4 indicator for traders who use the Beat The Market Maker approach: Asian session context, kill zone timing, level progression, peak formation detection, and a multi-pair scanner from a single chart. It combines cycle state logic with a built-in scanner dashboard so you do not need the same tool on many charts at once. What it does Draws the Asian session range; session times can follow broker server offset or be set in inputs. Tracks level progression (L
Scalper Inside PRO
Alexey Minkov
4.68 (69)
Scalper Inside PRO Scalper Inside PRO is an intraday trend and scalping indicator that uses exclusive built-in algorithms to evaluate market direction and key target levels. The indicator automatically calculates entry and exit points and several profit target levels, and it shows detailed performance statistics, so you can see how different instruments and strategies behaved on historical data. This helps you select instruments that fit current market conditions. You can also connect your own a
Neo Wave PRO
Nikolay Raykov
5 (1)
Price & Time Market Structure Indicator A professional market structure tool that analyzes waves through both price and time — not price alone. Main Description NeoWave PRO is a professional market structure indicator for MetaTrader 4 designed for traders who want to move beyond traditional one-dimensional wave tools such as ZigZag, swing indicators, and basic high/low systems. Most wave indicators analyze only one thing: Price. But a real market wave is not only a price movement. A true wave de
Dynamic Forex28 Navigator
Bernhard Schweigert
4.43 (7)
Dynamic Forex28 Navigator - Lo strumento di trading Forex di nuova generazione. ATTUALMENTE SCONTATO DEL 49%. Dynamic Forex28 Navigator è l'evoluzione dei nostri indicatori popolari di lunga data, che combinano la potenza di tre in uno: Advanced Currency Strength28 Indicator (695 recensioni) + Advanced Currency IMPULSE con ALERT (520 recensioni) + CS28 Combo Signals (Bonus). Dettagli sull'indicatore https://www.mql5.com/en/blogs/post/758844 Cosa offre l'indicatore di forza di nuova generazione?
PZ Trend Trading
PZ TRADING SLU
4.8 (5)
Capture every opportunity: your go-to indicator for profitable trend trading Trend Trading is an indicator designed to profit as much as possible from trends taking place in the market, by timing pullbacks and breakouts. It finds trading opportunities by analyzing what the price is doing during established trends. [ Installation Guide | Update Guide | Troubleshooting | FAQ | All Products ] Trade financial markets with confidence and efficiency Profit from established trends without getting whips
Atomic Analyst
Issam Kassas
5 (8)
Questo prodotto è stato aggiornato per il mercato 2026 e ottimizzato per le ultime build di MT5. AVVISO DI AGGIORNAMENTO PREZZO: Atomic Analyst è attualmente disponibile a $99 . Il prezzo aumenterà a $199 dopo i prossimi 30 acquisti . OFFERTA SPECIALE: Dopo aver acquistato Atomic Analyst, inviami un messaggio privato per ricevere Smart Universal EA GRATIS e trasformare i tuoi segnali Atomic Analyst in operazioni automatiche. Atomic Analyst è un indicatore di trading Price Action non-repainting
CRT Candle Range Theory HTF MT4.   Ultimate CRT Indicator: Advanced ICT Concepts and Malaysian SnR Trading System Master the Market Maker's Footprints with the Most Advanced Candle Range Theory Indicator Discounted   Price   $50  !!     Secure your lifetime access   now   before it switches to   subscription-only ! Unlock the true power of  Smart Money Concepts (SMC)  and trade precisely like the institutions with the  Ultimate CRT Indicator . Built exclusively for serious traders, this indicat
ATTUALMENTE SCONTATO DEL 40% La soluzione migliore per ogni principiante o trader esperto! Questo indicatore è uno strumento di trading unico, di alta qualità e conveniente perché abbiamo incorporato una serie di caratteristiche proprietarie e una nuova formula. Con un solo grafico è possibile leggere la forza delle valute per 28 coppie Forex! Immaginate come migliorerà il vostro trading perché sarete in grado di individuare l'esatto punto di innesco di una nuova tendenza o di un'opportunità
ATTUALMENTE SCONTATO DEL 40%! La soluzione migliore per ogni principiante o trader esperto! Questo indicatore è uno strumento di trading unico, di alta qualità e conveniente perché abbiamo incorporato una serie di caratteristiche proprietarie e una formula segreta. Con un solo grafico fornisce avvisi per tutte le 28 coppie di valute. Immaginate come migliorerà il vostro trading perché sarete in grado di individuare l'esatto punto di innesco di una nuova tendenza o opportunità di scalping! Co
KURAMA GOLD SIGNAL PRO (MT4) — Filtro a 7 livelli · TP/SL automatico · Punteggio di qualità · Salvataggio dello storico dei segnali | Sistema di trading completo per XAUUSD Nessun ridisegno (repaint) in tempo reale. Nell'istante in cui appare un segnale, freccia, ingresso, TP e SL vengono bloccati sul posto e non si spostano mai più. Ciò che fai tradare è proprio questo segnale in tempo reale. E nella v7.20, ogni segnale realmente inviato viene salvato automaticamente e ripristinato con esattez
MetaBands M4
Vahidreza Heidar Gholami
3.5 (6)
MetaBands uses powerful and unique algorithms to draw channels and detect trends so that it can provide traders with potential points for entering and exiting trades. It’s a channel indicator plus a powerful trend indicator. It includes different types of channels which can be merged to create new channels simply by using the input parameters. MetaBands uses all types of alerts to notify users about market events. Features Supports most of the channel algorithms Powerful trend detection algorith
PRO Renko System
Oleg Rodin
5 (30)
PRO Renko System è un sistema di trading altamente accurato appositamente progettato per il trading di grafici RENKO. Questo è un sistema universale che può essere applicato a vari strumenti di trading. Il sistema neutralizza efficacemente il cosiddetto rumore di mercato che consente di accedere a segnali di inversione accurati. L'indicatore è molto facile da usare e ha un solo parametro responsabile della generazione del segnale. Puoi facilmente adattare lo strumento a qualsiasi strumento di
Questo indicatore è un indicatore per l'analisi automatica delle onde perfetto per il trading pratico! Caso... Nota:   non sono abituato a usare nomi occidentali per la classificazione delle onde a causa dell'influenza della convenzione di denominazione di Tang Lun (Tang Zhong Shuo Zen), ho chiamato l'onda base come   penna   e la banda dell'onda secondaria come   segmento   At allo stesso tempo, il segmento ha la direzione del trend. La denominazione   è principalmente segmento di trend   (que
Advanced Supply Demand
Bernhard Schweigert
4.91 (300)
Speciale Trading- SCONTO DEL 30% La soluzione migliore per qualsiasi trader principiante o esperto! Questo indicatore è uno strumento di trading unico, di alta qualità e conveniente, perché abbiamo incorporato una serie di funzionalità proprietarie e una nuova formula. Con questo aggiornamento, potrai visualizzare doppie zone di timeframe. Non solo potrai visualizzare un TF più alto, ma anche entrambi, il TF del grafico e il TF più alto: MOSTRA ZONE ANNIDATE. Tutti i trader che operano con Of
IX Power MT4
Daniel Stein
4.82 (11)
IX Power: Scopri approfondimenti di mercato per indici, materie prime, criptovalute e forex Panoramica IX Power è uno strumento versatile progettato per analizzare la forza di indici, materie prime, criptovalute e simboli forex. Mentre FX Power offre la massima precisione per le coppie di valute utilizzando i dati di tutte le coppie disponibili, IX Power si concentra esclusivamente sui dati di mercato del simbolo sottostante. Questo rende IX Power una scelta eccellente per mercati non correlat
Reversal Identifier MT5 - Un indicatore in grado di individuare i punti di inversione su un grafico. Funziona senza ricalcoli o ritardi, identifica picchi e minimi frattali e segnala le inversioni con delle frecce. L'indicatore individua i punti di inversione precoci, dopo i quali si verifica una correzione o un cambio di direzione del trend. L'utilizzo ottimale di questo indicatore è su due timeframe: il timeframe superiore per determinare il trend e quello inferiore per ricevere i segnali di
Inside Bar Dashboard
Taras Slobodyanik
5 (3)
Multicurrency and multi-timeframe indicator Inside Bar (IB). In the parameters, you can specify any desired currencies and timeframes. The panel displays the last found Inside Bar (and Mother Bar) pattern, the current price position and the breakout of the levels of the Mother and Inside Bars. You can set the size and color for bars and text in the cells. The indicator can also send notifications when levels are broken. The dashboard highlights Double Inside Bar in a special color. By clicking
Trend Lines PRO
Roman Podpora
5 (1)
LINEE DI TENDENZA PRO       Aiuta a capire dove il mercato sta realmente cambiando direzione. L'indicatore mostra reali inversioni di tendenza e punti in cui i principali attori rientrano. Vedi  Linee BOS   Cambiamenti di tendenza e livelli chiave su timeframe più ampi, senza impostazioni complesse o rumore inutile. I segnali non vengono ridisegnati e rimangono sul grafico dopo la chiusura della barra. VERSIONE MT 5     -      Svela il suo massimo potenziale se abbinato all'indicatore   RFI LEVE
Enigmera
Ivan Stefanov
5 (8)
ENIGMERA: Il cuore del mercato Importante: La demo di MQL5.com funziona nel Strategy Tester e potrebbe non riflettere completamente le funzionalità di Enigmera. Consulta la descrizione, gli screenshot e il video per maggiori dettagli. Non esitare a inviarmi un messaggio se hai domande! Il codice dell'indicatore è stato completamente riscritto. La versione 3.0 aggiunge nuove funzionalità e corregge i bug accumulati dall'inizio dell'indicatore. Introduzione Questo indicatore e sistema di trading
Current event:  https://c.mql5.com/1/326/A2SR2025_NoMusic.gif R. Cos'è l'A2SR ?   * È un indicatore tecnico leader (nessuna riverniciatura, nessun ritardo). -- Guida : -- su https://www.mql5.com/en/blogs/post/734748/page4#comment_16532516 -- e https://www.mql5.com/en/users/yohana/blog A2SR ha una tecnica speciale per determinare i livelli di supporto (domanda) e resistenza (offerta). A differenza del modo ordinario che abbiamo visto in rete, A2SR ha un concetto originale nel determinare i li
KT Alpha Hunter Arrows MT4
KEENBASE SOFTWARE SOLUTIONS
La maggior parte degli indicatori a frecce ti dà un segnale e poi ti lascia capire da solo tutto il resto. KT Alpha Hunter Arrows ti offre un piano di trading completo. Ogni freccia di segnale viene visualizzata con un piano già tracciato: linea di ingresso, stop loss, quattro livelli di take profit e un verdetto edge in tempo reale che ti indica se quel simbolo e quel timeframe meritano di essere tradati in quel momento. Il pacchetto include un Trade Manager EA che gestisce l’esecuzione dopo il
Altri dall’autore
Line Profit
Iurii Tokman
5 (4)
Line Profit   Indicator of the visual line of profit in the deposit currency. Works only if there are open positions in the market for the symbol on which the indicator is installed. You can move the line with the mouse or enable automatic tracking of the Bid price. Description of indicator settings: colotLine - line color WidthLine - line width colotText - text color FontSize - the height of the text Anchor - an anchor method for text FollowBid - follow the Bid price
FREE
StopLevel
Iurii Tokman
StopLevel   The meter controls the STOPLEVEL level. When the level changes, it signals with an alert. STOPLEVEL - the   minimum offset in points from the current closing price for placing Stop orders, or the minimum allowable stop loss / take profit level in points. A zero value of STOPLEVEL means either the absence of a restriction on the minimum distance for stop loss / take profit, or the fact that the trading server uses external mechanisms for dynamic level control that cannot be transmitte
FREE
ChannelRSI5
Iurii Tokman
5 (5)
ChannelRSI5   The Relative Strength Index (RSI) indicator with dynamic levels of overbought and oversold zones. Dynamic levels change and adjust to the current changes in the indicator and prices, and represent a kind of channel. Indicator settings period_RSI - Averaging period for calculating the RSI index. applied_RSI - The applied price. It can be any of the price constants: PRICE_CLOSE - Closing price, PRICE_OPEN - Opening price, PRICE_HIGH - Maximum price for the period, PRICE_LOW - Minimum
FREE
MovingInWL
Iurii Tokman
MovingInWL   The Expert Advisor is designed to move the stop of open positions to no loss when they reach a certain predetermined profit level. Description of the advisor settings: MagicNumber - order identifier LevelProfit - The level of profit in points that the position must reach in order for its stop to be moved to the level without loss. LevelWLoss - The level without loss in points, to which the stop position will be transferred after its profit reaches the   LevelProfit   level in points
FREE
Indicatore Ombre: Svela il Potere Nascosto di Ogni Candela! Sei stanco di un'analisi superficiale dell'azione dei prezzi? Desideri una comprensione più profonda della forza di acquirenti e venditori in ogni intervallo temporale? Ti presentiamo l' Indicatore Ombre – il tuo strumento indispensabile per visualizzare e analizzare le dinamiche nascoste del mercato! Questo potente indicatore trasforma la battaglia invisibile tra tori e orsi, riflessa nella dimensione delle ombre delle candele, in un i
FREE
Comb
Iurii Tokman
The indicator displays a grid in the form of a "honeycomb" or regular hexagon. An alternative to the standard grid of the terminal. Description of the indicator settings: color_comb - grid color width - width, for example: 22 for a screen resolution of 1920*1080, 15 for a screen resolution of 1366*768, etc. height - height, for example: 6 for a screen resolution of 1920*1080, 4 for a screen resolution of 1366*768, etc.
FREE
Robo T
Iurii Tokman
Robo T Expert Advisor is a non-indicator trading system. Expert Advisor settings: Level_ord - distance from the current price for placing initial pending Buy Stop and Sell Stop orders, the default value is 22. Lot_1 - initial lot for buy series, the default value is 0.1. Lot_2 - initial lot for sell series, the default value is 0.1. TakeProfit - profit level, the default value is 30. TSProfitOnly - only profit is trailed. If disabled, trailing is also performed in the negative stop-loss area. Th
Hammering
Iurii Tokman
Hammering is an automated trading system which works on any currency pair. Multi-currency and single-currency trading is performed. Making decisions the EA uses signals of the Slope Direction Line indicator. Settings. Profit_Percent_AccountEquity = 0.4; - profit as percentage of free margin Fix_AccountEquity = 0; - fixed level of free margin FIX_PROFIT = 1000; - fixed level of profit period = 55; - indicator period. FilterNumber = 2; - indicator filter. ma_method = 3; - indicator averaging metho
Robo Grid FX
Iurii Tokman
ROBO GRID FX is a grid Expert Advisor. It is developed for intraday trading in the active market and on fast currency pairs. This is a grid EA with a closed-loop averaging system. The closed-loop averaging system represents a stable strategy of moving to breakeven in case of the deposit drawdown on fast and aggressive currency pairs. The EA places a grid of pending orders in both directions and locks it on the breakthrough of a quote fluctuation in the channel of 40-60 points in case of an unrpo
Crazy Scalper
Iurii Tokman
3.5 (4)
The Crazy Scalper trading robot does not use any indicators. It utilizes a scalping system, which trades in two directions simultaneously (buys and sells). Two opposite positions cannot bring profit at the same time, one of them will be losing. If there is a losing position, a lock is used. If the locking position fails and price reverses to the opposite, teh robot moves it to breakeven using the averaging system and pending orders. Settings TakeProfit = 3; - the take profit in points; Lock_Lev
Pyramid MA
Iurii Tokman
5 (1)
Pyramid MA - Characteristics of the EA: uses Moving Averages (MA) indicator. Changes order grid when a trend reverses. Exponent of order volume increase by the main trading grid against averaging positions. Works on pending BUYSTOP and SELLSTOP orders. Uses a system of averaging losses which controls a balance of open trades and moves it to breakeven. Sound alert about open and completed trades. You can easily create your own trading strategy on the basis of PYRAMID MA. Expert Advisor settings:
Boom
Iurii Tokman
The Expert Advisor is based on the indicator analysis. Trading decisions are made using Moving Average values. Indicators can be configured by external variables: TF = 0 - select a working timeframe. It can be one of the chart periods. 0 means the current chart period. 1 - 1 minute. 5 - 5 minutes. 15 - 15 minutes. 30 - 30 minutes. 60 - 1 hour. 240 - 4 hours. 1440 - 1 day. 10 080 - 1 week. 43 200 - 1 month. shift = 0 - index of obtained value from the indicator buffer (shifting back by specified
Forex Jumper
Iurii Tokman
1 (1)
Forex Jumper is an Expert Advisor for trading EURJPY. Candlestick pattern analysis is used for generating trading signals. The EA uses BUYSTOP and SELLSTOP pending orders. Settings: Lot = 0 - manual setup of the opened orders' volume Risk = 13 - MM risk percentage, the parameter works if Lot = 0 MagicNumber = 208 - ID of EA orders and positions, magic number TP = 20 - virtual profit level in points if there is a single unidirectional open position on the market TP2 = 20 - virtual profit level in
Bands Jazz
Iurii Tokman
Bands Jazz EA is based on the analysis of the Bollinger Bands indicator. The EA algorithm is simple - it uses Stop Loss, Take Profit and Trailing Stop. Settings TimeBeginHour —trading start hour. Values 0 to 24. TimeBeginMinute —trading start minute. Values 0 to 60. TimeEndHour —trading end hour. Values 0 to 24. TimeEndMinute —trading end minute. Values 0 to 60. period —averaging period for Bollinger Bands calculations. deviation —number of standard deviations from the main line for Bollinger B
Smart YTG
Iurii Tokman
4.6 (5)
Smart YTG has been developed for trading GBPUSD on the H1 chart. This is a trend following system and works well during trending price behavior using STOP orders. It detects trend by analyzing the Price Channel indicator which is built straight into the Expert Advisor, therefore you do not need to additionally install any indicator. On the flat areas where the market is undecided, and further movement of the market is being determined, a breakeven function is activated, and if there are open pos
Eureka Lock
Iurii Tokman
The Eureka Lock Expert Advisor detects flat price movement intervals relative to the specified settings. Trading is performed by BUY STOP and SELL STOP pending orders from the borders of the defined flat. Instead of limiting the losses, a loss-making position is locked by an increased volume. A virtual profit level is used as well. Settings: TF_flet = 15 - timeframe a flat is detected at Bars_flet = 25 - amount of bars for a flat detection extern int Size_flet = 30 - distance limit between the
The product shows general information in a single chart window. It is convenient when you trade many symbols simultaneously. The indicator shows the total number of positions and pending orders. The following info is displayed for opened positions: symbol, amount of opened buy orders for this symbol and their total profit in deposit currency, amount of opened sell orders and their total profit, total profit of opened buy and sell orders. The following info is displayed for pending orders: symbol
Moving Average. Calculation method: average value of all prices used for determining a bar. Description of External Settings of the EA: MA_period - period of averaging for calculation of the indicator. Recommended values: 5, 13, 21, 34. ma_method - averaging method. It can have any values ​​of the Moving Average method (Moving Average). 0 - (SMA) Simple Moving Average. 1 - (EMA) Exponential Moving Average. SMMA 2 - (SMMA) Smoothed Moving Average. LWMA 3 - (LWMA) Linear weighed Moving Average.
Description of the Settings: MA_period_fast - The period of averaging for calculation of fast Moving Average. MA_period_slow - The period of averaging for calculation of slow Moving Average. price - price used. It can be any of the price constants. 0 - (CLOSE) Close price. 1 - (OPEN) Open price. 2 - (HIGH) The maximum price. 3 - (LOW) The minimum price. 4 - (MEDIAN) The average price, (high+low)/2. 5 - (TYPICAL) Typical price, (high+low+close)/3. 6 - (WEIGHTED) Weighed close price, (high+low+clo
The Piramida Grid EA analyzes the values of the Slope Direction Line indicator for determining position entry. The grid of orders changes once the market reverses. Works on pending BUYSTOP and SELLSTOP orders. Uses a system of averaging losses which controls a balance of open trades and moves it to breakeven. Automatic detection of 4 and 5 decimal places. Expert Advisor Setup: period = 32; - period for the Slope Direction Line indicator FilterNumber = 2; - Slope Direction Line filter setup ma_m
The Martin Pristine trading robot analyzes the signals of the Price Channel Central indicator for trading decisions. No need to additionally attach the indicator to a chart, it's built into the Expert Advisor. After each losing trade, the lot is multiplied by 2. This Expert Advisor can detect 4 and 5-digit quotes automatically. Only one position can be open in the market at the same time. Expert Advisor settings: TF = 15; - select the chart timeframe for Price Channel Central Bars_Count = 100;
The Future Price indicator shows the probable variants of a future price movement based on the searching for matches in the quotes history. The indicator works in two modes: the first iterates over and displays the specified number of variants, the second - the indicator displays one specified variant. Settings Static_VARIANTS = 0; - display a specific variant; if = 0, iterates over all variants TOTAL_VARIANTS = 20; - the number of variants in the set, not greater than 30 is recommended Time_Se
Reanimator
Iurii Tokman
This is a semi-automatic trading robot. Buttons are used to open/close positions. Further position tracking is performed automatically by virtual profit level. Loss-making positions are averaged by increased/decreased lots. The buttons do not work in the strategy tester meaning that you can check the EA only on demo and real accounts. Special settings OPEN_BUY and OPEN_SELL can be used to test the EA in the strategy tester. Settings MagicNumber - identifier of the EA's orders. The robot works o
The indicator determines flat areas of the price movement according to the specified parameters. Settings: FletPips - limit in points for determining the flat FletBars - limit in number of bars for determining the flat CountBars - number of bars in history for the analysis of price movement. 0 - all bars in history are analyzed colir - color of the price section determined as flat Dop - additional drawing of price labels Alerts - display a dialog box with custom data Text - custom text for notif
Bar Boss
Iurii Tokman
5 (1)
The Expert Advisor uses the FletBoxPush indicator for market analysis and for determining trading signals. The indicator is built into the Expert Advisor, there is no need to additionally run it on a chart. The EA trades breakouts of certain levels determined as flat borders. The EA uses Stop Loss. Description of EA Parameters TimeFrames chart period required for the indicator colour - the color of the price zone defined as flat, a setting for the indicator Rectangle - show price zones defined
BarKhan
Iurii Tokman
The BarKhan indicator is calculated as sum of differences of three digital moving averages. The calculation formula is as follows: the difference of digital moving averages 1 and 2 is added to the difference of digital moving averages 2 and 3 Description of the indicator settings: MA_Period1 - the period of the first digital moving average MA_Period2 - the period of the second digital moving average MA_Period3 - the period of the third digital moving average
Octet
Iurii Tokman
Multi-currency indicator, analyzes 56 currency pairs simultaneously. It is important that all currency pairs are selected in the market watch with their history data downloaded. The indicator shows a rise or fall of a certain currency against the other 7 currencies as a total in the form of a line. The indicator values are expressed as a percentage. Description of the indicator settings Type_Calculation - three options for calculating the percentage of the currency rise or fall Prefix - used wh
Multi-currency indicator, analyzes 56 currency pairs simultaneously: AUD EUR GBP NZD CAD CHF JPY USD AUD SUMM EURAUD GBPAUD AUDNZD AUDCAD AUDCHF AUDJPY AUDUSD EUR EURAUD SUMM EURGBP EURNZD EURCAD EURCHF EURJPY EURUSD GBP GBPAUD EURGBP SUMM GBPNZD GBPCAD GBPCHF GBPJPY GBPUSD NZD AUDNZD EURNZD GBPNZD SUMM NZDCAD NZDCHF NZDJPY NZDUSD CAD AUDCAD EURCAD GBPCAD NZDCAD SUMM CADCHF CADJPY USDCAD CHF AUDCHF EURCHF GBPCHF NZDCHF CADCHF SUMM CHFJPY USDCHF JPY AUDJPY EURJPY GBPJPY NZDJPY CADJPY CHFJPY SUMM
Firm
Iurii Tokman
The Expert Advisor does not use indicator, it is always in the market. The logic of the EA is based on the analysis of the previously opened orders present in the market. Expert Advisor settings: StopLoss_Percent - loss level in percent TakeProfit - profit level in points Risk - setting for automatic calculation of order volumes for the EA, works if LOT =0 LOT - fixed volume of orders Slippage - maximum allowed price slippage MagicNumber - magic number for EA's orders Show_Information - enable o
Grid Flat
Iurii Tokman
The Expert Advisor places a grid of orders with the specified step. Orders have the take profit level set at the distance of grid step, as well as the total stop loss level for all order of the same type. Trading is performed only within the time interval specified in the settings. Once the time ends, all pending orders are deleted and all open positions are force-closed. It is not recommended to use the EA as a fully automated trading system for continuous trading, only for working in certain m
Filtro:
Nessuna recensione
Rispondi alla recensione