Gunn Chart

Graphique de Gann : Déverrouillez la Géométrie du Marché pour des Prédictions Précises !

Cherchez-vous à dépasser les outils d'analyse linéaire et à voir le marché sous une nouvelle perspective géométrique ? Souhaitez-vous exploiter la puissance du Carré de Gann pour identifier les niveaux clés de support et de résistance, ainsi que les points de retournement potentiels ?

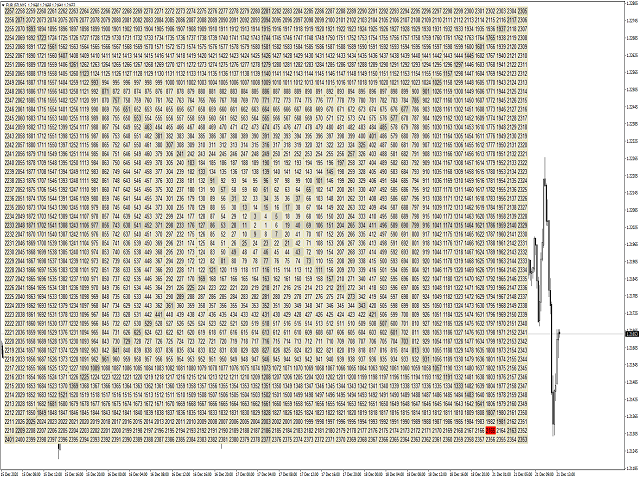
Nous vous présentons le Graphique de Gann – un indicateur innovant qui visualise le mouvement des prix dans le contexte du légendaire Carré de Gann. Cet outil débloque une manière unique d'analyser la structure du marché, basée sur les relations mathématiques et géométriques développées par l'un des plus grands traders de tous les temps – William Delbert Gann.

Qu'est-ce que le Carré de Gann et pourquoi est-il si puissant ?

Le Carré de Gann est un puissant outil d'analyse géométrique qui utilise une grille carrée pour afficher les niveaux de prix et les relations temporelles. Gann croyait que le marché évolue selon des lois mathématiques et des modèles géométriques prévisibles. Le Carré de Gann aide les traders à visualiser ces modèles, à identifier les niveaux clés de support et de résistance, à prévoir les retournements de tendance potentiels et à établir des niveaux cibles pour leurs transactions.

L'idée centrale est que les niveaux de prix significatifs se situent souvent à l'intersection de lignes tracées à des angles spécifiques à partir des hauts ou des bas clés, formant ainsi une structure carrée. En observant la manière dont le prix interagit avec ces niveaux, les traders peuvent obtenir des informations précieuses sur la force d'une tendance et les directions probables du mouvement futur.

Comment fonctionne l'indicateur Graphique de Gann ?

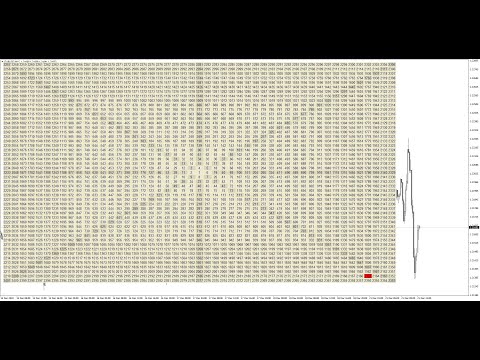
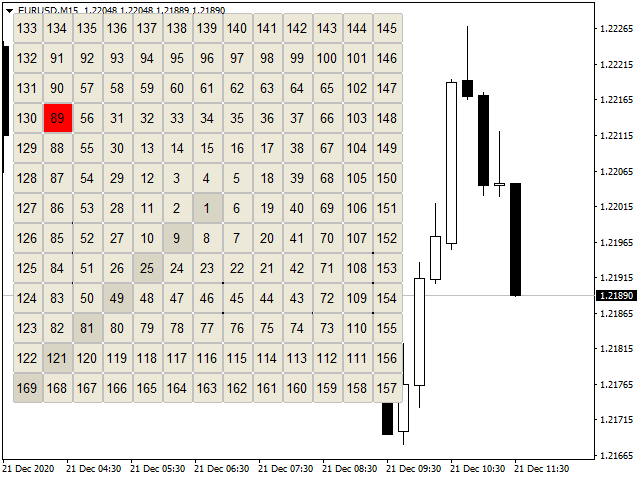
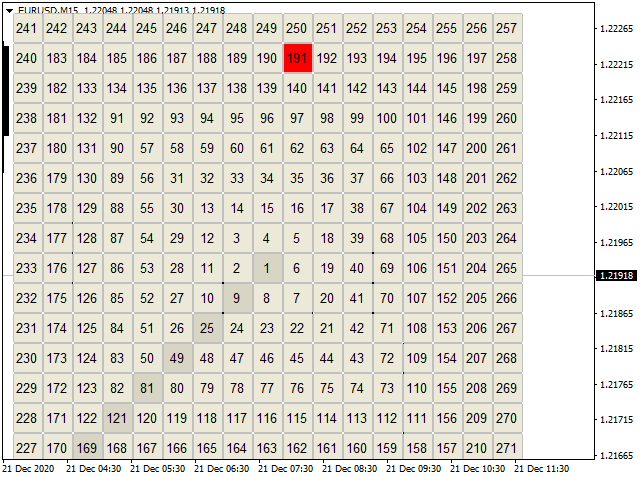
L'indicateur Graphique de Gann trace automatiquement la grille du Carré de Gann sur votre graphique, par rapport au prix actuel. Une caractéristique clé de l'indicateur est sa flexibilité dans la détermination de la valeur du prix central autour duquel le carré est construit. Grâce à des paramètres spécifiques, vous pouvez choisir quelle partie de la valeur du prix actuel sera utilisée pour le calcul.

Examinons en détail les paramètres qui déterminent la valeur du prix central :

  • Digit (Chiffre) : Ce paramètre définit combien de chiffres du prix seront utilisés pour le calcul, en commençant par une position spécifique.

    • Par exemple, si le prix actuel est 1.23456 et que Digit est réglé sur _5____ , le nombre 23456 sera utilisé pour le calcul.
    • Si Digit est réglé sur _6____ , 123456 sera utilisé.
    • Pour Digit = __4____ , 3456 sera utilisé.
    • Pour Digit = ___3___ , 456 sera utilisé.
  • minus_znak (Signe_moins) : Ce paramètre vous permet de supprimer un certain nombre de chiffres à droite de la partie sélectionnée du prix.

    • Par exemple, si Digit est réglé sur _5____ (ce qui donne 23456 ) et que minus_znak est réglé sur _0 , la valeur centrale sera 23456 .
    • Si minus_znak est réglé sur _1 , la valeur centrale sera 2345 .
    • Si minus_znak est réglé sur _2 , la valeur centrale sera 234 .

En utilisant une combinaison des paramètres Digit (Chiffre) et minus_znak (Signe_moins), vous pouvez affiner précisément la valeur du prix central à partir de laquelle le Carré de Gann sera construit, en vous concentrant sur les chiffres les plus significatifs du prix actuel selon votre analyse.

Contrôle Interactif du Carré de Gann :

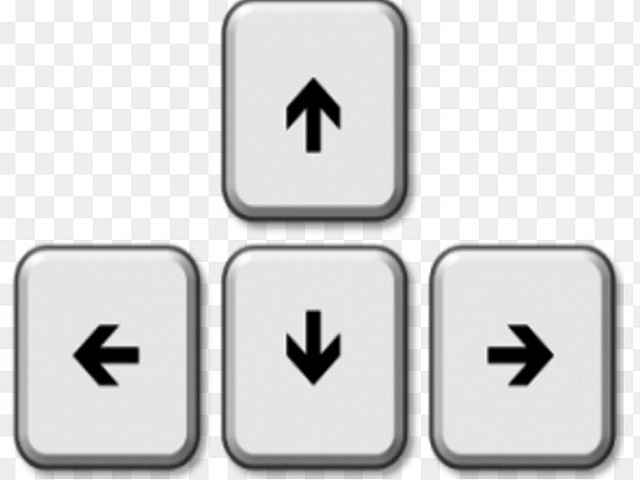
Pour assurer une flexibilité maximale dans l'analyse, l'indicateur Graphique de Gann vous permet de déplacer dynamiquement le Carré de Gann sur le graphique à l'aide de votre clavier :

  • Flèche vers le haut : Déplace tout le Carré de Gann vers le haut.
  • Flèche vers le bas : Déplace tout le Carré de Gann vers le bas.
  • Flèche vers la droite : Déplace tout le Carré de Gann vers la droite.
  • Flèche vers la gauche : Déplace tout le Carré de Gann vers la gauche.

Cette fonctionnalité vous permet d'adapter rapidement la position du carré aux hauts et aux bas historiques clés, ou aux niveaux de prix actuels, afin d'identifier les zones potentielles de support et de résistance.

Description des Paramètres de l'Indicateur :

  • _width (largeur) : La largeur de chaque cellule du carré en pixels. Définit la taille visuelle de la grille horizontalement.
  • _height (hauteur) : La hauteur de chaque cellule du carré en pixels. Définit la taille visuelle de la grille verticalement.
  • _font_size (taille_de_la_police) : La taille du texte affiché dans les cellules du carré (généralement les niveaux de prix).
  • clr_txt (couleur_du_texte) : La couleur du texte dans les cellules du carré.
  • clr_back (couleur_de_fond) : La couleur de fond des cellules du carré.
  • clr_border (couleur_de_la_bordure) : La couleur de la bordure (cadre) des cellules du carré.
  • clr_new_back (nouvelle_couleur_de_fond) : La couleur de fond de la cellule correspondant au prix actuel. Vous permet de mettre en évidence visuellement la valeur du prix actuel sur la grille.
  • Digit (Chiffre) : Utiliser le nombre total de chiffres dans la valeur de formation du prix.
  • minus_znak (Signe_moins) : Combien de chiffres supprimer à droite de la valeur de formation du prix.

Recommandation de Performance :

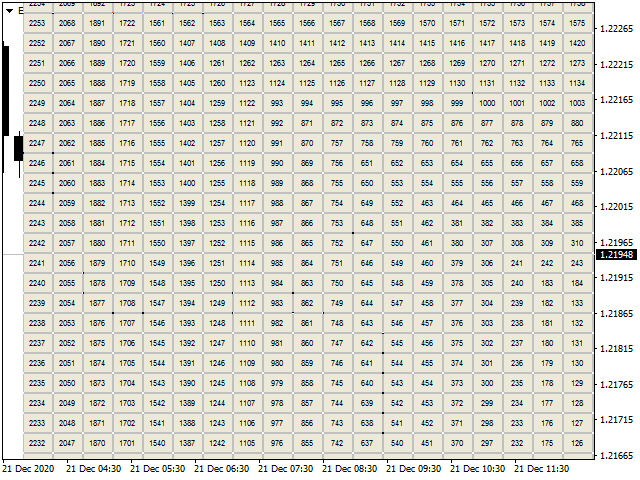
Veuillez noter que l'utilisation d'un grand nombre de chiffres dans le prix (valeurs de Digit _5____ ou _6____ ) peut entraîner une charge de calcul importante sur votre ordinateur, en particulier lorsque l'indicateur fonctionne activement. Si vous utilisez un ordinateur moins puissant, il est recommandé d'utiliser des valeurs plus petites pour le paramètre Digit ( ___3___ ou __4____ ) afin de garantir des performances optimales du terminal.

Avantages de l'utilisation de l'indicateur Graphique de Gann :

  • Approche géométrique unique de l'analyse de marché.
  • Visualisation des niveaux clés de support et de résistance basée sur les principes de Gann.
  • Identification potentielle des points de retournement de tendance.
  • Aide à établir des niveaux cibles pour les positions de trading.
  • Contrôle interactif pour une analyse flexible de différentes fourchettes de prix.
  • Paramètres personnalisables pour s'adapter aux stratégies de trading individuelles.

Débloquez les modèles cachés du marché avec l'indicateur Graphique de Gann ! Obtenez un outil puissant pour prévoir les mouvements de prix et prendre des décisions de trading plus éclairées !

Téléchargez l'indicateur Graphique de Gann dès maintenant et commencez à voir le marché à travers les yeux d'un trader légendaire !


Produits recommandés
Quantum Balance
Adolfina Denysenko
Quantum Balance is a modern arrow indicator that identifies key price reversal points in the market with high accuracy. It is based on a combination of WPR (Williams %R) and RSI (Relative Strength Index), which allows you to identify overbought/oversold moments and enter trades at points of maximum potential. The indicator analyzes price dynamics and market conditions, generating signals only when several confirming factors coincide. This reduces the number of false signals and increases tradin
« Dynamic Scalping Oscillator » est un indicateur Crypto Forex personnalisé avancé, un outil de trading efficace pour MT4 ! - Nouvelle génération d'oscillateurs : voir les images pour comprendre leur utilisation. - L'oscillateur de scalping dynamique dispose de zones de survente/surachat adaptatives. - L'oscillateur est un outil auxiliaire permettant de trouver des points d'entrée précis dans les zones dynamiques de survente/surachat. - Valeurs de survente : inférieures à la ligne verte ; valeu
Chart Patterns Detect 15 patterns (Ascending Triangle, Descending Triangle, Rising Wedge, Falling Wedge, Bullish Flag, Bearish Flag, Bullish Rectangle, Bearish Rectangle Symmetrical triangle, Head and Shoulders, Inverted Head and Shoulders, Triple top, Triple Bottom, Double Top, Double Bottom) Use historical data to calculate the probability of each pattern to succeed (possibility to filter notification according to the chance of success) gives graphic indication about the invalidation level and
Forex Gump
Andrey Kozak
2.4 (5)
Forex Gump is a fully finished semi-automatic trading system. In the form of arrows, signals are displayed on the screen for opening and closing deals. All you need is to follow the instructions of the indicator. When the indicator shows a blue arrow, you need to open a buy order. When the indicator shows a red arrow, you need to open a sell order. Close orders when the indicator draws a yellow cross. In order to get the most effective result, we recommend using the timeframes H1, H4, D1. There
RTrends
Nikolay Likhovid
The RTrends indicator does two things: first, it automatically draws the layout of the price chart by plotting trend lines and, secondly, it produces bearish and bullish signals. The layout reflects the fractal nature of the market. Trends from different time horizons are applied simultaneously on the chart. Thus, from a single chart a trader can see trend lines of higher timeframes. The lines, depending on the horizon, differ in color and width: the older the horizon, the thicker the line is. T
The new update makes this indicator a complete tool for studying, analyzing and operating probabilistic patterns. It includes: On-chart Multi-asset percentage monitor. Configurable martingales. Twenty-one pre-configured patterns , including Mhi patterns and C3. An advanced pattern editor to store up to 5 custom patterns. Backtest mode to test results with loss reports. Trend filter. Hit operational filter. Martingale Cycles option. Various types of strategies and alerts. Confluence between patte
Super Reversal Pattern
Parfait Mujinga Ndalika
Super Reversal Pattern Indicator Unlock the power of advanced pattern recognition with our Super Reversal Pattern Indicator. Designed for traders seeking precision and reliability, this indicator identifies one of the most effective reversal patterns in technical analysis, offering a significant edge in your trading strategy. Key Features: Non-Repainting Accuracy: Enjoy the confidence of non-repainting technology. Once a Super Reversal Pattern is detected, it remains static, providing consiste
Indicateur de gestion du risque et de suivi des limites pour traders professionnels et comptes d’évaluation (Prop) Cet outil affiche uniquement sur le graphique des informations précises de gestion du risque et de limites afin de vous aider à décider avec plus de concentration. L’indicateur n’ouvre/ferme/modifie aucune position et n’interfère pas avec les Expert Advisors. Fonctionnalités Suivi du drawdown quotidien et total Calcule et affiche le drawdown quotidien et total sur la base du solde
The indicator detects and displays Shark harmonic pattern (see the screenshot). The pattern is plotted by the extreme values of the ZigZag indicator (included in the resources, no need to install). After detecting the pattern, the indicator notifies of that by a pop-up window, a mobile notification and an email. The indicator highlights the process of the pattern formation and not just the complete pattern. In the former case, it is displayed in the contour triangles. After the pattern is comple
Auto Trendline Fibo Dow Theory - Automated Price Action & Structure Analysis Overview: Stop drawing manual trendlines and Fibonacci retracements! Auto Trendline Fibo Dow Theory  is a powerful price action utility designed to automate your technical analysis based on the classic Dow Theory and Fibonacci ratios. This indicator scans market structure using a customizable ZigZag algorithm to identify higher highs, higher lows (Uptrend), or lower highs, lower lows (Downtrend). It automatically plots
Daily Candle Predictor est un indicateur qui prédit le cours de clôture d'une bougie. L'indicateur est principalement destiné à être utilisé sur les graphiques D1. Cet indicateur convient à la fois au trading forex traditionnel et au trading d'options binaires. L'indicateur peut être utilisé comme un système de trading autonome, ou il peut servir de complément à votre système de trading existant. Cet indicateur analyse la bougie actuelle, calcule certains facteurs de force à l'intérieur du corps
L'indicateur SMC Venom Model BPR est un outil professionnel pour les traders travaillant dans le concept Smart Money (SMC). Il identifie automatiquement deux modèles clés sur le graphique des prix: FVG   (Fair Value Gap) est une combinaison de trois bougies, dans laquelle il y a un écart entre la première et la troisième bougie. Forme une zone entre les niveaux où il n'y a pas de support de volume, ce qui conduit souvent à une correction des prix. BPR   (Balanced Price Range) est une combinaiso
This is an arrow indicator without a future function,developed based on the most advanced profit trading algorithms.It has the most innovative and advanced dual trend analysis module, as well as the latest and highly effective market trend prediction algorithm.Trends are your friends, and following larger trends can earn the maximum profit in foreign exchange. This indicator helps traders identify current trends and track them. Someone once made a profit of 10 times in a week by relying on it.No
Presenting one-of-a-kind Gann Indicator for XAUUSD IQ Gold Gann Levels is a non-repainting, precision tool designed exclusively for XAUUSD intraday trading. It uses W.D. Gann’s square root method to plot real-time support and resistance levels, helping traders spot high-probability entries with confidence and clarity. William Delbert Gann (W.D. Gann) was an exceptional market analyst whose trading technique was based on a complex blend of mathematics, geometry, astrology, and ancient calculation
Binary Options Support Resistance Indicator This indicator is designed for binary options trading and effectively shows retracements from support and resistance levels. Signals appear on the current candle. A red arrow pointing downwards indicates a potential selling opportunity, while a blue arrow pointing upwards suggests buying opportunities. All that needs adjustment is the color of the signal arrows. It is recommended to use it on the M1-M5 timeframes as signals are frequent on these timef
The Super Arrow Indicator provides non-repainting buy and sell signals with exceptional accuracy. Key Features No repainting – confirmed signals remain fixed Clear visual arrows: green for buy, red for sell Real-time alerts via pop-up, sound, and optional email Clean chart view with no unnecessary clutter Works on all markets: Forex, gold, oil, indices, crypto Adjustable Parameters TimeFrame Default: "current time frame" Function: Sets the time frame for indicator calculation Options: Can be set
Shark Deal Book
Philip Pankaj Suthagar
4 (3)
Term  "shark"  in the business world denotes a high volume investor who just made a good investment in a highly Potential business deal.So, sharks are the ones who make the market move. In our case, if an American shark bought a Japanese company, he/she has to convert American dollars into Japanese yen to make the deal. So, the demand for the Japanese yen will increase sharply. Thus USD/JPY will go short rapidly if the deal was from the shark. Another example, In the case of forex, if fed increa
VR Cub
Vladimir Pastushak
VR Cub est un indicateur permettant d'obtenir des points d'entrée de haute qualité. L'indicateur a été développé pour faciliter les calculs mathématiques et simplifier la recherche de points d'entrée dans un poste. La stratégie de trading pour laquelle l'indicateur a été rédigé prouve son efficacité depuis de nombreuses années. La simplicité de la stratégie de trading est son grand avantage, qui permet même aux traders débutants de négocier avec succès avec elle. VR Cub calcule les points d'ouve
Overview Harmonic Patterns MT4 is a technical analysis indicator designed for the MetaTrader 5 platform. It identifies and displays harmonic price patterns, such as Butterfly, Cypher, Crab, Bat, Shark, and Gartley, in both bullish and bearish directions. The indicator calculates key price levels, including entry, stop loss, and three take-profit levels, to assist traders in analyzing market movements. Visual elements and customizable alerts enhance usability on the chart. Features Detects six ha
DualVWAP
Kourosh Hossein Davallou
Dual Timeframe VWAP Indicator for MT4  Description Professional VWAP indicator that displays both **Daily** and **Weekly** VWAP simultaneously on your chart.   Features: - Dual VWAP Lines: Blue for Daily, Red for Weekly - Configurable Bands: Two deviation bands for each timeframe - Session Control: Customizable trading hours for Daily VWAP - Clean Visuals: Solid lines for main VWAP, dashed for bands - Optimizable: Parameters can be optimized using Genetic Algorithm Key Settings: - Enable/di
Trend PRO Expert Advisor
Nguyen Tran Ha
1 (2)
Trend PRO Expert Advisor  is developed base on the PipFinite Trend PRO Indicator, the best indicators on the market so far. PipFinite  Trend Pro's smart algorithm detects the trend, filters out market noise and gives entry signals with exit levels.  This EA open order when the indicator has buy/sell signals and set SL/TP follow the indicator rules. You can read more information about PipFinite Trend PRO indicator  here . Important Information   This EA will only work if you purchased  PipFinte
EARLY REMINDER: The Starting price is 65 price will rise soon up to 365$ and then 750$ after first 10 copies of sales. Grab this offer now! Introduction Hello, traders! Welcome to the demonstration of the Forex Beast Indicator , a comprehensive tool designed to assist aspiring traders in navigating the complexities of the forex market. This indicator incorporates seven essential components to provide a well-rounded trading experience: Moving Averages Colored Zones Support and Resistance Levels
Indicateur Crypto_Forex « Motif 3 Corbeaux Noirs » pour MT4, sans modification, sans délai. Pour les marchés en tendance baissière ! - L'indicateur « Motif 3 Corbeaux Noirs » est très performant pour le trading Price Action. - L'indicateur détecte les motifs baissiers « 3 Corbeaux Noirs » sur le graphique : signal de flèche rouge (voir images). - Alertes PC, mobile et e-mail. - Son homologue haussier « Motif 3 Soldats Blancs » est également disponible (lien ci-dessous). - L'indicateur « Motif 3
PZ Harmonacci Patterns
PZ TRADING SLU
3.17 (6)
Trade smarter, not harder: Empower your trading with Harmonacci Patterns This is arguably the most complete harmonic price formation auto-recognition indicator you can find for the MetaTrader Platform. It detects 19 different patterns, takes fibonacci projections as seriously as you do, displays the Potential Reversal Zone (PRZ) and finds suitable stop-loss and take-profit levels. [ Installation Guide | Update Guide | Troubleshooting | FAQ | All Products  ] It detects 19 different harmonic pric
Professional Opening Range Breakout (ORB) indicator designed for precision session trading with automatic time handling, breakout alerts, and advanced target levels. This indicator automatically identifies the Opening Range for any configurable session, plots the High, Low, and Midpoint levels, and extends them across the trading day. Built-in breakout detection and alerts, range measurements, and extension targets provide traders with clear structure and actionable levels. Ideal for traders usi
Price Magnet — Price Density and Attraction Levels Indicator Price Magnet is a professional analytical tool designed to identify key support and resistance levels based on statistical Price Density. The indicator analyzes a specified historical period and detects price levels where the market spent the most time. These zones act as “magnets,” attracting price action or forming a structural base for potential reversals. Unlike traditional Volume Profile tools, Price Magnet focuses on price-time d
"Auto FIBO Pro" Crypto_Forex indicator - est un excellent outil auxiliaire dans le trading ! - L'indicateur calcule et place automatiquement sur le graphique les niveaux de Fibo et les lignes de tendance locales (couleur rouge). - Les niveaux de Fibonacci indiquent les zones clés où le prix peut s'inverser. - Les niveaux les plus importants sont 23,6 %, 38,2 %, 50 % et 61,8 %. - Vous pouvez l'utiliser pour le scalping inversé ou pour le trading en grille de zones. - Il existe également de nombr
Trend Bilio - an arrow indicator without redrawing shows potential market entry points in the form of arrows of the corresponding color: upward red arrows suggest opening a buy, green down arrows - selling. The entrance is supposed to be at the next bar after the pointer. The arrow indicator Trend Bilio visually "unloads" the price chart and saves time for analysis: no signal - no deal, if an opposite signal appears, then the current deal should be closed. It is Trend Bilio that is considered
We present you the indicator "Candle closing counter", which will become your indispensable assistant in the world of trading. That’s why knowing when the candle will close can help: If you like to trade using candle patterns, you will know when the candle will be closed. This indicator will allow you to check if a known pattern has formed and if there is a possibility of trading. The indicator will help you to prepare for market opening and market closure. You can set a timer to create a pre
Royal Dutch Skunk
Sayan Vandenhout
ROYAL DUTCH SKUNK USES THE TREND WAVE INDICATOR AND IT CAN IDENTIFY THE BEGINNING AND THE END OF A NEW WAVE TREND MOVEMENT. AS AN OSCILLATOR, THE INDICATOR IDENTIFIES THE OVERBOUGHT AND OVERSOLD ZONES. IT WORKS GREAT TO CATCH THE SHORT TERM PRICE REVERSALS AND USES A MARTINGALE STRATEGY TO CLOSE ALL TRADES IN PROFIT. USE DEFAULT SETTINGS ON H1 OR HIGHER TIME FRAME ON ANY PAIR FOR MORE ACCURATE TRADES WHY THIS EA : Smart entries calculated by 6 great strategies The EA can be run on even a $20000
Les acheteurs de ce produit ont également acheté
Neuro Poseidon MT4
Daria Rezueva
4.84 (43)
Neuro Poseidon is a new indicator by Daria Rezueva. It combines precise trading signals with adaptive TP/SL levels - creating best possible trades as a result! Message me and get  Neuro Poseidon Assistant  as a gift to automize your trading process! What makes it stand out? 1. Proven profitability on all assets and timeframes 2. Only confirmed BUY and SELL signals present on the chart 3. Adaptive TP & SL levels generated by the software for each trade 4. Easy to understand - suitable for all
Gann Made Easy
Oleg Rodin
4.84 (167)
Gann Made Easy est un système de trading Forex professionnel et facile à utiliser qui est basé sur les meilleurs principes de trading en utilisant la théorie de mr. WD Gann. L'indicateur fournit des signaux d'ACHAT et de VENTE précis, y compris les niveaux Stop Loss et Take Profit. Vous pouvez échanger même en déplacement en utilisant les notifications PUSH. VEUILLEZ ME CONTACTER APRÈS L'ACHAT POUR RECEVOIR GRATUITEMENT DES INSTRUCTIONS DE TRADING ET D'EXCELLENTS INDICATEURS SUPPLÉMENTAIRES! Vou
Prop Firm Sniper
Mohamed Hassan
5 (1)
Prop Firm Sniper MT4  is a professional market structure indicator that automatically identifies high-probability BUY and SELL opportunities using BOS and CHoCH analysis. Recommended Timeframes: For backtesting, use the indicator on   M5 or M15   for Gold (XAUUSD), and   M15 or H1   for more volatile Forex pairs such as   GBPUSD, USDJPY, EURGBP , and similar markets. CONTACT ME AFTER PURCHASE TO CLAIM YOUR FREE BONUSES! Prop Firm Sniper  is a professional market structure indicator designed t
Neo Wave PRO
Nikolay Raykov
5 (1)
Price & Time Market Structure Indicator A professional market structure tool that analyzes waves through both price and time — not price alone. Main Description NeoWave PRO is a professional market structure indicator for MetaTrader 4 designed for traders who want to move beyond traditional one-dimensional wave tools such as ZigZag, swing indicators, and basic high/low systems. Most wave indicators analyze only one thing: Price. But a real market wave is not only a price movement. A true wave de
Ce produit a été mis à jour pour le marché 2026 et optimisé pour les dernières versions de MT5. AVIS DE MISE À JOUR DU PRIX : Smart Price Action Concepts est actuellement disponible à $200 . Le prix passera à $299 après les 30 prochains achats . OFFRE SPÉCIALE : Après l’achat, envoyez-moi un message privé pour recevoir un bonus gratuit + un cadeau . Tout d’abord, il est important de souligner que cet outil de trading est un indicateur sans repaint, sans redrawing et sans retard, ce qui le rend
Atomic Analyst
Issam Kassas
5 (8)
Ce produit a été mis à jour pour le marché 2026 et optimisé pour les dernières versions de MT5. AVIS DE MISE À JOUR DU PRIX : Atomic Analyst est actuellement disponible à $99 . Le prix passera à $199 après les 30 prochains achats . OFFRE SPÉCIALE : Après avoir acheté Atomic Analyst, envoyez-moi un message privé pour recevoir Smart Universal EA GRATUITEMENT et transformer vos signaux Atomic Analyst en trades automatisés. Atomic Analyst est un indicateur de trading Price Action sans repaint, san
Indicateur Miraculous – Outil Forex et Binaire 100% Non-Repaint Basé sur le Carré de Neuf de Gann Cette vidéo présente l' Indicateur Miraculous , un outil de trading très précis et puissant, spécifiquement développé pour les traders du Forex et des Options Binaires . Ce qui rend cet indicateur unique est sa fondation sur le légendaire Carré de Neuf de Gann et la Loi de Vibration de Gann , en faisant l'un des outils de prévision les plus précis disponibles dans le trading moderne. L'Indicateur Mi
Advanced Supply Demand
Bernhard Schweigert
4.91 (301)
Offre spéciale : 30 % de réduction La solution idéale pour les traders débutants comme experts ! Cet indicateur est un outil de trading unique, performant et abordable grâce à l’intégration de nombreuses fonctionnalités exclusives et d’une nouvelle formule. Cette mise à jour vous permet d’afficher des zones sur deux unités de temps. Vous pourrez ainsi visualiser non seulement une unité de temps supérieure, mais aussi l’unité de temps du graphique, ainsi que l’unité de temps supérieure : des z
M1 Sniper
Oleg Rodin
5 (24)
M1 SNIPER est un système d'indicateurs de trading facile à utiliser. Il s'agit d'un indicateur à flèche conçu pour l'unité de temps M1. Cet indicateur peut être utilisé seul pour le scalping sur l'unité de temps M1 ou intégré à votre système de trading existant. Bien que conçu spécifiquement pour le trading sur l'unité de temps M1, ce système peut également être utilisé avec d'autres unités de temps. Initialement, j'avais conçu cette méthode pour le trading du XAUUSD et du BTCUSD. Cependant, je
Owl smart levels
Sergey Ermolov
4.26 (38)
Lors du trading dans le sens de la tendance, la principale difficulté n’est pas de trouver un niveau, mais de comprendre où une entrée est réellement valide. Le prix réagit souvent aux niveaux, mais ne parvient pas à poursuivre le mouvement — ce qui entraîne des entrées erronées ou des opportunités manquées. Owl Smart Levels ne se contente pas d’afficher des niveaux , mais des zones formées à partir de la structure du marché et des retracements. Cela permet d’évaluer les points d’entrée différem
PZ Trend Trading
PZ TRADING SLU
4.8 (5)
Capture every opportunity: your go-to indicator for profitable trend trading Trend Trading is an indicator designed to profit as much as possible from trends taking place in the market, by timing pullbacks and breakouts. It finds trading opportunities by analyzing what the price is doing during established trends. [ Installation Guide | Update Guide | Troubleshooting | FAQ | All Products ] Trade financial markets with confidence and efficiency Profit from established trends without getting whips
ORB Seeker
Marcela Goncalves De Oliveira
Prix de lancement spécial ! Seulement 79 $ ! Le prix augmentera après 10 ventes, prix final 199 $. Après votre achat, contactez-moi pour obtenir un EA bonus GRATUIT capable de trader les signaux de cassure de manière entièrement automatisée et avec des fichiers de configuration optimisés. Réussissez vos sessions de mixage en toute confiance ! ORB Seeker est un indicateur professionnel de cassure de la plage d'ouverture (ORB) conçu pour les traders qui recherchent précision, simplicité, flexibi
Le système PRO Renko est un système de trading très précis spécialement conçu pour le trading de graphiques RENKO. Il s'agit d'un système universel qui peut être appliqué à divers instruments de négociation. Le système neutralise efficacement ce qu'on appelle le bruit du marché en vous donnant accès à des signaux d'inversion précis. L'indicateur est très facile à utiliser et n'a qu'un seul paramètre responsable de la génération du signal. Vous pouvez facilement adapter l'outil à n'importe que
Signaux de Trading en Direct avec M1 Quantum : Signal   (L’opération est exécutée   automatiquement   par le   Quantum Trade Assistant , inclus   gratuitement   avec ce produit.) Note du développeur :   Après votre achat, veuillez me contacter pour recevoir le dernier   fichier de configuration recommandé (Set File) , des conseils de trading ainsi qu’une invitation au   groupe de support VIP , où vous pourrez échanger avec d’autres utilisateurs de M1 Quantum. Version MT5 disponible : Visiter MT
Ce produit a été mis à jour pour le marché 2026 et optimisé pour les dernières versions de MT5. AVIS DE MISE À JOUR DU PRIX : Smart Trend Trading System est actuellement disponible à $99 . Le prix passera à $199 après les 30 prochains achats . OFFRE SPÉCIALE : Après avoir acheté Smart Trend Trading System, envoyez-moi un message privé pour recevoir Smart Universal EA GRATUITEMENT et transformer vos signaux Smart Trend en trades automatisés. Smart Trend Trading System est un système de trading c
System Trend Pro
Aleksandr Makarov
5 (3)
System Trend Pro - This is the best trend trading indicator!!! The indicator no repaint!!!  The indicator has   MTF   mode, which adds confidence to trading on the trend (   no repaint   ). How to trade? Everything is very simple, we wait for the first signal (big arrow), then wait for the second signal (small arrow) and enter the market in the direction of the arrow. (See screens 1 and 2.) Exit on the opposite signal or take 20-30 pips, close half of it, and keep the rest until the opposite
Scalping Lines System -  est un système de scalping conçu spécifiquement pour le trading de l'or (XAUUSD) sur les unités de temps M1 et H1. Il combine des indicateurs de tendance, de volatilité et d'analyse de surachat/survente, regroupés dans un seul oscillateur pour identifier les signaux à court terme. Les principaux paramètres internes des lignes de signal sont préconfigurés. Certains paramètres restent ajustables manuellement : « Durée de la vague de tendance », qui régule la durée d'une
Actuellement 30% de réduction ! La meilleure solution pour tout débutant ou trader expert ! Ce logiciel de tableau de bord fonctionne sur 28 paires de devises. Il est basé sur 2 de nos principaux indicateurs (Advanced Currency Strength 28 et Advanced Currency Impulse). Il donne un excellent aperçu de l'ensemble du marché Forex. Il montre les valeurs de l'Advanced Currency Strength, la vitesse de mouvement des devises et les signaux pour 28 paires de devises dans tous les (9) délais. Imaginez
Market Structure Patterns MT4
Samuel Manoel De Souza
5 (18)
Market Structure Patterns   est un indicateur basé sur les   Smart Money Concepts   qui affiche les   éléments SMC/ICT   pouvant améliorer vos décisions de trading. Profitez des   alertes ,   notifications push   et   emails   pour être informé lorsqu’un élément se forme sur le graphique, que le prix franchit un niveau et/ou entre dans une zone. Les développeurs peuvent accéder aux valeurs des éléments de l’indicateur via les   variables globales , permettant l’automatisation des décisions de tr
Cycle Sniper
Elmira Memish
4.39 (36)
Please contact us after your purchase and we will send you the complimentary indicators to complete the system Cycle Sniper is not a holy grail but when you use it in a system which is explained in the videos, you will feel the difference. If you are not willing to focus on the charts designed with Cycle Sniper and other free tools we provide, we recommend not buying this indicator. We recommend watching the videos about the indiactor and system before purchasing. Videos, settings  and descri
Scalper Inside PRO
Alexey Minkov
4.68 (69)
Scalper Inside PRO Scalper Inside PRO is an intraday trend and scalping indicator that uses exclusive built-in algorithms to evaluate market direction and key target levels. The indicator automatically calculates entry and exit points and several profit target levels, and it shows detailed performance statistics, so you can see how different instruments and strategies behaved on historical data. This helps you select instruments that fit current market conditions. You can also connect your own a
CRT Candle Range Theory HTF MT4.   Ultimate CRT Indicator: Advanced ICT Concepts and Malaysian SnR Trading System Master the Market Maker's Footprints with the Most Advanced Candle Range Theory Indicator Discounted   Price   $50  !!     Secure your lifetime access   now   before it switches to   subscription-only ! Unlock the true power of  Smart Money Concepts (SMC)  and trade precisely like the institutions with the  Ultimate CRT Indicator . Built exclusively for serious traders, this indicat
BTMM State Engine Pro is a MetaTrader 4 indicator for traders who use the Beat The Market Maker approach: Asian session context, kill zone timing, level progression, peak formation detection, and a multi-pair scanner from a single chart. It combines cycle state logic with a built-in scanner dashboard so you do not need the same tool on many charts at once. What it does Draws the Asian session range; session times can follow broker server offset or be set in inputs. Tracks level progression (L
Dynamic Forex28 Navigator
Bernhard Schweigert
4.43 (7)
Dynamic Forex28 Navigator - L'outil de trading Forex de nouvelle génération. ACTUELLEMENT 49 % DE RÉDUCTION. Dynamic Forex28 Navigator est l'évolution de nos indicateurs populaires de longue date, combinant la puissance de trois en un : Advanced Currency Strength28 Indicator (695 avis) + Advanced Currency IMPULSE avec ALERT (520 avis) + CS28 Combo Signals (Bonus). Détails sur l'indicateur https://www.mql5.com/en/blogs/post/758844 Qu'offre l'indicateur de force de nouvelle génération ? Tout
Channel Trend Bands – A Comprehensive Indicator for Market Analysis MetaTrader 5 Version Simple to Use, Effective in Application User-Friendly and Suitable for All Traders This indicator stands out due to its straightforward functionality. Whether you're a beginner exploring the market or an experienced trader refining your strategy, this tool offers valuable insights. Using a Triangular Moving Average (TMA) with additional ATR-based bands , it provides structured market data to support well-i
Super Signal – Skyblade Edition Système de signaux de tendance professionnel sans repaint / sans latence, avec un taux de réussite exceptionnel | Pour MT4 / MT5 Il fonctionne mieux sur des unités de temps inférieures, comme 1 minute, 5 minutes et 15 minutes. Caractéristiques principales : Super Signal – Skyblade Edition est un système de signaux intelligent conçu spécifiquement pour le trading de tendance. Il utilise une logique de filtrage multicouche pour détecter uniquement les mouvements d
Apollo BuySell Predictor est un système de trading professionnel qui comprend plusieurs modules de trading. Il fournit au trader des zones de cassure uniques, des niveaux de support et de résistance basés sur Fibonacci, une ligne de tendance pivot, des signaux de volume de retrait et d'autres fonctionnalités utiles dont tout trader a besoin au quotidien. Le système fonctionnera avec n'importe quelle paire. Les délais recommandés sont M30, H1, H4. Bien que l'indicateur puisse également fonctionne
ACTUELLEMENT 40% DE RÉDUCTION La meilleure solution pour tout débutant ou trader expert ! Cet indicateur est un outil de trading unique, de haute qualité et abordable car nous avons incorporé un certain nombre de caractéristiques exclusives et une nouvelle formule. Avec seulement UN graphique, vous pouvez lire la force de la devise pour 28 paires Forex ! Imaginez comment votre trading va s'améliorer parce que vous êtes capable de repérer le point de déclenchement exact d'une nouvelle tendance
MetaBands M4
Vahidreza Heidar Gholami
3.5 (6)
MetaBands uses powerful and unique algorithms to draw channels and detect trends so that it can provide traders with potential points for entering and exiting trades. It’s a channel indicator plus a powerful trend indicator. It includes different types of channels which can be merged to create new channels simply by using the input parameters. MetaBands uses all types of alerts to notify users about market events. Features Supports most of the channel algorithms Powerful trend detection algorith
Divergence indicator 10 different indicators. Finding and displaying classic and hidden divergences. Indicators in which divergences are searched: MACD MACD Histogram; RSI; Stochastic; CCI; momentum; OBV; VWmacd; Chaikin Money Flow; Money Flow Index. This is a replica of the indicator from the tradingview resource, adapted for the MT4 terminal. MT5 version available here:  https://www.mql5.com/en/market/product/87879 Settings: Bars in history for analysis - number of bars for analysis; Diver
Plus de l'auteur
Line Profit
Iurii Tokman
5 (4)
Line Profit   Indicator of the visual line of profit in the deposit currency. Works only if there are open positions in the market for the symbol on which the indicator is installed. You can move the line with the mouse or enable automatic tracking of the Bid price. Description of indicator settings: colotLine - line color WidthLine - line width colotText - text color FontSize - the height of the text Anchor - an anchor method for text FollowBid - follow the Bid price
FREE
ChannelRSI5
Iurii Tokman
5 (5)
ChannelRSI5   The Relative Strength Index (RSI) indicator with dynamic levels of overbought and oversold zones. Dynamic levels change and adjust to the current changes in the indicator and prices, and represent a kind of channel. Indicator settings period_RSI - Averaging period for calculating the RSI index. applied_RSI - The applied price. It can be any of the price constants: PRICE_CLOSE - Closing price, PRICE_OPEN - Opening price, PRICE_HIGH - Maximum price for the period, PRICE_LOW - Minimum
FREE
MovingInWL
Iurii Tokman
MovingInWL   The Expert Advisor is designed to move the stop of open positions to no loss when they reach a certain predetermined profit level. Description of the advisor settings: MagicNumber - order identifier LevelProfit - The level of profit in points that the position must reach in order for its stop to be moved to the level without loss. LevelWLoss - The level without loss in points, to which the stop position will be transferred after its profit reaches the   LevelProfit   level in points
FREE
StopLevel   The meter controls the STOPLEVEL level. When the level changes, it signals with an alert. STOPLEVEL - the   minimum offset in points from the current closing price for placing Stop orders, or the minimum allowable stop loss / take profit level in points. A zero value of STOPLEVEL means either the absence of a restriction on the minimum distance for stop loss / take profit, or the fact that the trading server uses external mechanisms for dynamic level control that cannot be transmitte
FREE
Comb
Iurii Tokman
The indicator displays a grid in the form of a "honeycomb" or regular hexagon. An alternative to the standard grid of the terminal. Description of the indicator settings: color_comb - grid color width - width, for example: 22 for a screen resolution of 1920*1080, 15 for a screen resolution of 1366*768, etc. height - height, for example: 6 for a screen resolution of 1920*1080, 4 for a screen resolution of 1366*768, etc.
FREE
Indicateur d'Ombres : Libérez la Puissance Cachée de Chaque Bougie ! Fatigué de l'analyse superficielle de l'action des prix ? Souhaitez-vous une compréhension plus profonde de la force des acheteurs et des vendeurs à chaque échelle de temps ? Nous vous présentons l' Indicateur d'Ombres – votre outil indispensable pour visualiser et analyser la dynamique cachée du marché ! Cet indicateur puissant transforme la bataille invisible entre les haussiers et les baissiers, reflétée dans la taille des o
FREE
Robo T
Iurii Tokman
Robo T Expert Advisor is a non-indicator trading system. Expert Advisor settings: Level_ord - distance from the current price for placing initial pending Buy Stop and Sell Stop orders, the default value is 22. Lot_1 - initial lot for buy series, the default value is 0.1. Lot_2 - initial lot for sell series, the default value is 0.1. TakeProfit - profit level, the default value is 30. TSProfitOnly - only profit is trailed. If disabled, trailing is also performed in the negative stop-loss area. Th
Hammering
Iurii Tokman
Hammering is an automated trading system which works on any currency pair. Multi-currency and single-currency trading is performed. Making decisions the EA uses signals of the Slope Direction Line indicator. Settings. Profit_Percent_AccountEquity = 0.4; - profit as percentage of free margin Fix_AccountEquity = 0; - fixed level of free margin FIX_PROFIT = 1000; - fixed level of profit period = 55; - indicator period. FilterNumber = 2; - indicator filter. ma_method = 3; - indicator averaging metho
Robo Grid FX
Iurii Tokman
ROBO GRID FX is a grid Expert Advisor. It is developed for intraday trading in the active market and on fast currency pairs. This is a grid EA with a closed-loop averaging system. The closed-loop averaging system represents a stable strategy of moving to breakeven in case of the deposit drawdown on fast and aggressive currency pairs. The EA places a grid of pending orders in both directions and locks it on the breakthrough of a quote fluctuation in the channel of 40-60 points in case of an unrpo
Crazy Scalper
Iurii Tokman
3.5 (4)
The Crazy Scalper trading robot does not use any indicators. It utilizes a scalping system, which trades in two directions simultaneously (buys and sells). Two opposite positions cannot bring profit at the same time, one of them will be losing. If there is a losing position, a lock is used. If the locking position fails and price reverses to the opposite, teh robot moves it to breakeven using the averaging system and pending orders. Settings TakeProfit = 3; - the take profit in points; Lock_Lev
Pyramid MA
Iurii Tokman
5 (1)
Pyramid MA - Characteristics of the EA: uses Moving Averages (MA) indicator. Changes order grid when a trend reverses. Exponent of order volume increase by the main trading grid against averaging positions. Works on pending BUYSTOP and SELLSTOP orders. Uses a system of averaging losses which controls a balance of open trades and moves it to breakeven. Sound alert about open and completed trades. You can easily create your own trading strategy on the basis of PYRAMID MA. Expert Advisor settings:
Boom
Iurii Tokman
The Expert Advisor is based on the indicator analysis. Trading decisions are made using Moving Average values. Indicators can be configured by external variables: TF = 0 - select a working timeframe. It can be one of the chart periods. 0 means the current chart period. 1 - 1 minute. 5 - 5 minutes. 15 - 15 minutes. 30 - 30 minutes. 60 - 1 hour. 240 - 4 hours. 1440 - 1 day. 10 080 - 1 week. 43 200 - 1 month. shift = 0 - index of obtained value from the indicator buffer (shifting back by specified
Forex Jumper
Iurii Tokman
1 (1)
Forex Jumper is an Expert Advisor for trading EURJPY. Candlestick pattern analysis is used for generating trading signals. The EA uses BUYSTOP and SELLSTOP pending orders. Settings: Lot = 0 - manual setup of the opened orders' volume Risk = 13 - MM risk percentage, the parameter works if Lot = 0 MagicNumber = 208 - ID of EA orders and positions, magic number TP = 20 - virtual profit level in points if there is a single unidirectional open position on the market TP2 = 20 - virtual profit level in
Bands Jazz
Iurii Tokman
Bands Jazz EA is based on the analysis of the Bollinger Bands indicator. The EA algorithm is simple - it uses Stop Loss, Take Profit and Trailing Stop. Settings TimeBeginHour —trading start hour. Values 0 to 24. TimeBeginMinute —trading start minute. Values 0 to 60. TimeEndHour —trading end hour. Values 0 to 24. TimeEndMinute —trading end minute. Values 0 to 60. period —averaging period for Bollinger Bands calculations. deviation —number of standard deviations from the main line for Bollinger B
Smart YTG
Iurii Tokman
4.6 (5)
Smart YTG has been developed for trading GBPUSD on the H1 chart. This is a trend following system and works well during trending price behavior using STOP orders. It detects trend by analyzing the Price Channel indicator which is built straight into the Expert Advisor, therefore you do not need to additionally install any indicator. On the flat areas where the market is undecided, and further movement of the market is being determined, a breakeven function is activated, and if there are open pos
Eureka Lock
Iurii Tokman
The Eureka Lock Expert Advisor detects flat price movement intervals relative to the specified settings. Trading is performed by BUY STOP and SELL STOP pending orders from the borders of the defined flat. Instead of limiting the losses, a loss-making position is locked by an increased volume. A virtual profit level is used as well. Settings: TF_flet = 15 - timeframe a flat is detected at Bars_flet = 25 - amount of bars for a flat detection extern int Size_flet = 30 - distance limit between the
The product shows general information in a single chart window. It is convenient when you trade many symbols simultaneously. The indicator shows the total number of positions and pending orders. The following info is displayed for opened positions: symbol, amount of opened buy orders for this symbol and their total profit in deposit currency, amount of opened sell orders and their total profit, total profit of opened buy and sell orders. The following info is displayed for pending orders: symbol
Moving Average. Calculation method: average value of all prices used for determining a bar. Description of External Settings of the EA: MA_period - period of averaging for calculation of the indicator. Recommended values: 5, 13, 21, 34. ma_method - averaging method. It can have any values ​​of the Moving Average method (Moving Average). 0 - (SMA) Simple Moving Average. 1 - (EMA) Exponential Moving Average. SMMA 2 - (SMMA) Smoothed Moving Average. LWMA 3 - (LWMA) Linear weighed Moving Average.
Description of the Settings: MA_period_fast - The period of averaging for calculation of fast Moving Average. MA_period_slow - The period of averaging for calculation of slow Moving Average. price - price used. It can be any of the price constants. 0 - (CLOSE) Close price. 1 - (OPEN) Open price. 2 - (HIGH) The maximum price. 3 - (LOW) The minimum price. 4 - (MEDIAN) The average price, (high+low)/2. 5 - (TYPICAL) Typical price, (high+low+close)/3. 6 - (WEIGHTED) Weighed close price, (high+low+clo
The Piramida Grid EA analyzes the values of the Slope Direction Line indicator for determining position entry. The grid of orders changes once the market reverses. Works on pending BUYSTOP and SELLSTOP orders. Uses a system of averaging losses which controls a balance of open trades and moves it to breakeven. Automatic detection of 4 and 5 decimal places. Expert Advisor Setup: period = 32; - period for the Slope Direction Line indicator FilterNumber = 2; - Slope Direction Line filter setup ma_m
The Martin Pristine trading robot analyzes the signals of the Price Channel Central indicator for trading decisions. No need to additionally attach the indicator to a chart, it's built into the Expert Advisor. After each losing trade, the lot is multiplied by 2. This Expert Advisor can detect 4 and 5-digit quotes automatically. Only one position can be open in the market at the same time. Expert Advisor settings: TF = 15; - select the chart timeframe for Price Channel Central Bars_Count = 100;
The Future Price indicator shows the probable variants of a future price movement based on the searching for matches in the quotes history. The indicator works in two modes: the first iterates over and displays the specified number of variants, the second - the indicator displays one specified variant. Settings Static_VARIANTS = 0; - display a specific variant; if = 0, iterates over all variants TOTAL_VARIANTS = 20; - the number of variants in the set, not greater than 30 is recommended Time_Se
Reanimator
Iurii Tokman
This is a semi-automatic trading robot. Buttons are used to open/close positions. Further position tracking is performed automatically by virtual profit level. Loss-making positions are averaged by increased/decreased lots. The buttons do not work in the strategy tester meaning that you can check the EA only on demo and real accounts. Special settings OPEN_BUY and OPEN_SELL can be used to test the EA in the strategy tester. Settings MagicNumber - identifier of the EA's orders. The robot works o
The indicator determines flat areas of the price movement according to the specified parameters. Settings: FletPips - limit in points for determining the flat FletBars - limit in number of bars for determining the flat CountBars - number of bars in history for the analysis of price movement. 0 - all bars in history are analyzed colir - color of the price section determined as flat Dop - additional drawing of price labels Alerts - display a dialog box with custom data Text - custom text for notif
Bar Boss
Iurii Tokman
5 (1)
The Expert Advisor uses the FletBoxPush indicator for market analysis and for determining trading signals. The indicator is built into the Expert Advisor, there is no need to additionally run it on a chart. The EA trades breakouts of certain levels determined as flat borders. The EA uses Stop Loss. Description of EA Parameters TimeFrames chart period required for the indicator colour - the color of the price zone defined as flat, a setting for the indicator Rectangle - show price zones defined
BarKhan
Iurii Tokman
The BarKhan indicator is calculated as sum of differences of three digital moving averages. The calculation formula is as follows: the difference of digital moving averages 1 and 2 is added to the difference of digital moving averages 2 and 3 Description of the indicator settings: MA_Period1 - the period of the first digital moving average MA_Period2 - the period of the second digital moving average MA_Period3 - the period of the third digital moving average
Octet
Iurii Tokman
Multi-currency indicator, analyzes 56 currency pairs simultaneously. It is important that all currency pairs are selected in the market watch with their history data downloaded. The indicator shows a rise or fall of a certain currency against the other 7 currencies as a total in the form of a line. The indicator values are expressed as a percentage. Description of the indicator settings Type_Calculation - three options for calculating the percentage of the currency rise or fall Prefix - used wh
Multi-currency indicator, analyzes 56 currency pairs simultaneously: AUD EUR GBP NZD CAD CHF JPY USD AUD SUMM EURAUD GBPAUD AUDNZD AUDCAD AUDCHF AUDJPY AUDUSD EUR EURAUD SUMM EURGBP EURNZD EURCAD EURCHF EURJPY EURUSD GBP GBPAUD EURGBP SUMM GBPNZD GBPCAD GBPCHF GBPJPY GBPUSD NZD AUDNZD EURNZD GBPNZD SUMM NZDCAD NZDCHF NZDJPY NZDUSD CAD AUDCAD EURCAD GBPCAD NZDCAD SUMM CADCHF CADJPY USDCAD CHF AUDCHF EURCHF GBPCHF NZDCHF CADCHF SUMM CHFJPY USDCHF JPY AUDJPY EURJPY GBPJPY NZDJPY CADJPY CHFJPY SUMM
Firm
Iurii Tokman
The Expert Advisor does not use indicator, it is always in the market. The logic of the EA is based on the analysis of the previously opened orders present in the market. Expert Advisor settings: StopLoss_Percent - loss level in percent TakeProfit - profit level in points Risk - setting for automatic calculation of order volumes for the EA, works if LOT =0 LOT - fixed volume of orders Slippage - maximum allowed price slippage MagicNumber - magic number for EA's orders Show_Information - enable o
Grid Flat
Iurii Tokman
The Expert Advisor places a grid of orders with the specified step. Orders have the take profit level set at the distance of grid step, as well as the total stop loss level for all order of the same type. Trading is performed only within the time interval specified in the settings. Once the time ends, all pending orders are deleted and all open positions are force-closed. It is not recommended to use the EA as a fully automated trading system for continuous trading, only for working in certain m
Filtrer:
Aucun avis
Répondre à l'avis