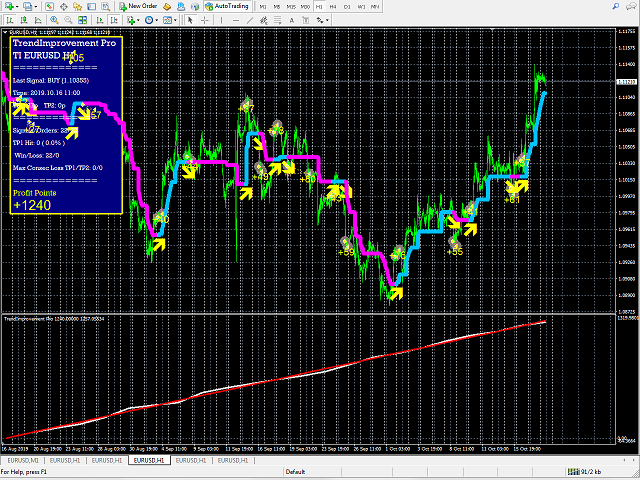
TrendImprovement Pro
- Indicatori
-
Nauris Zukas
 Trading in Forex since 2001.
Developing EA's since 2005.
Third place winner in Automated Trading Championship 2008.
https://www.mql5.com/en/forum/114185 - Versione: 5.10
- Aggiornato: 19 maggio 2022
- Attivazioni: 5
ATTENTION! TI Opti Pro – a powerful tool for testing the input parameters for the TrendImprovement indicator will allow you to quickly find the most profitable options for the input parameters.
New project.
Description.
It is no secret to anyone that there is no universal indicator that would be profitable on all currency pairs and time frames in the long term. All universal indicators generate little profit on some currency pairs or do not make profit on other currency pairs at all in the long run. And I did not see an indicator that could work without change in the long term. Indicators must be adapted to the new market behavior. After some time, all indicators need to be optimized for further profit. The concept of the idea is to let the trader find the best parameters for each pair and timeframe themselves. It is clear that this will take a long time, but the community of traders can share the results in a public environment. Also, traders do not have to buy an indicator, all this can be preliminarily done on demo tests.
Testing
To find the optimal parameters, it is best to use forward tests. This is a test of the system parameters obtained during optimization on a different historical data sample other than the optimization one. For our purposes, it is best to use the last two months. In the first month find some of the best parameters. In the last month, check whether these settings are suitable or if they are already outdated. Let's test on a specific example EURUSD 1H timeframe:
- Open the strategy tester, select the start and last date of the last month. Period 1H and set the visualization speed to 1.
- Open the indicator property and set Maximum History Bars = 528 (approximate number of bars in one month).
- Start testing, if the results are not satisfactory, stop testing, change the parameters and start testing again.
- If the results are good, set the visualization speed to the maximum and check the result in the last months.
- If the results for the last month are good, then can already consider these parameters in real trading.
- Save the results using Short Name to describe the parameters.
Options
- Short_Name * - short name;
- DateOrBars - switch for using time or number of bars;
- Maximum History Bars - the maximum number of bars for calculation;
- StartHistory - indicator start time;
- FAST_MA - averaging period fast MA;
- FAST_MA_SHIFT - shift of fast MA by a specified number of periods ago;
- SLOW_MA - Averaging period of slow MA;
- SLOW_MA_SHIFT - shift of the slow MA by the specified number of periods back;
- RSI_PERIOD - RSI averaging period;
- RSI_SHIFT - RSI shift by the specified number of periods ago;
- RSI_Open - signal appearance level (from 0 to 50);
- RSI_Change - level change of the signal line (from 0 to 50);
- ATR_Period_TPSL - ATR averaging period for calculating TP and SL;
- TP1_Percents - the first level of profit as a percentage of ATR;
- TP2_Percents - the second level of profit as a percentage of ATR;
- SL1_Percents - loss rate as a percentage of ATR;
- SmartFilter - smart filter (works on H1 and less)
- IndicatorShift - indicator shift relative to the price chart in bars;
- IndicatorShiftDate - indicator shift relative to the price chart in time;
- ShowInfopanel - show the information panel;
- ShowOrdersMode ** - switching display statistics;
- AlertON - enable / disable notifications.
* Short_Name name will be needed if you use different indicator settings for different charts.
** ShowOrdersMode:
(true) shows the total number of profitable / loss-making orders (W / L);
(false) shows the results of the first closing of positions on one signal. If the first order is closed in profit, then the signal is considered profitable (Win + 1), if it is closed at a loss, then the signal is unprofitable (Loss + 1).


L'utente non ha lasciato alcun commento sulla valutazione.