Belkhayate Gravity Center MT4
- Indicatori
-
Ahmed Alaoui Chrifi
 I am an engineer, passionate about programming and trading.
You check my reviews at: - Versione: 2.0
- Attivazioni: 5
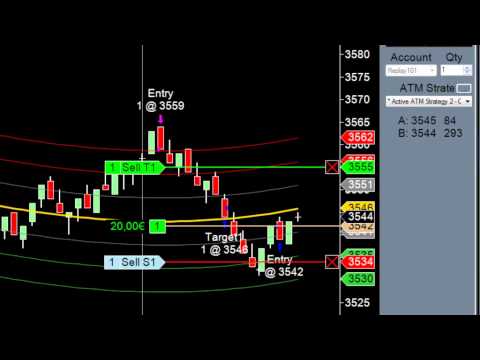
The Belkhayate center of gravity indicator is best used to confirm major turning
points, and distinguish price extremes. Generally if price reaches the
upper or lower levels one should expect a turn around coming soon, or at
least a pull back towards the centre line if there is a strong trend.
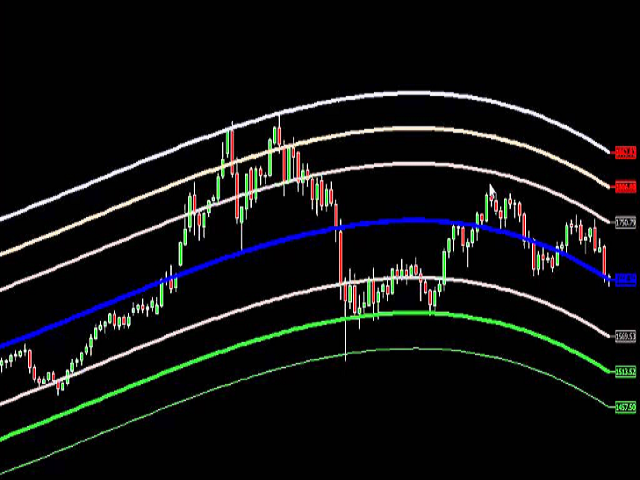
The upper and lower levels are red and green lines.
Our indicator use the same parameters as the well known trader M.Mostafa Belkhayate the inventor of the indicator, allow the use of buffers for your EA and allow notification for every closed bar beyond lower or upper limit to your phone.
Strategy:
The idea is to buy between or beyond the Green lines to reach the center blue line, and sell between or beyond the red lines to reach the center blue line.
Parameters:
Push notification for signals : true or false: Notification to your mobile in case of closed bar beyond limits.
Alert notification for signals : true or false: Alert in your terminal in case of closed bar beyond limits.
Buffers:
0: Center blue line values.
1: Upper Line 1 values ,Red.
2: Upper Line 2 values ,Red.
3: Upper Line 3 values,Red.
4: Lower Line 1 values,Green.
5: Lower Line 2 values,Green.
6: Lower Line 3 values,Green.

Excellent Indicator helps a lot in taking decision i wish author should make MTF dashboard on this gravity center can see all assets with MTF results Thanks a lot