Door

"Guida di Tendenza": L'Indicatore che Svela i Segreti della Dinamica di Mercato

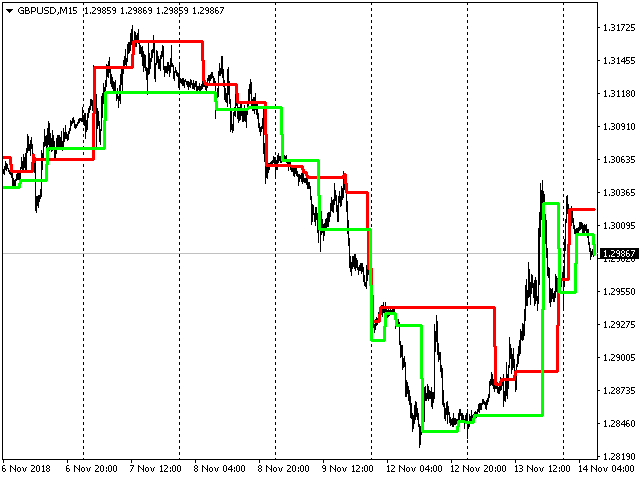
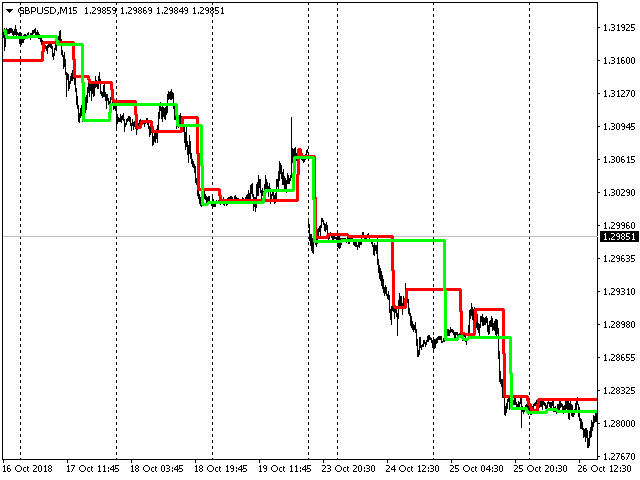
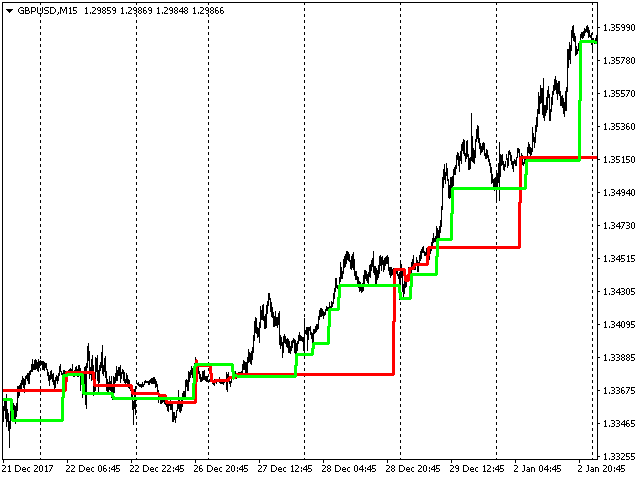
Dimentica di vagare nei labirinti delle fluttuazioni di prezzo! L'indicatore "Guida di Tendenza" è la tua bussola personale nel mondo dei mercati finanziari. Visualizza chiaramente le tre direzioni fondamentali del movimento dei prezzi: un rapido slancio verso l'alto, una caduta inarrestabile verso il basso e una tranquilla deriva laterale.

Questo strumento è il tuo fedele assistente nella determinazione della direzione dominante del trend. In termini semplici, rende cristalline le correnti invisibili del mercato. D'ora in poi, potrai sempre navigare con il vento in poppa del trend, massimizzando le tue possibilità di successo.

Ma non è tutto! "Guida di Tendenza" apre per te nuovi orizzonti di analisi. Definisce magistralmente i canali di prezzo e i livelli chiave di supporto e resistenza, fornendoti punti di riferimento strategicamente importanti per prendere decisioni di trading informate. Immagina quanto facilmente potrai identificare i punti di ingresso e di uscita redditizi dal mercato!

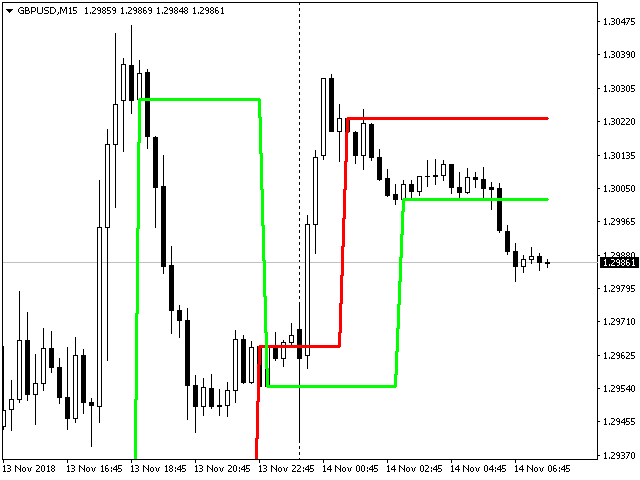
Per raggiungere una precisione e una tempestività ottimali dei segnali, raccomandiamo vivamente di utilizzare l'indicatore su un grafico con il periodo M15. Questo timeframe fornisce l'equilibrio perfetto tra dettaglio e filtraggio del rumore di mercato.

Flessibilità Personalizzabile per il Tuo Stile:

L'indicatore è dotato di una comoda impostazione bar_limit. Tu stesso determini la profondità dell'analisi specificando il numero di barre recenti da visualizzare per l'indicatore. Vuoi vedere l'intera cronologia dei prezzi? Basta impostare il valore su 0, e l'immagine completa dei movimenti di mercato si dispiegherà davanti a te.

"Guida di Tendenza" non è solo un indicatore; è il tuo partner affidabile nel mondo del trading, aiutandoti a vedere il mercato chiaramente, a fare trading con fiducia e a raggiungere nuove vette finanziarie!

"Guida di Tendenza": La Tua Chiave per Comprendere e Conquistare i Trend di Mercato

L'indicatore "Guida di Tendenza" non è solo una visualizzazione dei movimenti di prezzo; è un potente strumento per l'analisi approfondita della dinamica di mercato e lo sviluppo di strategie di trading redditizie. Rivela le tre tendenze principali – rialzista, ribassista e laterale – rendendole evidenti per le tue decisioni di trading.

Metodi di Trading e Analisi di Mercato con "Guida di Tendenza":

  1. Trading di Seguito del Trend (Trend Following):

    • Identificazione del trend principale: L'indicatore mostra chiaramente la direzione predominante del movimento dei prezzi. Utilizzalo per determinare il trend principale su timeframe superiori (ad esempio, H1, H4).
    • Ricerca di punti di ingresso a favore del trend: Su timeframe inferiori (ad esempio, M15, M30), cerca i momenti in cui il prezzo corregge contro il trend principale, ma l'indicatore conferma ancora la sua direzione. Apri posizioni nella direzione del trend principale dopo il completamento della correzione.
  2. Identificazione di Canali e Livelli di Supporto/Resistenza:

    • Visualizzazione dei canali: L'indicatore può aiutare a visualizzare i canali di prezzo all'interno dei quali si muove il prezzo. Fai trading dai limiti del canale nella direzione del trend principale o su una rottura del canale con la conferma di altri indicatori.
    • Identificazione dei livelli: Le aree orizzontali in cui l'indicatore mostra consolidamento o un cambio di direzione possono indicare importanti livelli di supporto e resistenza. Utilizza questi livelli per impostare stop-loss e take-profit, nonché per cercare punti di inversione.
  3. Analisi della Forza del Trend:

    • Durata e stabilità: La durata e la stabilità della visualizzazione di una direzione particolare da parte dell'indicatore possono indicare la forza del trend. Sezioni lunghe e chiare di un solo colore indicano un trend forte.
    • Cambio di colore: Un cambio di colore dell'indicatore può essere un segnale precoce di un indebolimento del trend o di un possibile inversione. Tuttavia, questo segnale richiede una conferma.

Costruzione di una Strategia di Trading Basata su "Guida di Tendenza":

  1. Strategia Semplice di Seguito del Trend (per principianti):

    • Regola di ingresso: Sul timeframe M15, se l'indicatore mostra un trend rialzista (ad esempio, cambia colore in verde), apri una posizione lunga dopo una piccola correzione ribassista. Se l'indicatore mostra un trend ribassista (cambia colore in rosso), apri una posizione corta dopo una piccola correzione rialzista.
    • Regola di uscita: Imposta lo stop-loss al livello dell'ultimo minimo locale (per posizioni lunghe) o massimo (per posizioni corte). Imposta il take-profit a un livello due volte superiore alla dimensione dello stop-loss (rapporto rischio/rendimento 1:2).
    • Filtro: Considera per il trading solo quei segnali che corrispondono al trend principale determinato su un timeframe superiore (ad esempio, H1).
  2. Strategia di Rottura dei Canali:

    • Identificazione del canale: Sul timeframe M15, identifica il canale di prezzo utilizzando la visualizzazione dell'indicatore.
    • Regola di ingresso: Apri una posizione sulla rottura del limite del canale (superiore per gli acquisti, inferiore per le vendite) con la conferma di un aumento di volume o di un altro indicatore di conferma.
    • Regola di uscita: Imposta lo stop-loss oltre il limite rotto del canale. Imposta il take-profit a una distanza uguale alla larghezza del canale.

Raccomandazioni per l'Uso con Altri Indicatori:

Per aumentare l'affidabilità dei segnali di "Guida di Tendenza", si raccomanda di utilizzarlo in combinazione con altri indicatori:

  • Medie Mobili (Moving Averages): Utilizza le medie mobili per confermare la direzione del trend principale. Fai trading solo nella direzione del trend confermato sia dalle medie mobili che da "Guida di Tendenza".
  • Oscillatori (RSI, Stocastico): Aiutano a identificare le zone di ipercomprato e ipervenduto, particolarmente utili nel trading dai livelli di supporto/resistenza definiti da "Guida di Tendenza".
  • Indicatori di Volume (Volume Indicators): Un aumento di volume durante una rottura del canale o una continuazione del trend confermata da "Guida di Tendenza" può rafforzare il segnale di trading.
  • Indicatori di Volatilità (ATR, Bande di Bollinger): Aiutano a determinare le dimensioni ottimali di stop-loss e take-profit, tenendo conto della volatilità attuale del mercato.

Utilizzo di "Guida di Tendenza" nel Trading Automatico:

L'indicatore "Guida di Tendenza" può essere integrato con successo nei robot di trading (sistemi di trading algoritmico) per automatizzare il processo di trading:

  1. Definisci chiaramente le condizioni per l'apertura e la chiusura delle posizioni in base al cambio di colore dell'indicatore o alla sua posizione rispetto a livelli definiti (ad esempio, rottura di livello).
  2. Programma il robot di trading in conformità con le regole sviluppate, tenendo conto dei filtri e delle condizioni di conferma di altri indicatori.
  3. Esegui test e ottimizzazioni approfondite del robot su dati storici per identificare i parametri ottimali e valutarne la redditività.
  4. Tieni conto dei rischi associati al trading automatico, come lo slippage e i ritardi nell'esecuzione degli ordini.

"Guida di Tendenza" è il tuo strumento affidabile per navigare nel complesso mondo del trading. Padroneggiando le sue capacità e combinandolo con altri metodi di analisi, potrai aumentare significativamente la tua efficienza di trading e avvicinarti al successo finanziario!


Prodotti consigliati
Pin Bars
Yury Emeliyanov
5 (4)
Scopo principale: "Pin Bars" è progettato per rilevare automaticamente le barre dei pin sui grafici dei mercati finanziari. Una barra pin è una candela con un corpo caratteristico e una lunga coda, che può segnalare un'inversione di tendenza o una correzione. Come funziona: L'indicatore analizza ogni candela sul grafico, determinando la dimensione del corpo, della coda e del naso della candela. Quando viene rilevata una barra pin corrispondente a parametri predefiniti, l'indicatore la segna su
FREE
Extremum Reverse Bar
Yurij Izyumov
2.8 (5)
This indicator has been created for finding the probable reversal points of the symbol price. A small candlestick reversal pattern is used it its operation in conjunction with a filter of extremums. The indicator is not redrawn! If the extremum filter is disabled, the indicator shows all points that have a pattern. If the extremum filter is enabled, the condition works – if the history Previous bars 1 candles back contains higher candles and they are farther than the Previous bars 2 candle, such
FREE
We present you the indicator "Candle closing counter", which will become your indispensable assistant in the world of trading. That’s why knowing when the candle will close can help: If you like to trade using candle patterns, you will know when the candle will be closed. This indicator will allow you to check if a known pattern has formed and if there is a possibility of trading. The indicator will help you to prepare for market opening and market closure. You can set a timer to create a pre
This is a multi-timeframe version of the popular Hull Moving Average (HMA). The Double HMA MTF Light indicator combines two timeframes on a single chart. The HMA of the higher timeframe defines the trend, and the HMA of the current timeframe defines short-term price movements. The indicator is freely distributed and hasn't audio signals or messages. Its main function is the visualization of price movements. If you need advanced functionality of the HMA multi-timeframe indicator (information ab
FREE
A machine translation from the English product description was used. We apologize for possible imprecisions. È stata utilizzata una traduzione automatica dalla descrizione del prodotto in inglese. Ci scusiamo per eventuali imprecisioni. Un sistema di visualizzazione per i modelli di azione dei prezzi dei candelieri preferiti. Una volta collegato, l'indicatore segnerà automaticamente i modelli successivi sul grafico: Pinocchio bar  - un bar piccolo corpo con un lungo "naso", molto noto motivo inv
The indicator shows you buy/sell signals and does not repaint. It works well with almost all pairs, while the best ones are GBPUSD, XAUUSD and EURUSD. The product works better on H1 and H4. You can change the parameters in the inputs tab to get the best signals and the best trade results on each pair. You can enable/disable alerts when signal appears. The indicator is easy to use. Parameters barstrip & Sensitive: amount of bars to process the highest and lowest prices (relates to the internal l
Super Reversal Pattern
Parfait Mujinga Ndalika
Super Reversal Pattern Indicator Unlock the power of advanced pattern recognition with our Super Reversal Pattern Indicator. Designed for traders seeking precision and reliability, this indicator identifies one of the most effective reversal patterns in technical analysis, offering a significant edge in your trading strategy. Key Features: Non-Repainting Accuracy: Enjoy the confidence of non-repainting technology. Once a Super Reversal Pattern is detected, it remains static, providing consiste
Trend PA
Mikhail Nazarenko
5 (3)
The Trend PA indicator uses   Price Action   and its own filtering algorithm to determine the trend. This approach helps to accurately determine entry points and the current trend on any timeframe. The indicator uses its own algorithm for analyzing price changes and Price Action. Which gives you the advantage of recognizing, without delay, a new nascent trend with fewer false positives. Trend filtering conditions can be selected in the settings individually for your trading style. The indicator
Cosmic Diviner X Planet
Olena Kondratenko
4 (2)
This unique multi-currency strategy simultaneously determines the strength of trends and market entry points, visualizing this using histograms on the chart. The indicator is optimally adapted for trading on the timeframes М5, М15, М30, Н1. For the convenience of users, the indicator renders the entry point (in the form of an arrow), recommended take profit levels (TP1, TP2 with text labels) and the recommended Stop Loss level. The take profit levels (TP1, TP2) are automatically calculated for
Signal trend indicator. Detects the direction of the trend and is coloured accordingly.  Has built in audible and visual alerts when trends change. Can send notifications to your phone or email. Allows Trend and Counter-Trend trading. Works on all timeframes, all currency pairs, metals, indices and cryptocurrencies. Can be used with binary options. Distinctive features No re-drawing; Simple and clear settings; Four types of alerts; Works on all timeframes and all trading tools; Suitable
Blahtech Market Profile
Blahtech Limited
4.53 (15)
Was: $249  Now: $99   Market Profile defines a number of day types that can help the trader to determine market behaviour. A key feature is the Value Area, representing the range of price action where 70% of trading took place. Understanding the Value Area can give traders valuable insight into market direction and establish the higher odds trade. It is an excellent addition to any system you may be using. Blahtech Limited presents their Market Profile indicator for the MetaTrader community. Ins
Quantum Balance
Adolfina Denysenko
Quantum Balance is a modern arrow indicator that identifies key price reversal points in the market with high accuracy. It is based on a combination of WPR (Williams %R) and RSI (Relative Strength Index), which allows you to identify overbought/oversold moments and enter trades at points of maximum potential. The indicator analyzes price dynamics and market conditions, generating signals only when several confirming factors coincide. This reduces the number of false signals and increases tradin
Happy Scalping Indicator
Leandro Bernardez Camero
Questo indicatore è stato progettato per uno scalping aggressivo e per entrate rapide nelle opzioni binarie , generando segnali su ogni candela in modo da sapere esattamente cosa sta succedendo in ogni momento. Unisciti al canale Happy Scalping: MQL5 Non ripinta : il segnale della candela attuale viene generato in tempo reale , il che significa che può cambiare mentre la candela è ancora in formazione, a seconda che il prezzo salga o scenda rispetto alla chiusura della candela precedente. Tutt
This indicator monitors the market for a flat state and possible breakout. The flat state is detected as a predefined number of consecutive bars during which price fluctuates inside a small range. If one of the next bars closes outside the range, breakout is signaled. The indicator shows 3 lines: blue - upper bound of flat ranges AND consecutive breakout areas; red - lower bound of flat ranges AND consecutive breakout areas; yellow - center of flat ranges (NOT including breakout areas). When a b
Indicatore Crypto_Forex "Morning Star pattern" per MT4. - L'indicatore "Morning Star pattern" è un indicatore molto potente per il trading Price Action: nessuna rielaborazione, nessun ritardo. - L'indicatore rileva i pattern rialzisti Morning Star sul grafico: segnale freccia blu sul grafico (vedi immagini). - Con avvisi su PC, dispositivi mobili ed e-mail. - È disponibile anche il suo fratello, l'indicatore ribassista "Evening Star pattern" (segui il link qui sotto). - L'indicatore "Morning S
Indicatore Crypto_Forex Pattern PINBAR per MT4, senza ridisegnare, senza ritardi. - L'indicatore "PINBAR Pattern" è un indicatore molto potente per il trading basato sull'azione dei prezzi. - L'indicatore rileva le PinBar sul grafico: - PinBar rialzista - Segnale a freccia blu sul grafico (vedi immagini). - PinBar ribassista - Segnale a freccia rossa sul grafico (vedi immagini). - Con avvisi su PC, dispositivi mobili ed e-mail. - L'indicatore "PINBAR Pattern" è eccellente da combinare con i li
Consolidations
Rofhiwa Bruce Nthulane
5 (1)
What if you could see trouble from far, just imagine having some ability to foresee danger. This indicator has the ability to see consolidations before they are clear to everyone else. In the market everything is always fun until the market starts consolidating and often times by the time people realise it it's often too late. This Indicator will spot consolidations very fast and let you know at the top right of the chart so that you can either avoid losses by stopping to trade using trend follo
Volume Compair
Thiago Pereira Pinho
Professional Cumulative Delta & Volume Median Indicator Track   real buying/selling pressure   with this powerful volume analysis tool. The   Volume Compare Indicator   combines   Cumulative Delta   and   Volume Medians   to help you identify institutional activity, imbalances, and potential reversals. Key Features: Cumulative Delta Histogram   – Visualizes net buying vs. selling volume in real-time. Buy/Sell Volume Medians   – Horizontal lines showing average buy & sell volume levels. Smart Vo
L'indicatore SMC Venom Model BPR è uno strumento professionale per i trader che operano nell'ambito del concetto di Smart Money (SMC). Identifica automaticamente due modelli chiave sul grafico dei prezzi: FVG   (Fair Value Gap) è una combinazione di tre candele, in cui c'è un gap tra la prima e la terza candela. Forma una zona tra livelli in cui non c'è supporto di volume, il che spesso porta a una correzione dei prezzi. BPR   (Balanced Price Range) è una combinazione di due modelli FVG che for
The indicator places Semaphore points on the maximum and minimum of a higher, medium and lower period. It includes A,B,C Triangles for easier spotting of reversal chart pattern which occurs very frequently and has a very high success ratio. Both Semaphore and A,B,C Triangles have Alerts and Push notifications to a mobile device when they occur on the chart. These indicators are very useful for breakout trading and spotting support/resistance levels which gives good opportunities for positions.
Gold Phoenix
Yaroslav Varankin
The perfect tool for Scalng in the Forex markets You can trade both from signal to signal and using take profit  The algorithm does not use Zigzag!  No redrawing!  This is a channel instrument that uses a moving average as a filter. Moving Average  There are 2 parameters for the settings Ma Period = 5 period Moving Average  Channel 1.0 distance of channel lines from the chart Price Signal Filter - calculation of signal opening and filter There is a complete set of Alert There is a multi-timefram
Trend Bilio - an arrow indicator without redrawing shows potential market entry points in the form of arrows of the corresponding color: upward red arrows suggest opening a buy, green down arrows - selling. The entrance is supposed to be at the next bar after the pointer. The arrow indicator Trend Bilio visually "unloads" the price chart and saves time for analysis: no signal - no deal, if an opposite signal appears, then the current deal should be closed. It is Trend Bilio that is considered
The indicator allows you to trade binary options. The recommended time frame is М1 and the expiration time is 1,2,3 minutes. The indicator suitable for auto and manual trading. A possible signal is specified as a arrows above/under a candle. You should wait until the candle closes! Arrows are not re-painted Trade sessions: TOKYO section (Half-end) Currency pairs: USD/JPY Working time frame: M1 Expiration time: 1,2,3 minutes. The indicator also shows good results when using the martingale strateg
FREE
Scalping indicator. It takes into account volatility, price movement in the local interval and the direction of the current trend. Recommended timeframe - M5. Advantages: Low volatility when a signal appears ensures minimal movement against an open position. The indicator does not redraw its signals. There are alert signals. It is a great tool for day trading. Settings: Name Description Period Indicator period Range of each bar in the period (pp.) The maximum size of each candle in the indicato
FREE
Easy Trade indicator
Felipe Carvalho De Queiroz
Easy Trade Indicator – Your Path to Profitable Trades! Work any Time Frame! Maximize your profits with precise and assertive trades! ️ Trade with comfort – the indicator does the analysis and you only open the order in the direction in which the indicator shows you!  Exclusive panel with past trade counter and accuracy tracking! Simplify your analysis, boost your performance, and trade with confidence! Get it now and take your trading to the next level
TMA AI Bands
Monique Ellen Miranda Dos Santos
L'indicatore TMA AI Bands si basa sulla Media Mobile Triangolare (TMA) con bande superiore e inferiore dinamiche e frecce chiare di acquisto/vendita tracciate direttamente sul grafico. Integra un'IA per l'ottimizzazione adattiva e garantisce l'assenza di ridisegno, fornendo segnali precisi di inversione quando il prezzo tocca le bande. * Coppie: funziona con tutte le coppie di valute * Timeframe consigliati: D1 / W1 / MN * Variabili esterne configurabili:   * TimeFrame – periodo di calcolo
Trend Ray
Andriy Sydoruk
The indicator shows the potential trend direction by cyclical-wave dependence. Thus, all the rays of the intersection will be optimal rays, in the direction of which the price is expected to move, taking into account the indicator period. Rays can be used as a direction for potential market movement. But we must not forget that the approach must be comprehensive, the indicator signals require additional information to enter the market.
Renko, Heiken Ashi, Ticks Bar, Range Bar.    Easy switching, easy setup, all in one window.        Place the Custom Chart indicator and view Renko, Heiken Ashi, Tick bar, Range bar charts in real time at real chart.    Position the offline chart window so that the indicator control panel is visible.    Switch the chart mode by click of a button.    Connect to the output chart any indicator, expert advisor without any restrictions.    No, it doesn't work in the tester.    Yes, you can use an
Adjustable Consecutive Fractals  looks for 2 or more fractals in one direction and sends out a on screen alert, sound alert and push notification, for strong reversal points . Adjustable Consecutive Fractals, shows the fractals on chart along with a color changing text for buy and sell signals when one or more fractals appear on one side of price. Adjustable Consecutive Fractals is based Bill Williams Fractals . The standard Bill Williams fractals are set at a non adjustable 5 bars, BUT withe th
This indicator is, without a doubt, the best variation of the Gann Angles among others. It allows traders using Gann methods to automatically calculate the Gann angles for the traded instrument. The scale is automatically calculated when the indicator is attached to the chart. When switching timeframes, the indicator recalculates the scale for the current timeframe. Additionally, you can enter your own scales for the Gann angles. You can enter your own scales either for both vectors or for each
Gli utenti di questo prodotto hanno anche acquistato
Indicatore Miraculous – Strumento Forex e Binario 100% Non-Repaint Basato sul Quadrato di Nove di Gann Questo video presenta l' Indicatore Miraculous , uno strumento di trading altamente accurato e potente, sviluppato specificamente per i trader di Forex e Opzioni Binarie . Ciò che rende unico questo indicatore è la sua base sul leggendario Quadrato di Nove di Gann e sulla Legge della Vibrazione di Gann , rendendolo uno degli strumenti di previsione più precisi disponibili nel trading moderno. L
Gann Made Easy
Oleg Rodin
4.83 (155)
Gann Made Easy è un sistema di trading Forex professionale e facile da usare che si basa sui migliori principi del trading utilizzando la teoria di mr. WD Gann. L'indicatore fornisce segnali ACQUISTA e VENDI accurati, inclusi i livelli di Stop Loss e Take Profit. Puoi fare trading anche in movimento utilizzando le notifiche PUSH. CONTATTATEMI DOPO L'ACQUISTO PER RICEVERE CONSIGLI DI TRADING, BONUS E L'ASSISTENTE EA GANN MADE EASY GRATUITAMENTE! Probabilmente hai già sentito parlare molte volte d
M1 Sniper
Oleg Rodin
5 (18)
M1 SNIPER è un sistema di indicatori di trading facile da usare. Si tratta di un indicatore a freccia progettato per l'intervallo temporale M1. L'indicatore può essere utilizzato come sistema autonomo per lo scalping sull'intervallo temporale M1 e come parte del tuo sistema di trading esistente. Sebbene questo sistema di trading sia stato progettato specificamente per il trading sull'intervallo temporale M1, può comunque essere utilizzato anche con altri intervalli temporali. Inizialmente ho pro
Meravith
Ivan Stefanov
5 (2)
Strumento per market maker. Meravith: Analizzerà tutti i timeframe e mostrerà il trend attualmente in corso. Evidenzierà le zone di liquidità (equilibrio dei volumi) dove i volumi rialzisti e ribassisti sono uguali. Mostrerà tutti i livelli di liquidità dei diversi timeframe direttamente sul grafico. Genererà e presenterà un’analisi di mercato testuale a scopo di riferimento. Calcolerà obiettivi, livelli di supporto e punti di stop-loss in base al trend attuale. Calcolerà il rapporto rischio/ren
RFI levels PRO
Roman Podpora
5 (1)
Indicatore in anticipo   determina i livelli e le zone di inversione del mercato , consente di attendere che il prezzo ritorni al livello ed entrare all'inizio di un nuovo trend, e non alla sua fine. Lui mostra   livelli di inversione   dove il mercato conferma un cambio di direzione e forma un ulteriore movimento. L'indicatore funziona senza ridisegnare, è ottimizzato per qualsiasi strumento e rivela il suo massimo potenziale quando abbinato al   LINEE DI TENDENZA PRO   indicatore. Scanner st
TPSpro RFI Levels
Roman Podpora
4.85 (27)
ISTRUZIONI RUS  /  ISTRUZIONI   ENG  /  Versione MT5 Funzioni principali: Visualizza le zone attive di venditori e acquirenti! L'indicatore mostra tutti i livelli/zone di primo impulso corretti per acquisti e vendite. Quando questi livelli/zone vengono attivati, ovvero dove inizia la ricerca dei punti di ingresso, i livelli cambiano colore e vengono riempiti con colori specifici. Vengono visualizzate anche delle frecce per una percezione più intuitiva della situazione. LOGIC AI - Visualizzazion
PRO Renko System
Oleg Rodin
5 (30)
PRO Renko System è un sistema di trading altamente accurato appositamente progettato per il trading di grafici RENKO. Questo è un sistema universale che può essere applicato a vari strumenti di trading. Il sistema neutralizza efficacemente il cosiddetto rumore di mercato che consente di accedere a segnali di inversione accurati. L'indicatore è molto facile da usare e ha un solo parametro responsabile della generazione del segnale. Puoi facilmente adattare lo strumento a qualsiasi strumento di
Segnale GoldRush Trend Arrow L'indicatore GoldRush Trend Arrow Signal fornisce un'analisi precisa e in tempo reale dei trend, pensata appositamente per gli scalper ad alta velocità e a breve termine nel mercato XAU/USD. Progettato specificamente per il timeframe di 1 minuto, questo strumento mostra frecce direzionali che indicano chiari punti di ingresso, consentendo agli scalper di navigare con sicurezza nelle condizioni di mercato volatili. L'indicatore è composto da frecce di avviso PRIMA
First 25 copies at $80, after that price becomes $149 (3 copies left) Gold Signal Pro is a powerful MT4 indicator designed to help traders spot strong price reactions in the market. It focuses on clear wick rejections , showing when price strongly rejects a level and often continues in the same direction. Gold Signal Pro is mainly built for scalping gold (XAUUSD) and works best on lower timeframes like M5 and M15 , where timing matters most. That said, it can also be used on any forex pair, a
Trend indicator AI
Ramil Minniakhmetov
4.65 (80)
Trend Ai indicator è un ottimo strumento che migliorerà l'analisi di mercato di un trader combinando l'identificazione della tendenza con punti di ingresso utilizzabili e avvisi di inversione. Questo indicatore consente agli utenti di navigare nelle complessità del mercato forex con fiducia e precisione Oltre ai segnali primari, l'indicatore Ai di tendenza identifica i punti di ingresso secondari che si presentano durante i pullback o i ritracciamenti, consentendo ai trader di capitalizzare le
Trend Screener
STE S.S.COMPANY
4.79 (95)
Indicatore di tendenza, soluzione unica rivoluzionaria per il trading di tendenze e il filtraggio con tutte le importanti funzionalità di tendenza integrate in un unico strumento! È un indicatore multi-timeframe e multi-valuta al 100% non ridipingibile che può essere utilizzato su tutti i simboli/strumenti: forex, materie prime, criptovalute, indici e azioni. OFFERTA A TEMPO LIMITATO: l'indicatore di screening di supporto e resistenza è disponibile a soli 50$ e a vita. (Prezzo originale 250$) (o
Trend Lines PRO
Roman Podpora
5 (1)
LINEE DI TENDENZA PRO       Aiuta a capire dove il mercato sta realmente cambiando direzione. L'indicatore mostra reali inversioni di tendenza e punti in cui i principali attori rientrano. Vedi  Linee BOS   Cambiamenti di tendenza e livelli chiave su timeframe più ampi, senza impostazioni complesse o rumore inutile. I segnali non vengono ridisegnati e rimangono sul grafico dopo la chiusura della barra. VERSIONE MT 5     -      Svela il suo massimo potenziale se abbinato all'indicatore   RFI LEVE
Currency Strength Wizard è un indicatore molto potente che ti fornisce una soluzione all-in-one per un trading di successo. L'indicatore calcola la potenza di questa o quella coppia forex utilizzando i dati di tutte le valute su più intervalli di tempo. Questi dati sono rappresentati in una forma di indice di valuta facile da usare e linee elettriche di valuta che puoi utilizzare per vedere il potere di questa o quella valuta. Tutto ciò di cui hai bisogno è collegare l'indicatore al grafico che
Presenting one-of-a-kind Gann Indicator for XAUUSD IQ Gold Gann Levels is a non-repainting, precision tool designed exclusively for XAUUSD/Gold intraday trading. It uses W.D. Gann’s square root method to plot real-time support and resistance levels, helping traders spot high-probability entries with confidence and clarity. William Delbert Gann (W.D. Gann) was an exceptional market analyst whose trading technique was based on a complex blend of mathematics, geometry, astrology, and ancient calcul
ATTUALMENTE SCONTATO DEL 40% La soluzione migliore per ogni principiante o trader esperto! Questo indicatore è uno strumento di trading unico, di alta qualità e conveniente perché abbiamo incorporato una serie di caratteristiche proprietarie e una nuova formula. Con un solo grafico è possibile leggere la forza delle valute per 28 coppie Forex! Immaginate come migliorerà il vostro trading perché sarete in grado di individuare l'esatto punto di innesco di una nuova tendenza o di un'opportunità
Smc Blast Signal
Mohit Dhariwal
5 (3)
Full Fledged EA and Alert plus for alerts will also be provided in this offer along with the purchase of Indicator. Limited copies only at this price and Ea too. Grab your copy soon Alert plus for indicator with set file is kept in comment section with the image  SMC Blast Signal with FVG, BOS and trend Breakout The SMC Blast Signal is a Precise trading system for Meta Trader 4 that uses Smart Money Concepts (SMC), including Fair Value Gaps (FVG) and Break of Structure (BOS), to identify high-pr
Pulse Scalping Line - an indicator for identifying potential pivot points. Based on this indicator, you can build an effective Martingale system. According to our statistics, the indicator gives a maximum of 4 erroneous pivot points in a series. On average, these are 2 pivot points. That is, the indicator shows a reversal, it is erroneous. This means that the second signal of the indicator will be highly accurate. Based on this information, you can build a trading system based on the Martingale
Pip Storm Signal
Camila Bernardez Camero
Segnale PIP STORM PIP STORM è un sistema avanzato basato su frecce, progettato per un'esecuzione ultra-frequente durante le fasi di alta volatilità del mercato. Il suo obiettivo principale è mantenere un flusso costante di segnali di scalping utilizzabili, senza fare affidamento su indicatori ritardati o abusati. Non predice — reagisce con precisione alle zone di transizione del prezzo, catturando micro-rotture e squilibri di liquidità con un motore di conferma minimalista in tempo reale. Rim
Volatility Trend System - un sistema di trading che fornisce segnali per le voci. Il sistema di volatilità fornisce segnali lineari e puntuali nella direzione del trend, nonché segnali per uscirne, senza ridisegnare e ritardi. L'indicatore di tendenza monitora la direzione della tendenza a medio termine, mostra la direzione e il suo cambiamento. L'indicatore di segnale si basa sui cambiamenti della volatilità e mostra gli ingressi nel mercato. L'indicatore è dotato di diversi tipi di avvisi. Pu
Questo cruscotto mostra gli ultimi pattern armonici disponibili per i simboli selezionati, in modo da risparmiare tempo ed essere più efficienti / versione MT5 . Indicatore gratuito: Basic Harmonic Pattern Colonne dell'indicatore Symbol : vengono visualizzati i simboli selezionati Trend: rialzista o ribassista Pattern: tipo di pattern (gartley, butterfly, bat, crab, shark, cypher o ABCD) Entry: prezzo di ingresso SL: prezzo di stop loss TP1: 1 prezzo di take profit TP2: 2 prezzo di take pr
- Real price is 200$ - 50% Discount (It is 99$ now) -   It is enabled for 3 purchases. Contact me for extra bonus (Gann Trend   indicator), instruction or any questions! - Non-repaint, No lag - I just sell my products in Elif Kaya Profile, any other websites are stolen old versions, So no any new updates or support. - Lifetime update free Gann Gold EA MT5 Introduction W.D. Gann’s theories in technical analysis have fascinated traders for decades. It offers a unique approach beyond traditional c
Attualmente 40% di sconto! La soluzione migliore per ogni principiante o trader esperto! Questo software per cruscotti funziona su 28 coppie di valute. Si basa su 2 dei nostri indicatori principali (Advanced Currency Strength 28 e Advanced Currency Impulse). Offre un'ottima panoramica dell'intero mercato Forex. Mostra i valori di forza delle valute avanzate, la velocità di movimento delle valute e i segnali per 28 coppie Forex in tutti i (9) timeframe. Immaginate come migliorerà il vostro tra
Scalper Inside PRO
Alexey Minkov
4.74 (69)
* VALENTINE’S DAY 20% SALE * LIMITED TIME OFFER * An exclusive indicator that utilizes an innovative algorithm to swiftly and accurately determine the market trend. The indicator automatically calculates opening, closing, and profit levels, providing detailed trading statistics. With these features, you can choose the most appropriate trading instrument for the current market conditions. Additionally, you can easily integrate your own arrow indicators into Scalper Inside Pro to quickly evaluate
Advanced Arrow
Alfred Kamal
3.9 (39)
This indicator depends on some secrets equations to draw Signals with Stop loss and maximum 4 Take profits. There is a free EA depends on this indicator as a gift when you purchase/rent it. Features Simply it gives you entry point as Ready sign (Buy / Sell) and arrow (Buy / Sell) after candle closed, also SL line and 4 TP lines or less. Once SL-TP lines are shown with the arrow, they remains as they are until signal change. It is historical indicator. No Repaint. user manual for V5 please click
MetaForecast M4
Vahidreza Heidar Gholami
5 (2)
MetaForecast predice e visualizza il futuro di qualsiasi mercato basandosi sull'armonia dei dati dei prezzi. Sebbene il mercato non sia sempre prevedibile, se esiste un modello nei prezzi, MetaForecast può prevedere il futuro con la massima precisione possibile. Rispetto ad altri prodotti simili, MetaForecast può generare risultati più accurati analizzando le tendenze di mercato. Parametri di input Past size (Dimensione passata) Specifica il numero di barre che MetaForecast utilizza per creare
FX Power MT4 NG
Daniel Stein
4.95 (21)
FX Power: Analizza la Forza delle Valute per Decisioni di Trading Più Intelligenti Panoramica FX Power è lo strumento essenziale per comprendere la reale forza delle principali valute e dell'oro in qualsiasi condizione di mercato. Identificando le valute forti da comprare e quelle deboli da vendere, FX Power semplifica le decisioni di trading e rivela opportunità ad alta probabilità. Che tu segua le tendenze o anticipi inversioni utilizzando valori estremi di Delta, questo strumento si adatta
Weis Wave with Alert
Trade The Volume Waves Single Member P.C.
4.82 (22)
Rental/Lifetime Package Options and Privileges' Rent Monthly Six Months   Yearly/Lifetime Weis Wave with Speed with Alert+Speed Index x x x Manual  x x x Quick Set up Video x x x Blog x x x Lifetime Updates x x x Setup and Training Material x x Rectangle Break Alert Tool      x Discord Access Channel "The SI traders" x   How to trade info visit:    http://www.tradethevolumewaves.com   ** If you purchase please contact me to setup your  : training Room and  complete manual access.  This is
Beast Super Signal
Dustin Vlok
4.73 (89)
Alla ricerca di un potente indicatore di trading forex che possa aiutarti a identificare facilmente opportunità di trading redditizie? Non guardare oltre il Super Segnale Bestia. Questo indicatore basato sulle tendenze di facile utilizzo monitora continuamente le condizioni del mercato, cercando nuove tendenze in via di sviluppo o saltando su quelle esistenti. Il Beast Super Signal fornisce un segnale di acquisto o di vendita quando tutte le strategie interne sono allineate e sono al 100% in con
FX Volume
Daniel Stein
4.63 (38)
FX Volume: Scopri il Vero Sentimento di Mercato dalla Prospettiva di un Broker Panoramica Rapida Vuoi portare la tua strategia di trading a un livello superiore? FX Volume ti offre informazioni in tempo reale su come i trader retail e i broker sono posizionati—molto prima che compaiano report in ritardo come il COT. Che tu miri a guadagni costanti o desideri semplicemente un vantaggio più solido sui mercati, FX Volume ti aiuta a individuare grandi squilibri, confermare i breakout e perfezionar
Se acquisti questo indicatore, riceverai il mio Trade Manager Professionale   + EA  GRATUITAMENTE. Innanzitutto è importante sottolineare che questo sistema di trading è un indicatore Non-Repainting, Non-Redrawing e Non-Lagging, il che lo rende ideale sia per il trading manuale che per quello automatico. Corso online, manuale e download di preset. Il "Sistema di Trading Smart Trend MT5" è una soluzione completa pensata sia per i trader principianti che per quelli esperti. Combina oltre 10 indic
Altri dall’autore
Line Profit
Iurii Tokman
5 (3)
Line Profit   Indicator of the visual line of profit in the deposit currency. Works only if there are open positions in the market for the symbol on which the indicator is installed. You can move the line with the mouse or enable automatic tracking of the Bid price. Description of indicator settings: colotLine - line color WidthLine - line width colotText - text color FontSize - the height of the text Anchor - an anchor method for text FollowBid - follow the Bid price
FREE
Crazy Scalper
Iurii Tokman
3.5 (4)
The Crazy Scalper trading robot does not use any indicators. It utilizes a scalping system, which trades in two directions simultaneously (buys and sells). Two opposite positions cannot bring profit at the same time, one of them will be losing. If there is a losing position, a lock is used. If the locking position fails and price reverses to the opposite, teh robot moves it to breakeven using the averaging system and pending orders. Settings TakeProfit = 3; - the take profit in points; Lock_Lev
ChannelRSI5
Iurii Tokman
5 (5)
ChannelRSI5   The Relative Strength Index (RSI) indicator with dynamic levels of overbought and oversold zones. Dynamic levels change and adjust to the current changes in the indicator and prices, and represent a kind of channel. Indicator settings period_RSI - Averaging period for calculating the RSI index. applied_RSI - The applied price. It can be any of the price constants: PRICE_CLOSE - Closing price, PRICE_OPEN - Opening price, PRICE_HIGH - Maximum price for the period, PRICE_LOW - Minimum
FREE
StopLevel
Iurii Tokman
StopLevel   The meter controls the STOPLEVEL level. When the level changes, it signals with an alert. STOPLEVEL - the   minimum offset in points from the current closing price for placing Stop orders, or the minimum allowable stop loss / take profit level in points. A zero value of STOPLEVEL means either the absence of a restriction on the minimum distance for stop loss / take profit, or the fact that the trading server uses external mechanisms for dynamic level control that cannot be transmitte
FREE
Bar Boss
Iurii Tokman
5 (1)
The Expert Advisor uses the FletBoxPush indicator for market analysis and for determining trading signals. The indicator is built into the Expert Advisor, there is no need to additionally run it on a chart. The EA trades breakouts of certain levels determined as flat borders. The EA uses Stop Loss. Description of EA Parameters TimeFrames chart period required for the indicator colour - the color of the price zone defined as flat, a setting for the indicator Rectangle - show price zones defined
MovingInWL
Iurii Tokman
MovingInWL   The Expert Advisor is designed to move the stop of open positions to no loss when they reach a certain predetermined profit level. Description of the advisor settings: MagicNumber - order identifier LevelProfit - The level of profit in points that the position must reach in order for its stop to be moved to the level without loss. LevelWLoss - The level without loss in points, to which the stop position will be transferred after its profit reaches the   LevelProfit   level in points
FREE
Indicatore Ombre: Svela il Potere Nascosto di Ogni Candela! Sei stanco di un'analisi superficiale dell'azione dei prezzi? Desideri una comprensione più profonda della forza di acquirenti e venditori in ogni intervallo temporale? Ti presentiamo l' Indicatore Ombre – il tuo strumento indispensabile per visualizzare e analizzare le dinamiche nascoste del mercato! Questo potente indicatore trasforma la battaglia invisibile tra tori e orsi, riflessa nella dimensione delle ombre delle candele, in un i
FREE
Comb
Iurii Tokman
The indicator displays a grid in the form of a "honeycomb" or regular hexagon. An alternative to the standard grid of the terminal. Description of the indicator settings: color_comb - grid color width - width, for example: 22 for a screen resolution of 1920*1080, 15 for a screen resolution of 1366*768, etc. height - height, for example: 6 for a screen resolution of 1920*1080, 4 for a screen resolution of 1366*768, etc.
FREE
Robo T
Iurii Tokman
Robo T Expert Advisor is a non-indicator trading system. Expert Advisor settings: Level_ord - distance from the current price for placing initial pending Buy Stop and Sell Stop orders, the default value is 22. Lot_1 - initial lot for buy series, the default value is 0.1. Lot_2 - initial lot for sell series, the default value is 0.1. TakeProfit - profit level, the default value is 30. TSProfitOnly - only profit is trailed. If disabled, trailing is also performed in the negative stop-loss area. Th
Hammering
Iurii Tokman
Hammering is an automated trading system which works on any currency pair. Multi-currency and single-currency trading is performed. Making decisions the EA uses signals of the Slope Direction Line indicator. Settings. Profit_Percent_AccountEquity = 0.4; - profit as percentage of free margin Fix_AccountEquity = 0; - fixed level of free margin FIX_PROFIT = 1000; - fixed level of profit period = 55; - indicator period. FilterNumber = 2; - indicator filter. ma_method = 3; - indicator averaging metho
Robo Grid FX
Iurii Tokman
ROBO GRID FX is a grid Expert Advisor. It is developed for intraday trading in the active market and on fast currency pairs. This is a grid EA with a closed-loop averaging system. The closed-loop averaging system represents a stable strategy of moving to breakeven in case of the deposit drawdown on fast and aggressive currency pairs. The EA places a grid of pending orders in both directions and locks it on the breakthrough of a quote fluctuation in the channel of 40-60 points in case of an unrpo
Pyramid MA
Iurii Tokman
5 (1)
Pyramid MA - Characteristics of the EA: uses Moving Averages (MA) indicator. Changes order grid when a trend reverses. Exponent of order volume increase by the main trading grid against averaging positions. Works on pending BUYSTOP and SELLSTOP orders. Uses a system of averaging losses which controls a balance of open trades and moves it to breakeven. Sound alert about open and completed trades. You can easily create your own trading strategy on the basis of PYRAMID MA. Expert Advisor settings:
Boom
Iurii Tokman
The Expert Advisor is based on the indicator analysis. Trading decisions are made using Moving Average values. Indicators can be configured by external variables: TF = 0 - select a working timeframe. It can be one of the chart periods. 0 means the current chart period. 1 - 1 minute. 5 - 5 minutes. 15 - 15 minutes. 30 - 30 minutes. 60 - 1 hour. 240 - 4 hours. 1440 - 1 day. 10 080 - 1 week. 43 200 - 1 month. shift = 0 - index of obtained value from the indicator buffer (shifting back by specified
Forex Jumper
Iurii Tokman
1 (1)
Forex Jumper is an Expert Advisor for trading EURJPY. Candlestick pattern analysis is used for generating trading signals. The EA uses BUYSTOP and SELLSTOP pending orders. Settings: Lot = 0 - manual setup of the opened orders' volume Risk = 13 - MM risk percentage, the parameter works if Lot = 0 MagicNumber = 208 - ID of EA orders and positions, magic number TP = 20 - virtual profit level in points if there is a single unidirectional open position on the market TP2 = 20 - virtual profit level in
Bands Jazz
Iurii Tokman
Bands Jazz EA is based on the analysis of the Bollinger Bands indicator. The EA algorithm is simple - it uses Stop Loss, Take Profit and Trailing Stop. Settings TimeBeginHour —trading start hour. Values 0 to 24. TimeBeginMinute —trading start minute. Values 0 to 60. TimeEndHour —trading end hour. Values 0 to 24. TimeEndMinute —trading end minute. Values 0 to 60. period —averaging period for Bollinger Bands calculations. deviation —number of standard deviations from the main line for Bollinger B
Smart YTG
Iurii Tokman
4.6 (5)
Smart YTG has been developed for trading GBPUSD on the H1 chart. This is a trend following system and works well during trending price behavior using STOP orders. It detects trend by analyzing the Price Channel indicator which is built straight into the Expert Advisor, therefore you do not need to additionally install any indicator. On the flat areas where the market is undecided, and further movement of the market is being determined, a breakeven function is activated, and if there are open pos
Eureka Lock
Iurii Tokman
The Eureka Lock Expert Advisor detects flat price movement intervals relative to the specified settings. Trading is performed by BUY STOP and SELL STOP pending orders from the borders of the defined flat. Instead of limiting the losses, a loss-making position is locked by an increased volume. A virtual profit level is used as well. Settings: TF_flet = 15 - timeframe a flat is detected at Bars_flet = 25 - amount of bars for a flat detection extern int Size_flet = 30 - distance limit between the
The product shows general information in a single chart window. It is convenient when you trade many symbols simultaneously. The indicator shows the total number of positions and pending orders. The following info is displayed for opened positions: symbol, amount of opened buy orders for this symbol and their total profit in deposit currency, amount of opened sell orders and their total profit, total profit of opened buy and sell orders. The following info is displayed for pending orders: symbol
Moving Average. Calculation method: average value of all prices used for determining a bar. Description of External Settings of the EA: MA_period - period of averaging for calculation of the indicator. Recommended values: 5, 13, 21, 34. ma_method - averaging method. It can have any values ​​of the Moving Average method (Moving Average). 0 - (SMA) Simple Moving Average. 1 - (EMA) Exponential Moving Average. SMMA 2 - (SMMA) Smoothed Moving Average. LWMA 3 - (LWMA) Linear weighed Moving Average.
Description of the Settings: MA_period_fast - The period of averaging for calculation of fast Moving Average. MA_period_slow - The period of averaging for calculation of slow Moving Average. price - price used. It can be any of the price constants. 0 - (CLOSE) Close price. 1 - (OPEN) Open price. 2 - (HIGH) The maximum price. 3 - (LOW) The minimum price. 4 - (MEDIAN) The average price, (high+low)/2. 5 - (TYPICAL) Typical price, (high+low+close)/3. 6 - (WEIGHTED) Weighed close price, (high+low+clo
The Piramida Grid EA analyzes the values of the Slope Direction Line indicator for determining position entry. The grid of orders changes once the market reverses. Works on pending BUYSTOP and SELLSTOP orders. Uses a system of averaging losses which controls a balance of open trades and moves it to breakeven. Automatic detection of 4 and 5 decimal places. Expert Advisor Setup: period = 32; - period for the Slope Direction Line indicator FilterNumber = 2; - Slope Direction Line filter setup ma_m
The Martin Pristine trading robot analyzes the signals of the Price Channel Central indicator for trading decisions. No need to additionally attach the indicator to a chart, it's built into the Expert Advisor. After each losing trade, the lot is multiplied by 2. This Expert Advisor can detect 4 and 5-digit quotes automatically. Only one position can be open in the market at the same time. Expert Advisor settings: TF = 15; - select the chart timeframe for Price Channel Central Bars_Count = 100;
The Future Price indicator shows the probable variants of a future price movement based on the searching for matches in the quotes history. The indicator works in two modes: the first iterates over and displays the specified number of variants, the second - the indicator displays one specified variant. Settings Static_VARIANTS = 0; - display a specific variant; if = 0, iterates over all variants TOTAL_VARIANTS = 20; - the number of variants in the set, not greater than 30 is recommended Time_Se
Reanimator
Iurii Tokman
This is a semi-automatic trading robot. Buttons are used to open/close positions. Further position tracking is performed automatically by virtual profit level. Loss-making positions are averaged by increased/decreased lots. The buttons do not work in the strategy tester meaning that you can check the EA only on demo and real accounts. Special settings OPEN_BUY and OPEN_SELL can be used to test the EA in the strategy tester. Settings MagicNumber - identifier of the EA's orders. The robot works o
The indicator determines flat areas of the price movement according to the specified parameters. Settings: FletPips - limit in points for determining the flat FletBars - limit in number of bars for determining the flat CountBars - number of bars in history for the analysis of price movement. 0 - all bars in history are analyzed colir - color of the price section determined as flat Dop - additional drawing of price labels Alerts - display a dialog box with custom data Text - custom text for notif
BarKhan
Iurii Tokman
The BarKhan indicator is calculated as sum of differences of three digital moving averages. The calculation formula is as follows: the difference of digital moving averages 1 and 2 is added to the difference of digital moving averages 2 and 3 Description of the indicator settings: MA_Period1 - the period of the first digital moving average MA_Period2 - the period of the second digital moving average MA_Period3 - the period of the third digital moving average
Octet
Iurii Tokman
Multi-currency indicator, analyzes 56 currency pairs simultaneously. It is important that all currency pairs are selected in the market watch with their history data downloaded. The indicator shows a rise or fall of a certain currency against the other 7 currencies as a total in the form of a line. The indicator values are expressed as a percentage. Description of the indicator settings Type_Calculation - three options for calculating the percentage of the currency rise or fall Prefix - used wh
Multi-currency indicator, analyzes 56 currency pairs simultaneously: AUD EUR GBP NZD CAD CHF JPY USD AUD SUMM EURAUD GBPAUD AUDNZD AUDCAD AUDCHF AUDJPY AUDUSD EUR EURAUD SUMM EURGBP EURNZD EURCAD EURCHF EURJPY EURUSD GBP GBPAUD EURGBP SUMM GBPNZD GBPCAD GBPCHF GBPJPY GBPUSD NZD AUDNZD EURNZD GBPNZD SUMM NZDCAD NZDCHF NZDJPY NZDUSD CAD AUDCAD EURCAD GBPCAD NZDCAD SUMM CADCHF CADJPY USDCAD CHF AUDCHF EURCHF GBPCHF NZDCHF CADCHF SUMM CHFJPY USDCHF JPY AUDJPY EURJPY GBPJPY NZDJPY CADJPY CHFJPY SUMM
Firm
Iurii Tokman
The Expert Advisor does not use indicator, it is always in the market. The logic of the EA is based on the analysis of the previously opened orders present in the market. Expert Advisor settings: StopLoss_Percent - loss level in percent TakeProfit - profit level in points Risk - setting for automatic calculation of order volumes for the EA, works if LOT =0 LOT - fixed volume of orders Slippage - maximum allowed price slippage MagicNumber - magic number for EA's orders Show_Information - enable o
Grid Flat
Iurii Tokman
The Expert Advisor places a grid of orders with the specified step. Orders have the take profit level set at the distance of grid step, as well as the total stop loss level for all order of the same type. Trading is performed only within the time interval specified in the settings. Once the time ends, all pending orders are deleted and all open positions are force-closed. It is not recommended to use the EA as a fully automated trading system for continuous trading, only for working in certain m
Filtro:
Nessuna recensione
Rispondi alla recensione