The Bid price Above Below EMA

EMA Above Below Bid price

Технический индикатор в помощь трейдеру. Данный индикатор, показывает расположение пяти ЕМА,
 пяти средних скользящих, относительно цены формирующей японские свечи или бары (цена
Bid).


О понятии ЕМА.

Скользящая средняя (moving average, MA) — это дополнительная линия на графике цены актива.
 Внешне она повторяет график цены, но с небольшим запозданием и более гладко, без колебаний.

Основные характеристики:

1.    Показывает тренды. Если скользящая устремлена вверх и цена выше МА — тренд восходящий.
Если скользящая направлена вниз и цена располагается ниже ее линии — тренд нисходящий.

2.    Чем длиннее МА, тем сильнее тренд. Самой сильной мною считается 777-дневная МА.

3.    Мувинг часто выступает Динамическим уровнем поддержки и сопротивления: цена возвращается
к скользящей, бьётся об неё и отскакивает.

4.    Пересечения двух и более МА с разными периодами могут говорить о смене тренда.

5.    Хорошо работает во время ярко выраженного тренда и даёт много ложных сигналов в боковике.


Виды МА в трейдинге. 
Виды скользящих средних (мувингов) можно условно разделить по построению на:

·  SMA – Simple MA. Каждый член ряда обладает равным весом, это простой расчет среднего значения на определенной дистанции.

·  ЕМА – Exponential MA. Значимость свечей, на которых рассчитывается ЕМА, меняется по экспоненте.
          Наибольший вес назначается недавним ценам.

·  Smoothed MA – сглаженный мувинг. Особенность этого подвида – учет свечей, выходящих за пределы промежутка, на котором
                         рассчитывается значение индикатора.

·  LWMA – Linear Weighted МА. В линейно-взвешенном подвиде используется тот же принцип работы, что и в ЕМА, но методика
             распределения значимости свечей иная. Их вес меняется в соответствии с арифметической прогрессией.


Что значит bid на бирже?

Bid; предлагаемая цена) — цена спроса, наивысшая цена покупателя, по которой он согласен купить валюту, ценные бумаги и т. п. активы.
В биржевой практике ценой бид на текущий момент обычно считают наивысшую цену, по которой есть ожидающая удовлетворения заявка
на покупку, по которой любой желающий может продать свои активы.

Бид (англ. Bid; предлагаемая цена) — цена спроса, наивысшая цена покупателя, по которой он согласен купить валюту,
ценные бумаги и т. п. активы. В биржевой практике ценой бид на текущий момент обычно считают наивысшую цену,
по которой есть ожидающая удовлетворения заявка на покупку, по которой любой желающий может продать свои активы.
Биду противостоит аск — цена предложения. Разницу между ними называют спред.


Примечание. Метод торговли с помощью Индикатора квадратов ЕМА 

Данный индикатор, очень хороший помощник, для тех трейдеров которые в своей торговли используют средние скользящие.
Разных периодов.

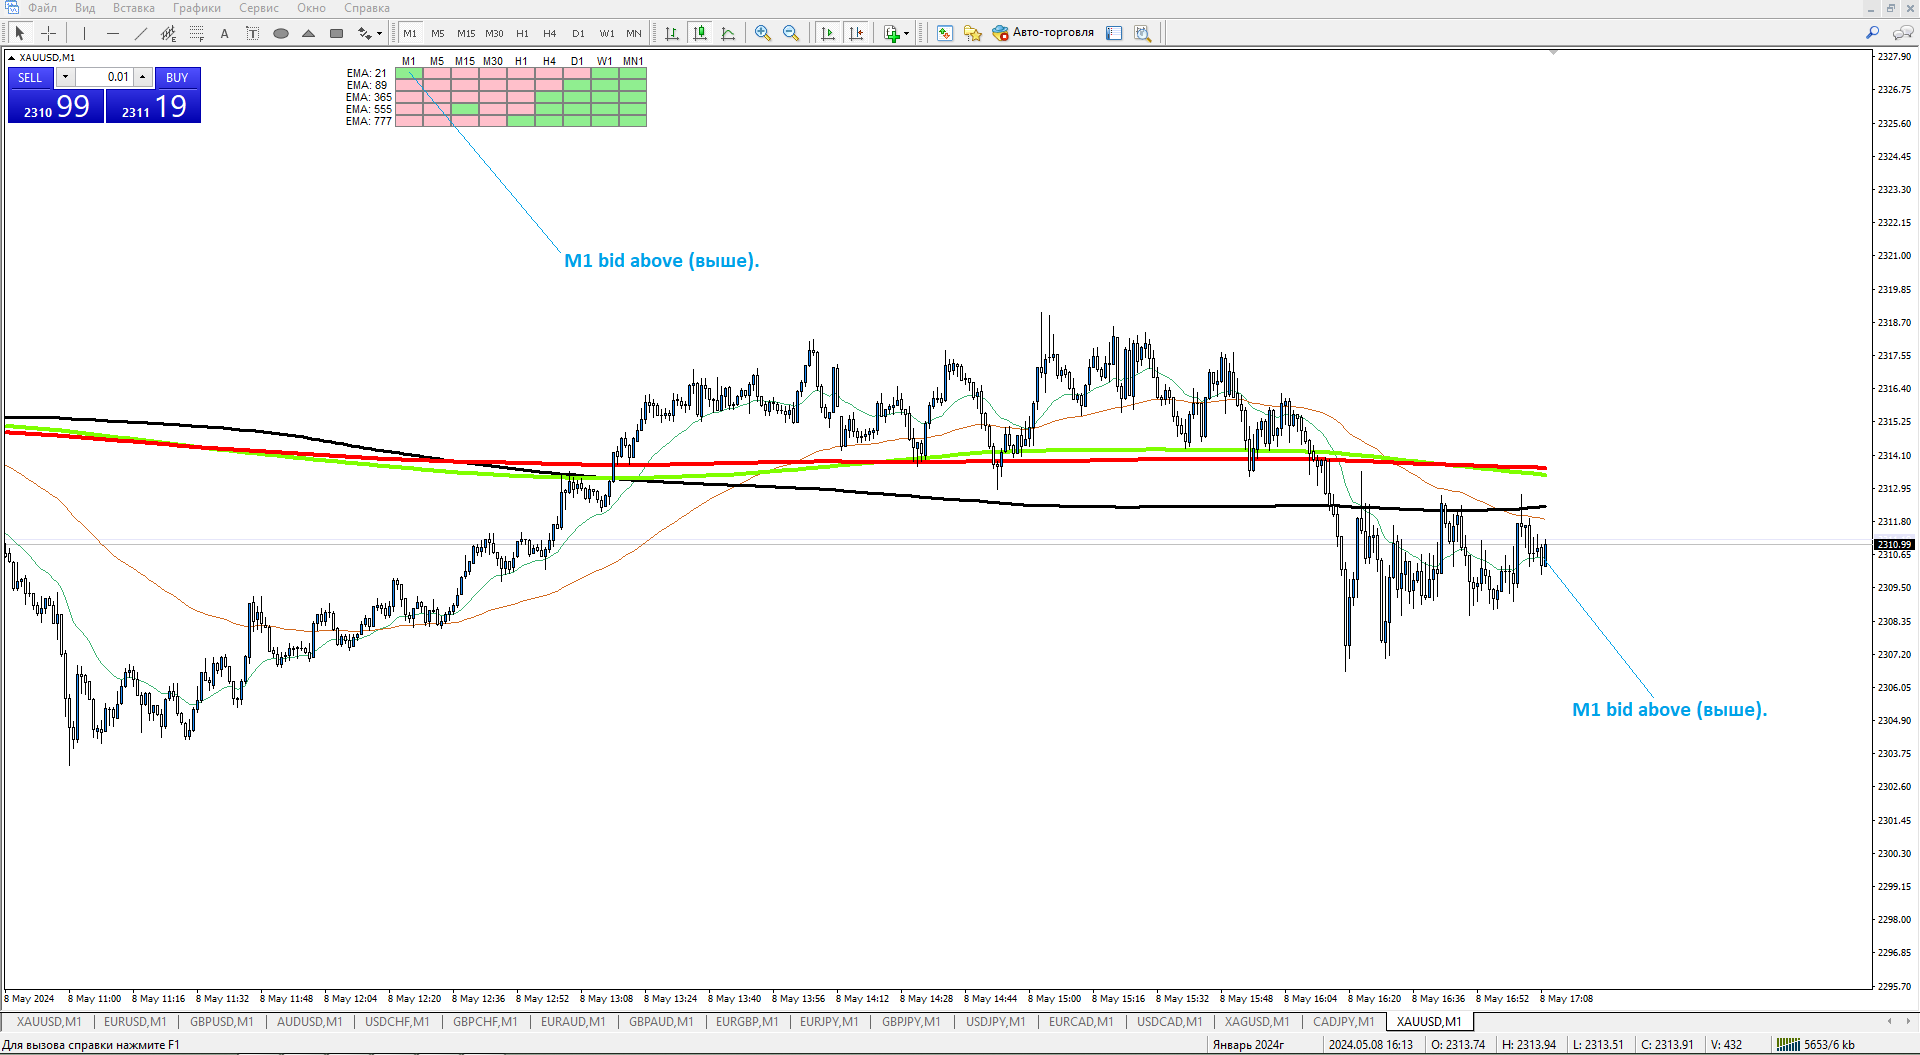
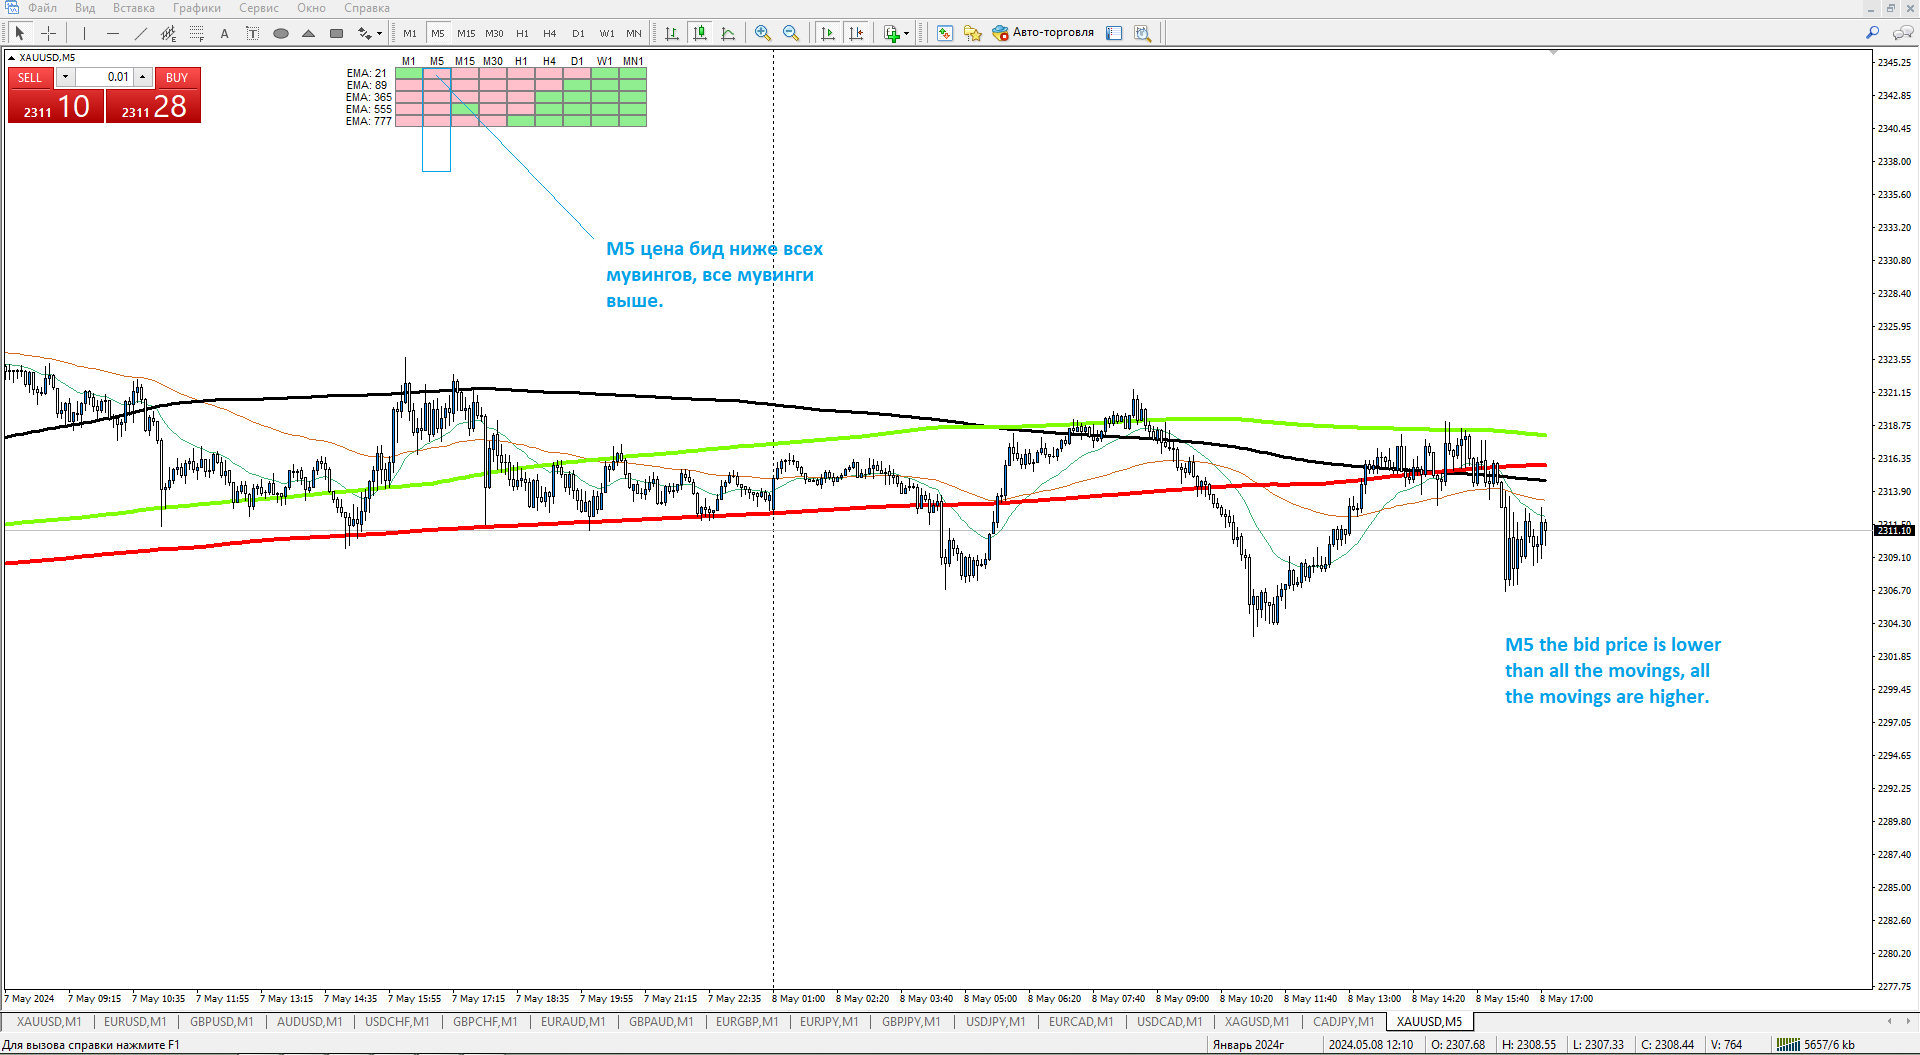
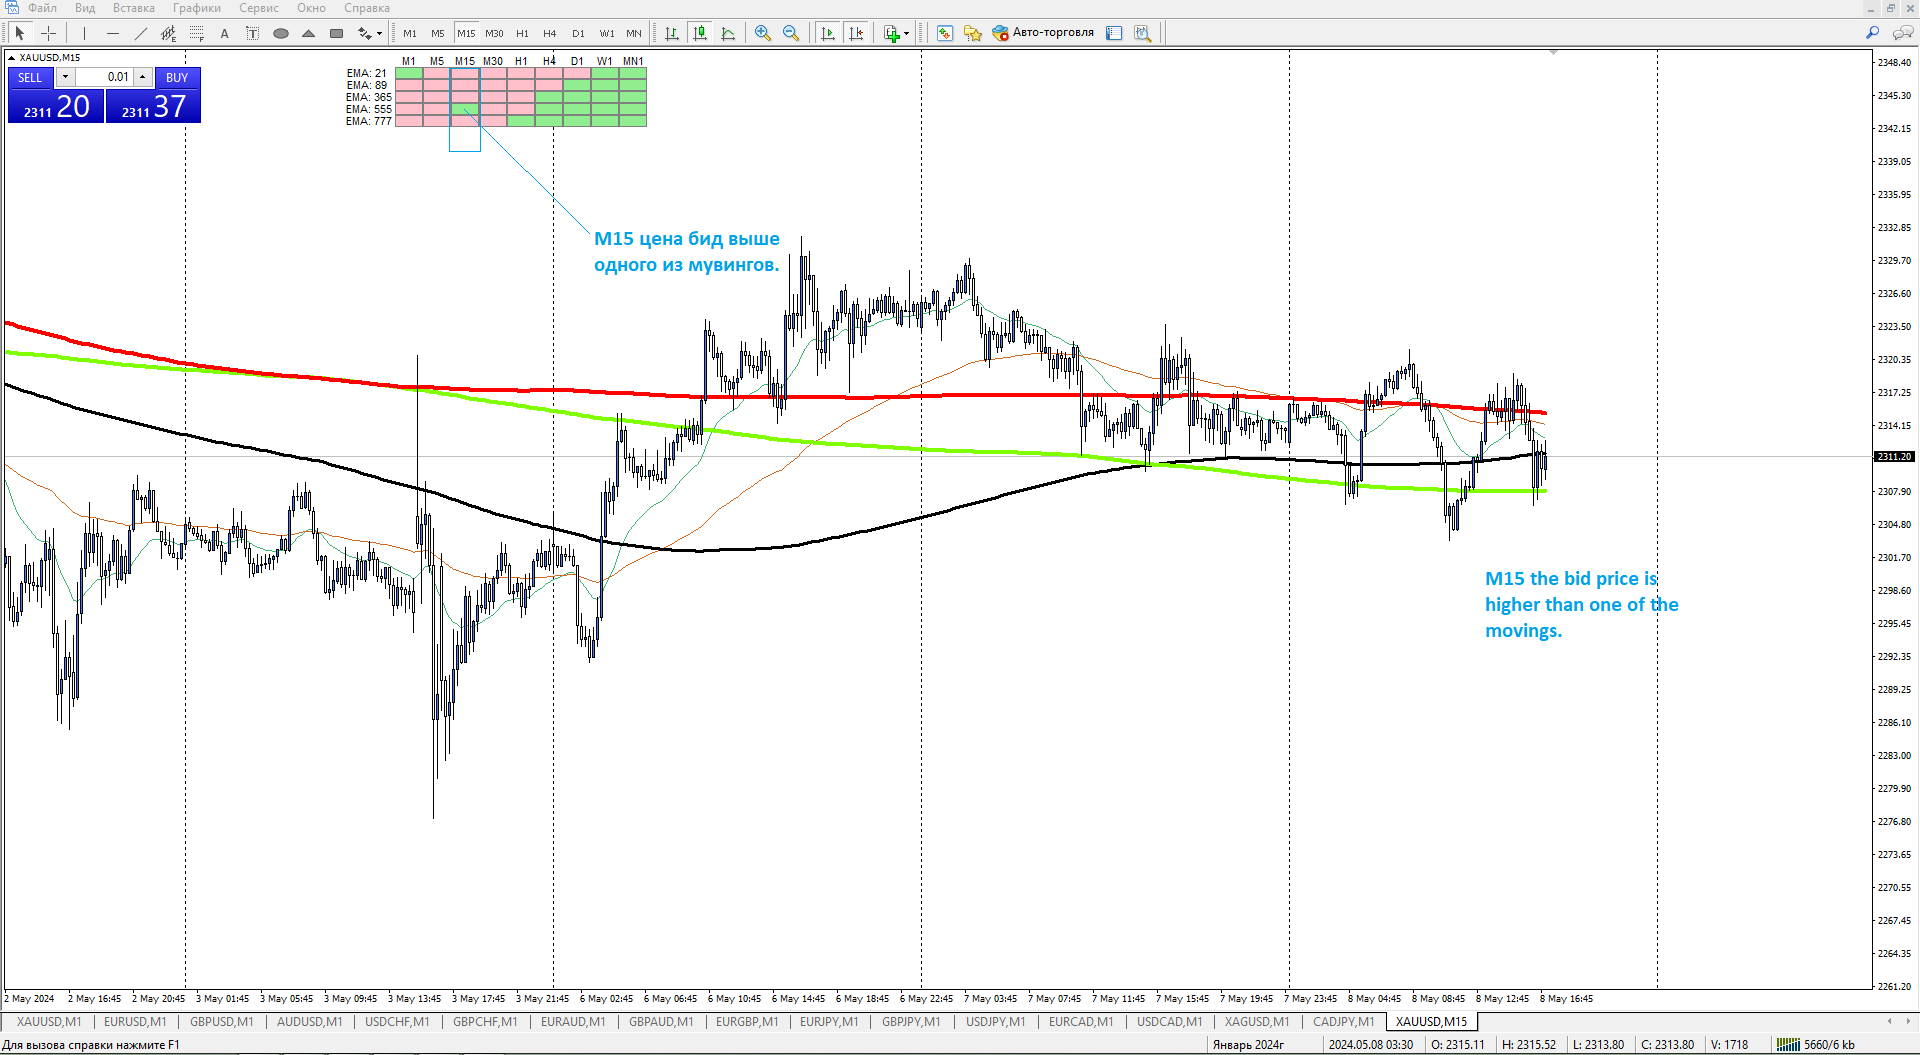
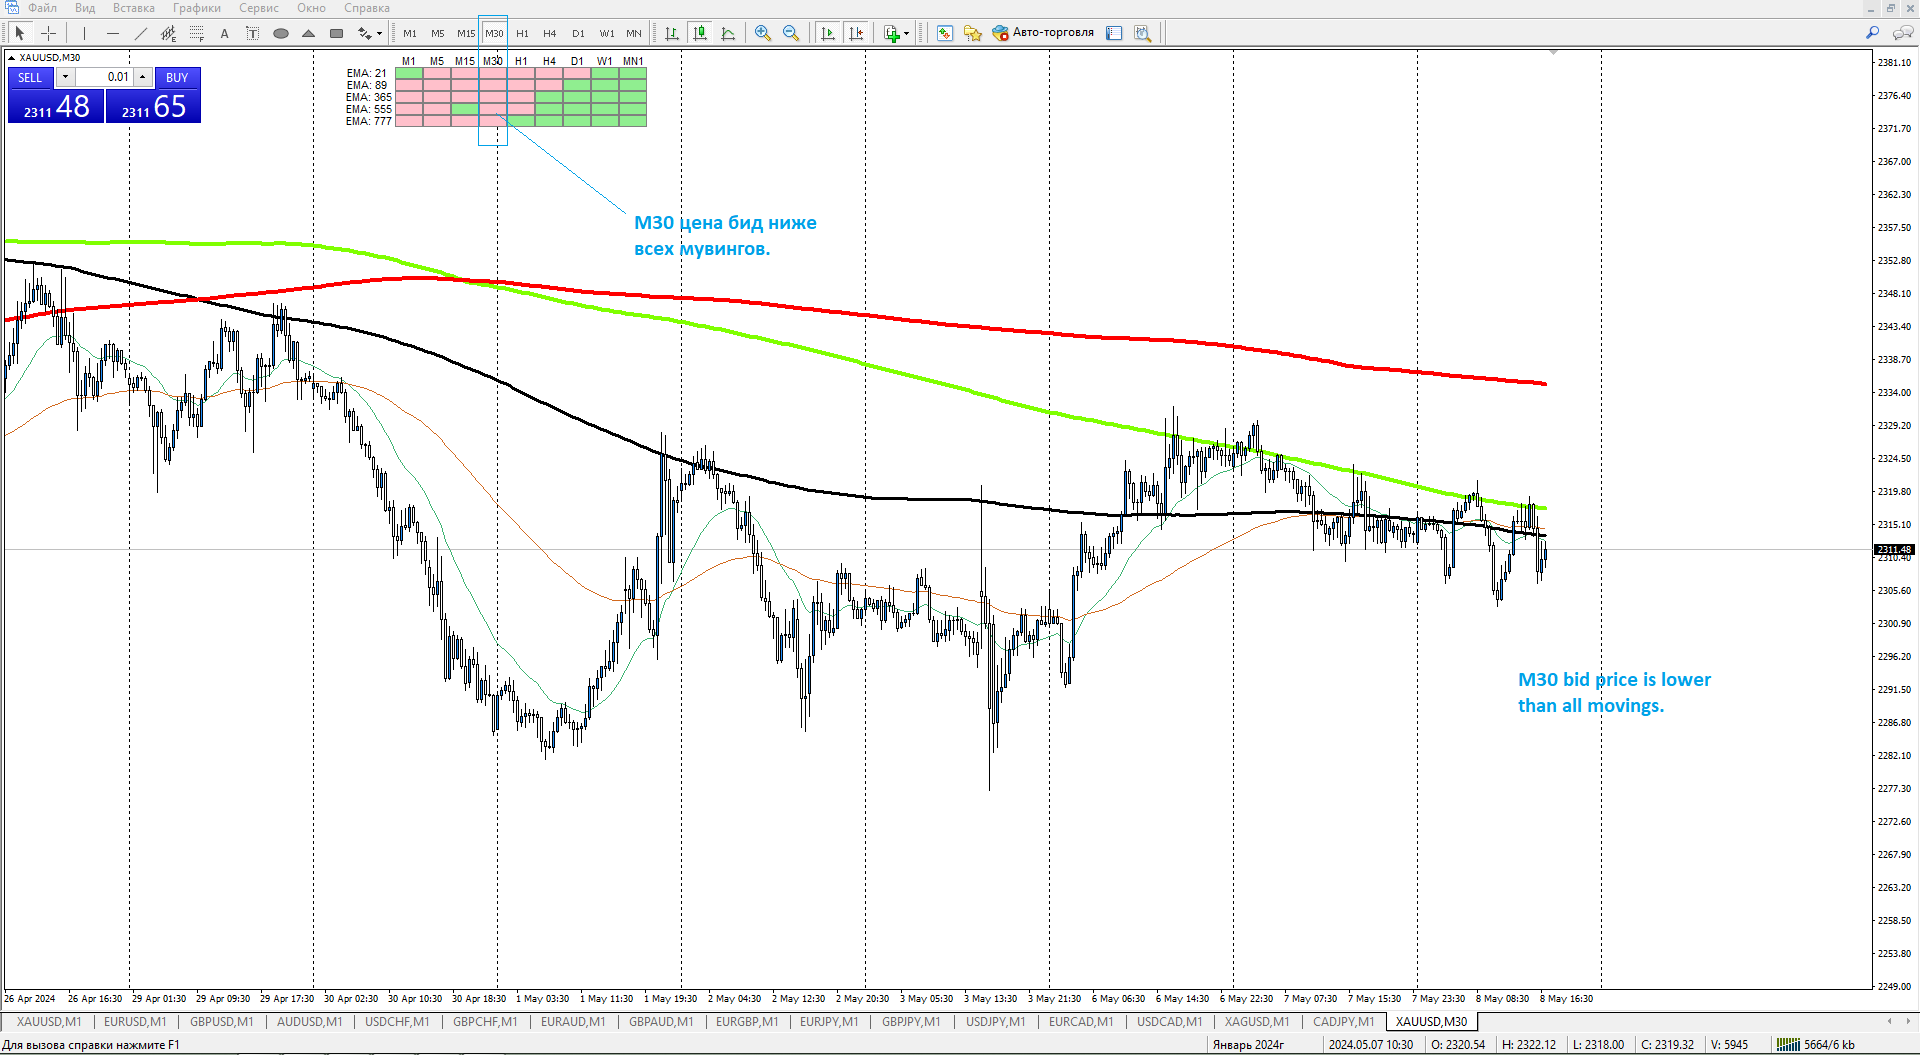
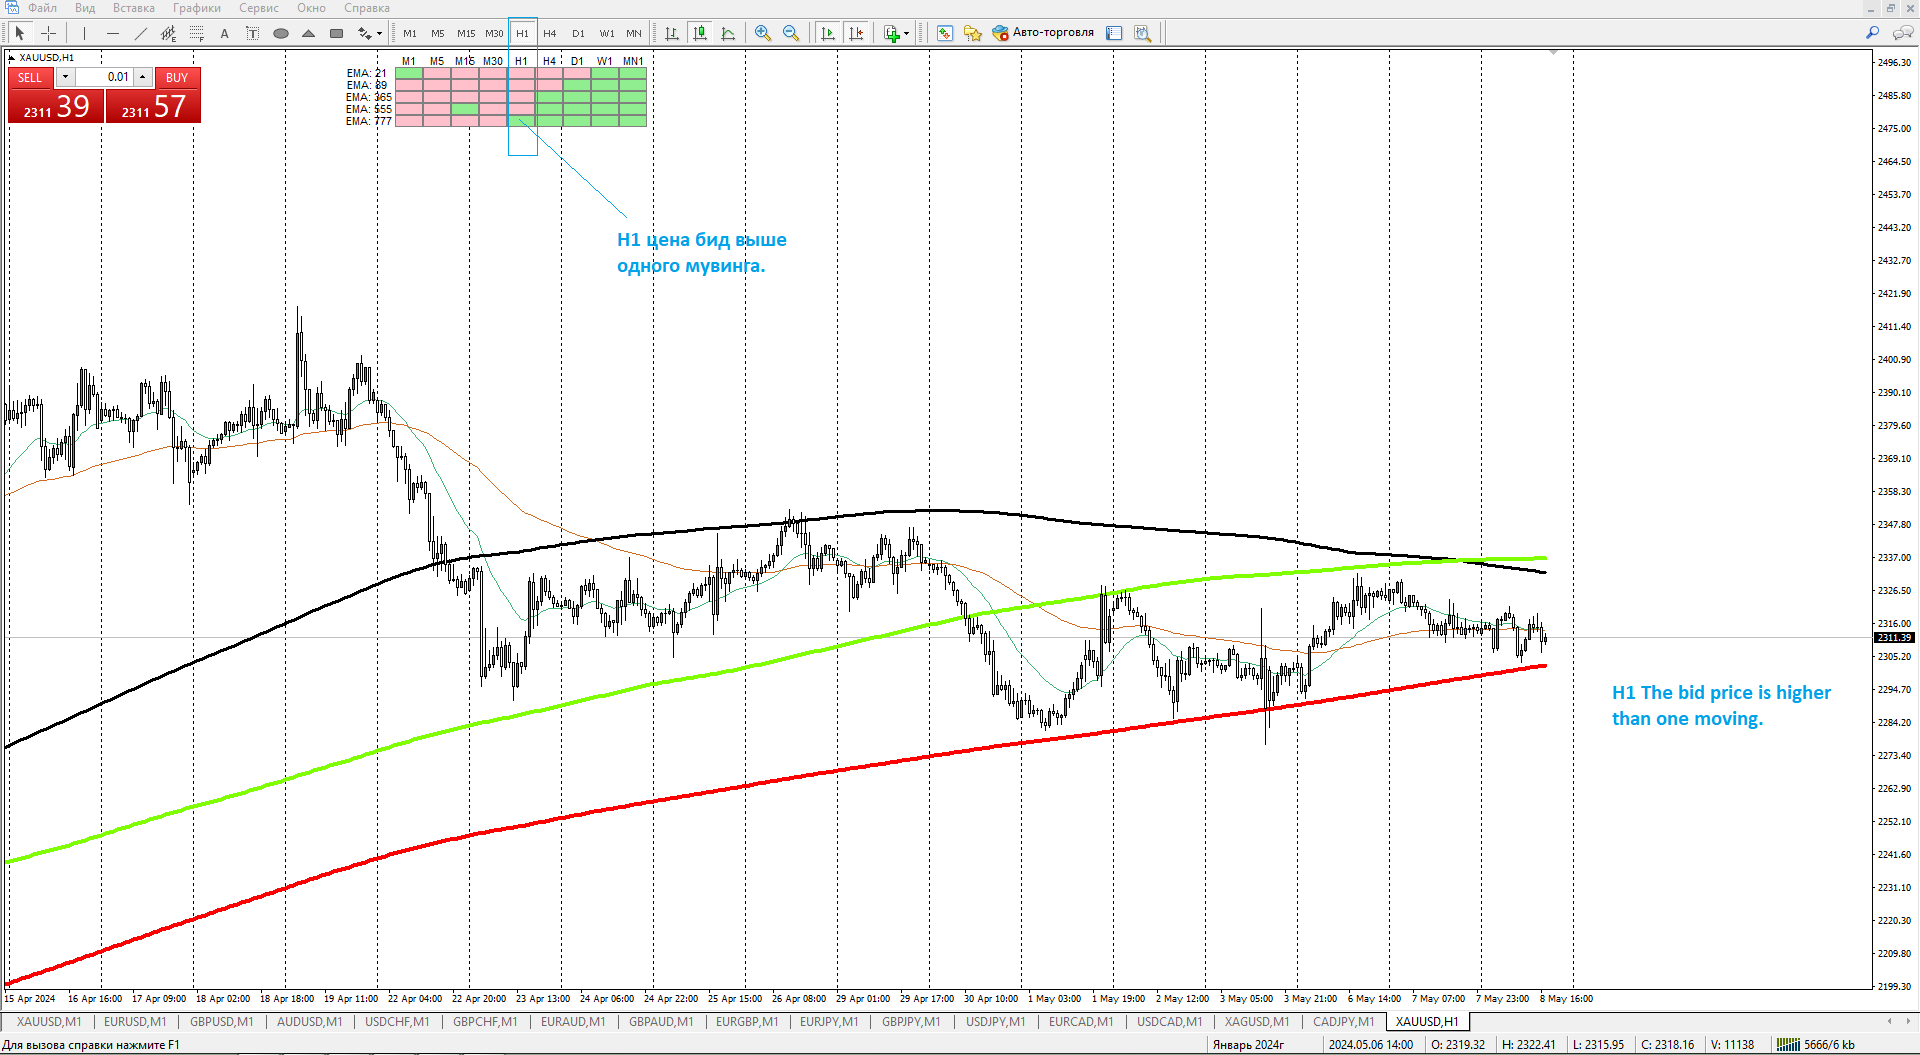
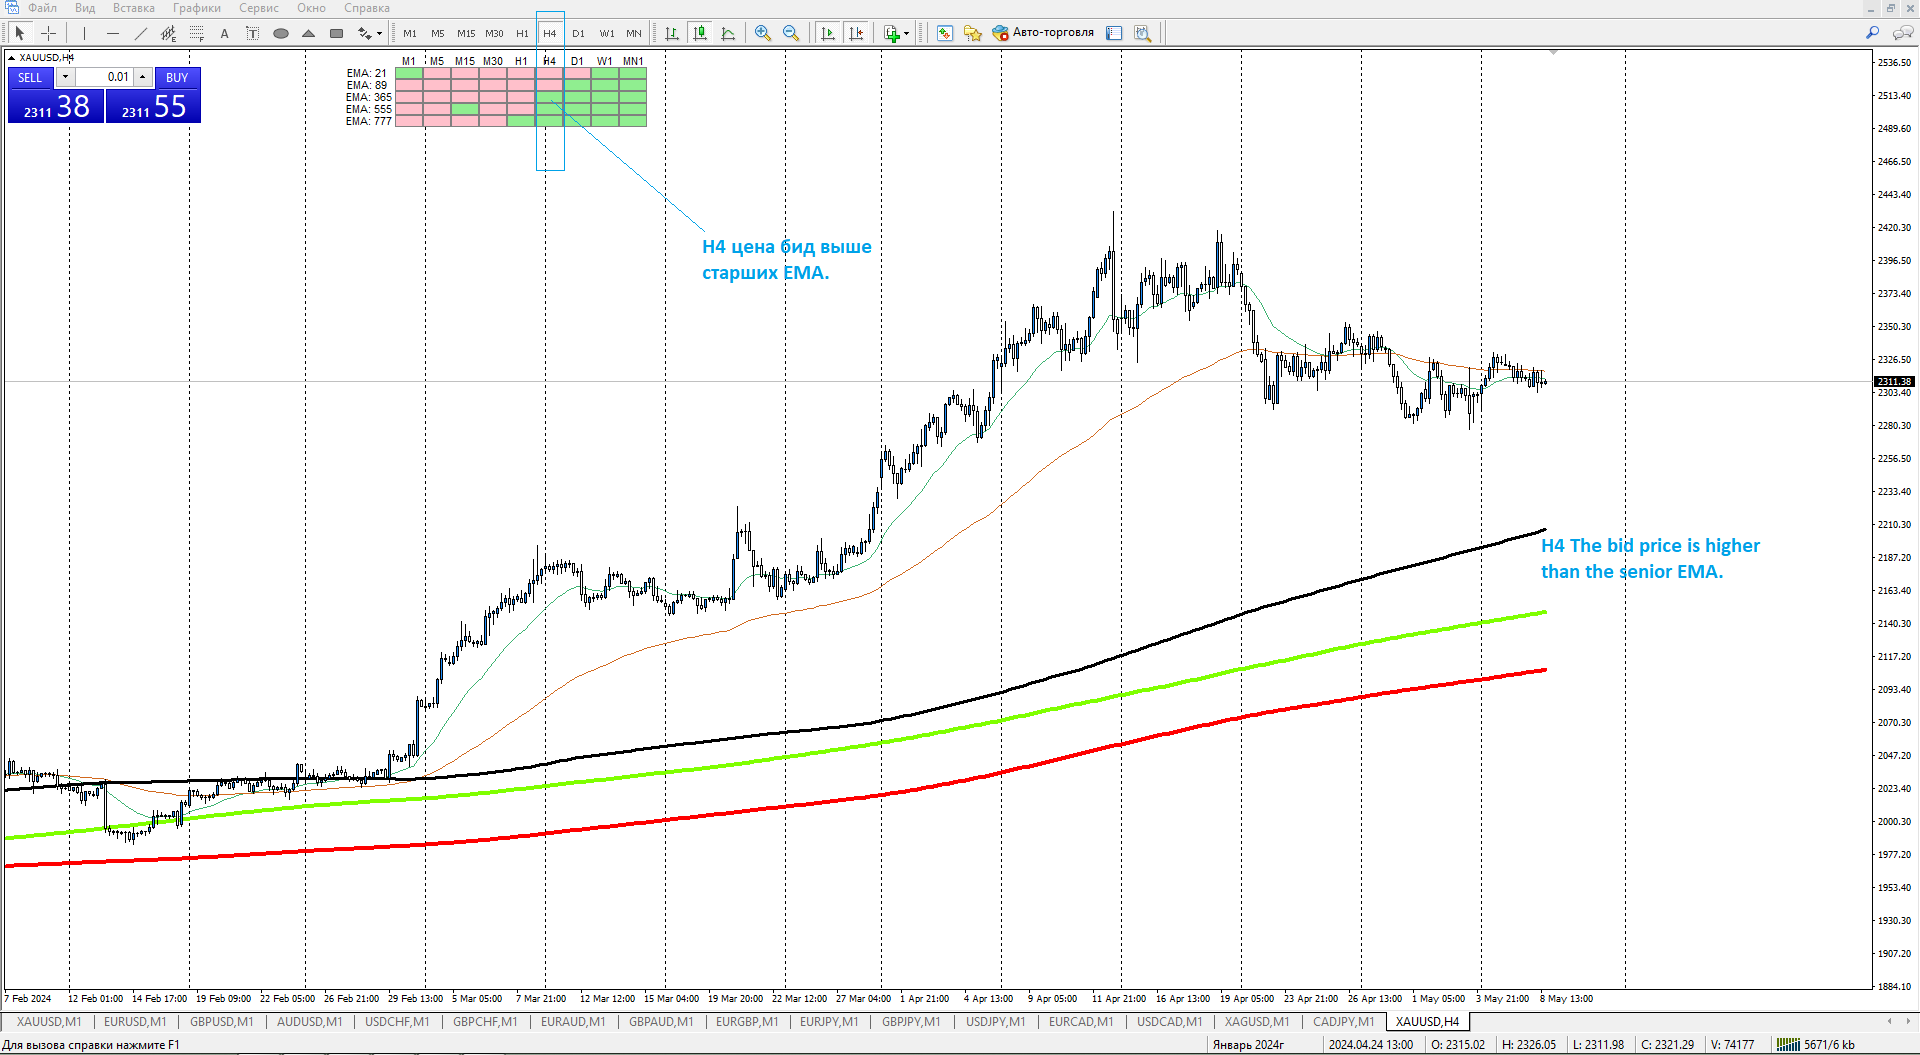
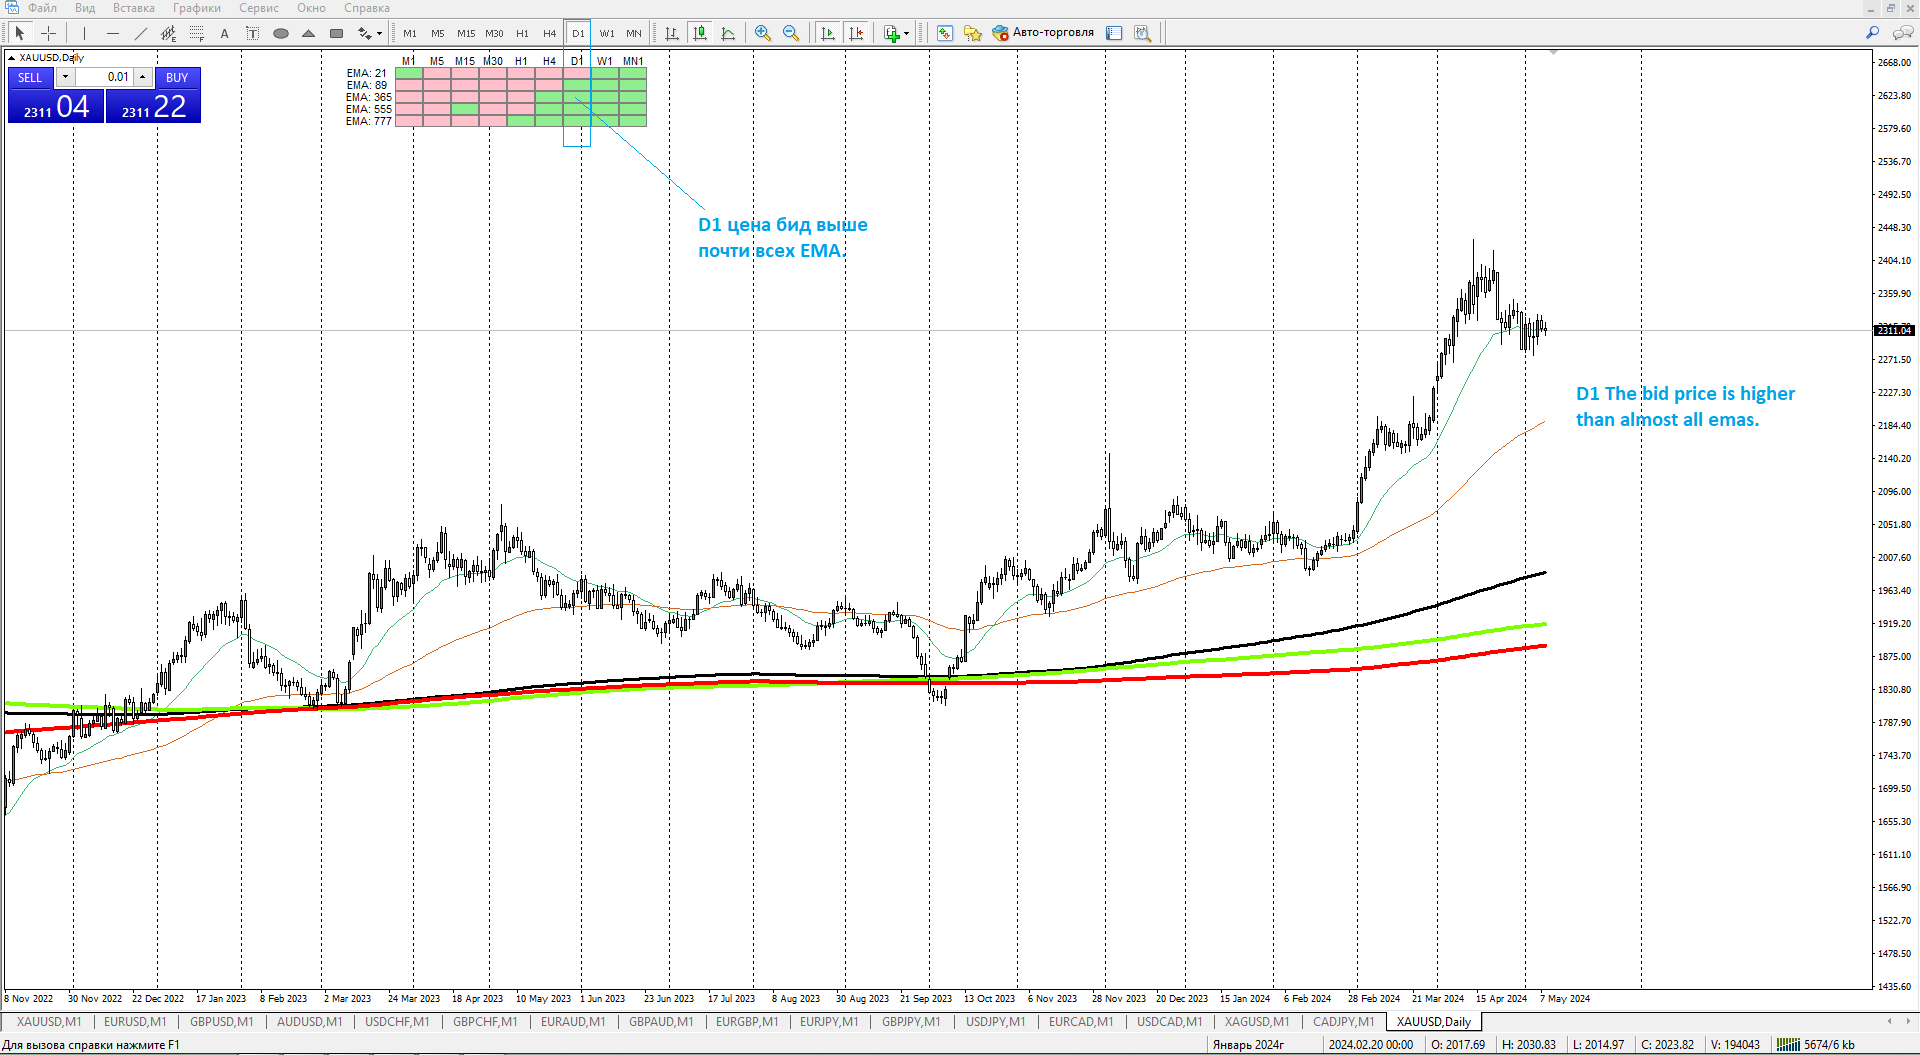
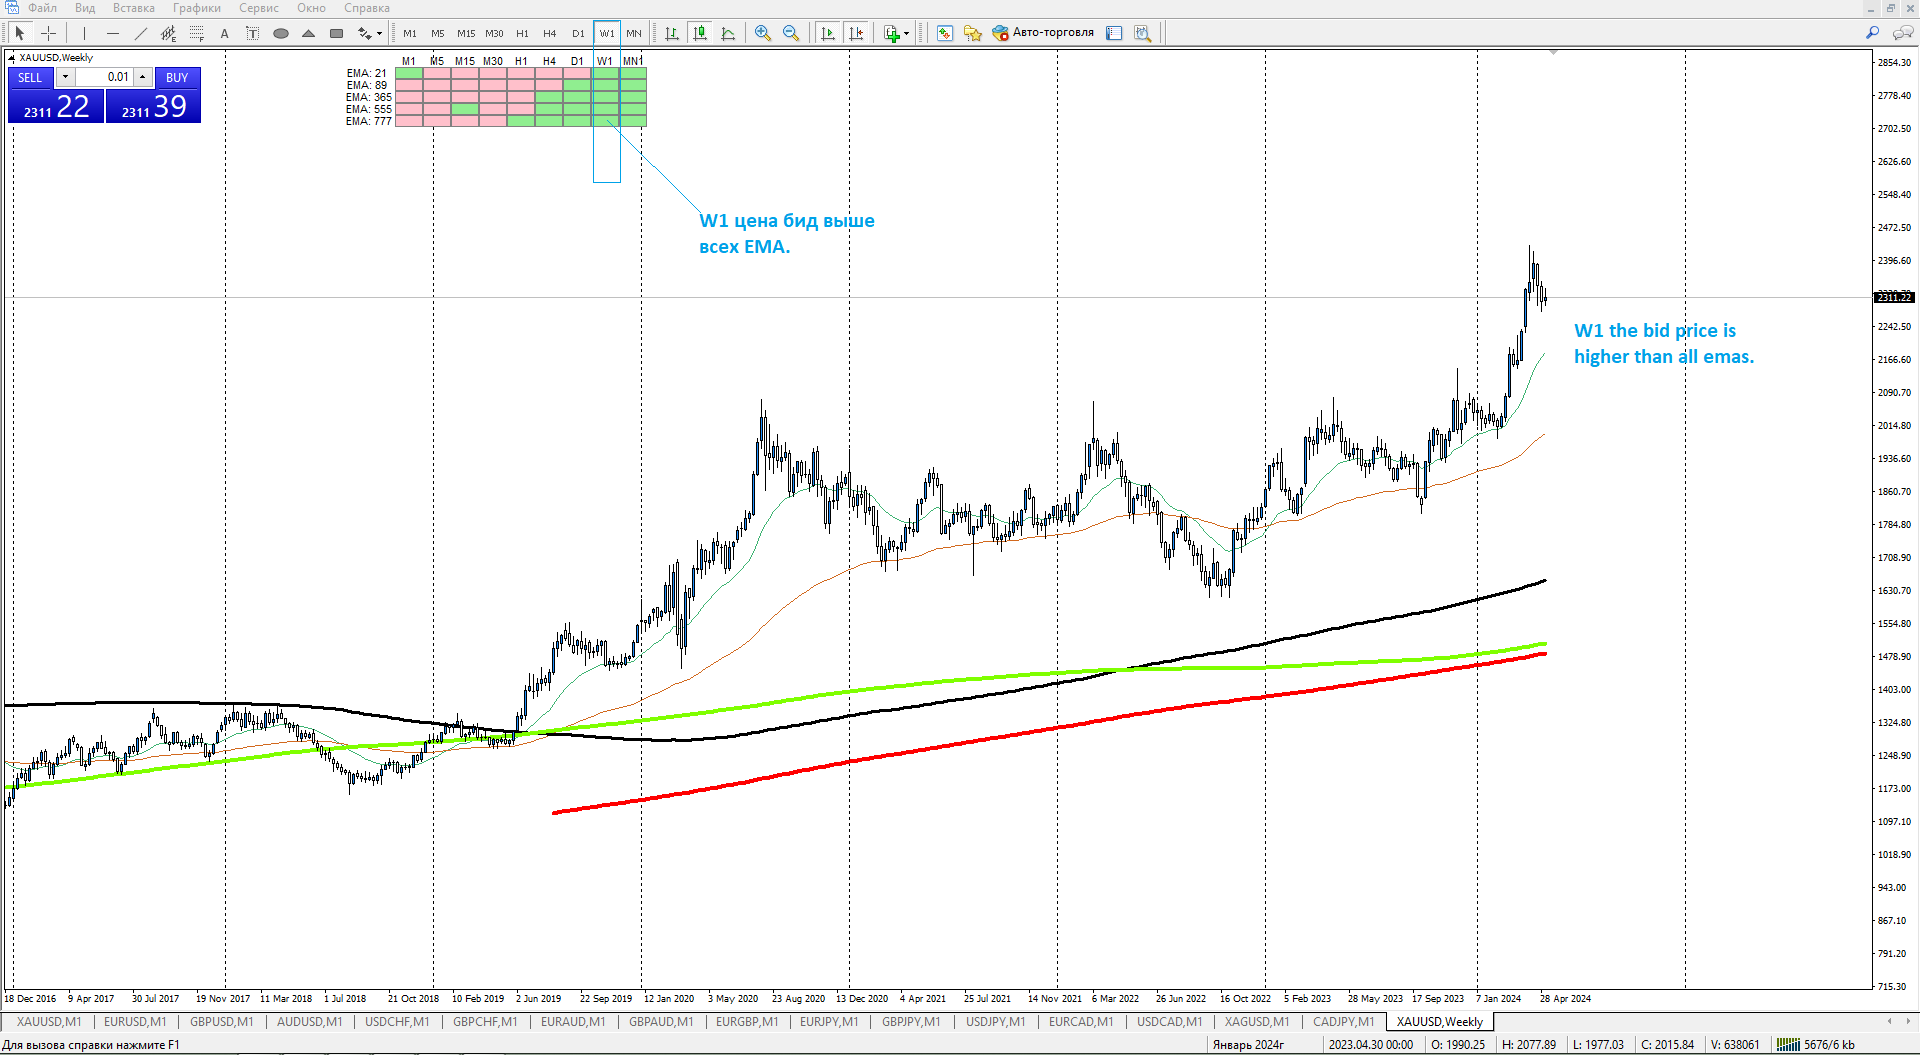
Трейдеру достаточно ввести параметры своих МА в индикатор, и не переключая тайм фреймов видеть,
где находиться текущая цена относительно мувингов, т.е. выше или ниже цены
Bid.

ячейки индикатора легко расположить по координатам на любом размере монитора.
Я к примеру, располагаю индикатор прямо под кнопками переключения тайм фреймов.
Как изображено на скринах к индикатору.

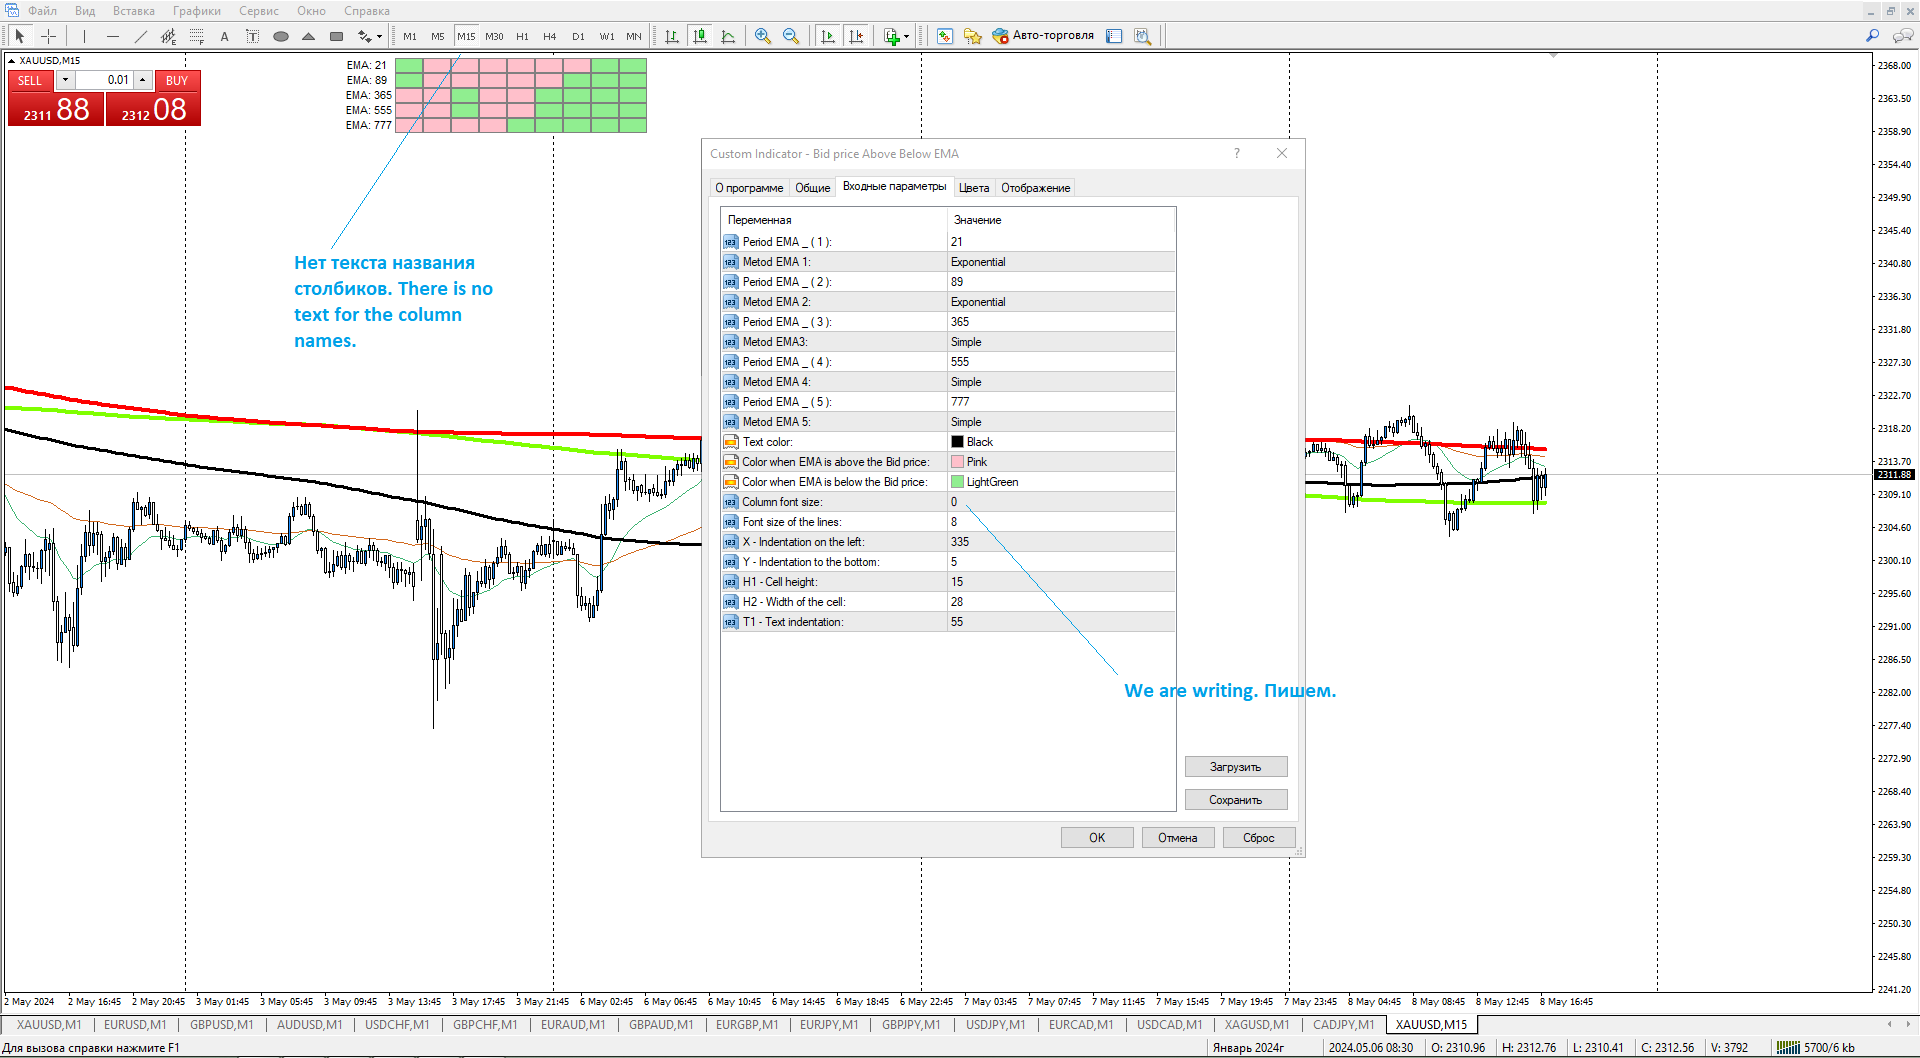
Текст названия столбиков, тайм фреймы, можно отключать поставив размер текст 0.
Рядом со строкой ячеек отображается цифровое значение всех добавленных вами МА во входные параметры индикатора. Для наглядности.

Сами мувинги, средние скользящие Вы на график добавляете сами. По вашему усмотрению, и дублируете их значение в данный индикатор.

По индикатору, очень хорошо, визуально видны тренды и тенденции текущей цены. Если Ячейки зелёные, то на всех тайм фреймах,
то сейчас преобладает восходящих тренд. Если ячейки красные, то нисходящий, и цена находиться под мувингами.

К индикатору легко приспособиться, и он будет давать вам дополнительную информацию для принятия вами решений по своей торговой
системе., если у Вы используете средние скользящие в своей торговой стратегии. Не переключая тайм фреймы графиков валютных инструментов.


Некоторые входные параметры индикатора:

  • Period ЕМА (1,2,3,4,5) – период средней скользящей.

  • Metod EMA – метод построения MA


    В параметрах индикатора можно менять цвета ячеек и размеры текстов. А также перемещать по двум координатным осям на графике.
    По умолчанию в индикаторе введены мною проверенные годами, параметры ЕМА. Которые работают как динамические уровни
    поддержки и сопротивления. Пересечение малых средних 21 и 89 ЕМА, является разворотом тренда. Добавьте их на график и убедитесь сами.


    P.S.     Попутного тренда друзья единомышленники и Успехов нам во всём.
    Все вопросы и предложения,  пишите личными сообщениями автору,  или
    комментариями к данному индикатору. И мы сделаем нашу с вами работу
    трейдера ещё комфортнее, удобнее и прибыльнее. На связи. VT 


Prodotti consigliati
Discover the power of precision and efficiency in your trading with the " Super Auto Fibonacci " MT4 indicator. This cutting-edge tool is meticulously designed to enhance your technical analysis, providing you with invaluable insights to make informed trading decisions. Key Features: Automated Fibonacci Analysis: Say goodbye to the hassle of manual Fibonacci retracement and extension drawing. "Super Auto Fibonacci" instantly identifies and plots Fibonacci levels on your MT4 chart, saving you tim
FREE
Trendline indicator
David Muriithi
2 (1)
Are you tired of drawing trendlines every time you're analyzing charts? Or perhaps you would like more consistency in your technical analysis. Then this is for you. This indicator will draw trend lines automatically when dropped on a chart. How it works Works similar to standard deviation channel found on mt4 and mt5. It has 2 parameters: 1. Starting Bar 2. Number of bars for calculation The   starting bar   is the bar which drawing of the trend lines will begin, while the   number of bars for c
FREE
Forex Market Profile and Vwap
Lorentzos Roussos
4.86 (7)
Profilo del mercato Forex (FMP in breve) Cosa non è: FMP non è il classico display TPO con codice alfabetico, non mostra il calcolo generale del profilo dati del grafico e non segmenta il grafico in periodi e non li calcola. Cosa fa : Soprattutto, l'indicatore FMP elaborerà i dati che risiedono tra il bordo sinistro dello spettro definito dall'utente e il bordo destro dello spettro definito dall'utente. L'utente può definire lo spettro semplicemente tirando ciascuna estremità dell'indicatore
FREE
YOU CAN NOW DOWNLOAD FREE VERSIONS OF OUR PAID INDICATORS . IT'S OUR WAY OF GIVING BACK TO THE COMMUNITY ! >>>    GO HERE TO DOWNLOAD This system is an Heiken Ashi system based on RSI calculations . The system is a free open source script originally published on TradingView by JayRogers . We have taken the liberty of converting the pine script to Mq4 indicator . We have also added a new feature which enables to filter signals and reduces noise on the arrow signals. Background HEIKEN ASHI Th
FREE
Rainbow MT4
Jamal El Alama
Rainbow MT4 is a technical indicator based on Moving average with period 34 and very easy to use. When price crosses above MA and MA changes color to green, it’s a signal to buy. When price crosses below MA and MA changes color to red, it’s a signal to sell. The Expert advisor ( Rainbow EA MT4) based on Rainbow MT4 indicator, as you can see in the short video below is now available here .
FREE
Virtual Targets
Hoang Van Dien
3.83 (6)
This indicator is very useful for day traders or short term traders. No need to calculate the number of pips manually, just look at the chart and you will see the Virtual Take Profit / Virtual Stop Loss target line and evaluate whether the entry point is feasible to reach the intended target or not. Enter the intended Take Profit / Stop Loss pips for your trade. The indicator will display Virtual Take Profit / Virtual Stop Loss lines for you to easily see if the target is feasible or not.
FREE
Benvenuti nel nostro   modello di ondata di prezzo   MT4 --(modello ABCD)--     Il modello ABCD è un modello di trading potente e ampiamente utilizzato nel mondo dell'analisi tecnica. È un modello di prezzo armonico che i trader utilizzano per identificare potenziali opportunità di acquisto e vendita sul mercato. Con il modello ABCD, i trader possono anticipare potenziali movimenti di prezzo e prendere decisioni informate su quando entrare e uscire dalle negoziazioni. Versione EA:   Price Wave
FREE
QualifiedEngulfing
Ashkan Hazegh Nikrou
QualifiedEngulfing è la versione gratuita dell'indicatore ProEngulfing . ProEngulfing è la versione a pagamento dell'indicatore Advance Engulf. Scaricalo qui. Qual è la differenza tra la versione gratuita e la versione a pagamento di ProEngulfing ? La versione gratuita ha un limite di un segnale al giorno. Presentazione di QualifiedEngulfing - Il tuo indicatore professionale per i modelli Engulf su MT4 Sblocca la potenza della precisione con QualifiedEngulfing, un indicatore all'avanguardia pro
FREE
Candle Countdown — Tempo preciso fino alla chiusura della candela per MT4 Candle Countdown è uno strumento semplice e preciso che mostra il tempo rimanente fino alla chiusura della candela corrente direttamente sul grafico. Quando l’ingresso dipende dalla chiusura della candela, anche pochi secondi possono fare la differenza. Questo indicatore ti permette di vedere il tempo esatto e prendere decisioni senza fretta o supposizioni. Un indicatore per il controllo preciso della chiusura della cande
FREE
Индикатор реализован для определения классического канала движения цены, который используется на крупных биржевых площадках. Не перерисовывается Синий уровень - это уровень поддержки  Красный уровень - это уровень сопротивления  Белый уровень - является Pivot-уровнем  Настройки Period_SEC  - ввод  значения периода . Примечание:  Индикатор определяет уровни только на пятизначных котировках! Метод торговли:  Открытие позиций осуществляется от уровней , именно на их значениях происходит отскок цены
FREE
PZ Penta O MT4
PZ TRADING SLU
2.33 (3)
The Penta-O is a 6-point retracement harmonacci pattern which usually precedes big market movements. Penta-O patterns can expand and repaint quite a bit. To make things easier this indicator implements a twist: it waits for a donchian breakout in the right direction before signaling the trade. The end result is an otherwise repainting indicator with a very reliable trading signal. The donchian breakout period is entered as an input. [ Installation Guide | Update Guide | Troubleshooting | FAQ | A
FREE
AutoDiMA
Vasiliy Anokhin
Индикатор " AutoDiMA " рисует по графику в основном окне скользящую среднюю с динамическим периодом, рассчитываемым по стандартному индикатору " Average True Range (ATR) ". Когда " ATR " изменяется в диапазоне значений между верхним уровнем и нижним уровнем - тогда в заданном диапазоне меняется вариативный период скользящей средней. Принцип ускорения или замедления скользящей средней переключается в настройках параметром " FLATing ". ВХОДНЫЕ ПАРАМЕТРЫ: - DRAWs : Количество баров для отображения
FREE
Follow The Line
Oliver Gideon Amofa Appiah
3.94 (16)
FOLLOW THE LINE GET THE FULL VERSION HERE: https://www.mql5.com/en/market/product/36024 This indicator obeys the popular maxim that: "THE TREND IS YOUR FRIEND" It paints a GREEN line for BUY and also paints a RED line for SELL.  It gives alarms and alerts of all kinds. IT DOES NOT REPAINT and can be used for all currency pairs and timeframes. Yes, as easy and simple as that. Even a newbie can use it to make great and reliable trades. NB: For best results, get my other premium indicators for more
FREE
HMA Trend
Pavel Zamoshnikov
4.54 (70)
A trend indicator based on the Hull Moving Average (HMA) with two periods. The Hull Moving Average is an improved variant of the moving average, which shows the moment of trend reversal quite accurately. It is often used as a signal filter. Combination of two types of Hull Moving Averages makes a better use of these advantages: HMA with a slow period identifies the trend, while HMA with a fast period determines the short-term movements and signals in the trend direction. Features The movement d
FREE
MASi Three Screens
Aleksey Terentev
5 (2)
MASi Three Screens is based on the trading strategy by Dr. Alexander Elder. This indicator is a collection of algorithms. Algorithms are based on the analysis of charts of several timeframes. You can apply any of the provided algorithms. List of versions of algorithms:     ThreeScreens v1.0 - A simple implementation, with analysis of the MACD line;     ThreeScreens v1.1 - A simple implementation, with analysis of the MACD histogram;     ThreeScreens v1.2 - Combines the first two algorithms in
FREE
Traditional MACD MT4
Daniel Lewis
4.58 (55)
MACD indicator in MetaTrader 4/5 looks different than MACD does in most other charting software. That is because the MetaTrader 4/5 version of MACD displays the MACD line as a histogram when it is traditionally displayed as a line. Additionally, the MetaTrader 4/5 version computes the Signal line using an SMA, while according to MACD definition it is supposed to be an EMA. The MetaTrader 4/5 version also does not compute a true MACD Histogram (the difference between the MACD/Signal lines). This
FREE
The free version of the Hi Low Last Day MT4 indicator . The Hi Low Levels Last Day MT4 indicator shows the high and low of the last trading day . The ability to change the color of the lines is available . Try the full version of the Hi Low Last Day MT4 indicator , in which additional indicator features are available : Displaying the minimum and maximum of the second last day Displaying the minimum and maximum of the previous week Sound alert when crossing max . and min . levels Selecting an arb
FREE
Magic Supply Demand Indicator works on all products and timeframes. It is a new formula, and   the very new features are two zone strength functions adjustable by user input!   This is a great advantage in trading. When you learn how to use the proprietary features such as the zone strength with   min X-factor of price travel away, you will be able to tell whether the zone is strong or not. The supply and demand zones are used as an alert trigger.   You can use popup alert with sound on MetaTra
FREE
Candle GAP
Thushara Dissanayake
3 (1)
L'indicatore   Candle GAP   è uno strumento essenziale per i trader che utilizzano   le strategie di Gap Trading   in quanto identifica automaticamente i gap delle candele per ogni giorno della settimana. Un gap si riferisce a una differenza di livello di prezzo tra la chiusura e l'apertura di due giorni consecutivi. Questo indicatore riconosce quattro tipi di modelli di gap: comune, fuga, continuazione ed esaurimento. Incorporando questo indicatore in qualsiasi grafico, i trader possono convali
FREE
This is Demo Version of PipsFactoryMonthly This indicator depends on High and Low price of Currency in last Month and then i made some secret equations to draw 10 lines. Features You will know what exactly price you should enter the market. You will know when to be out of market. You will know you what should you do in market: Buy Sell Take profit and there are 3 levels to take your profit Support Resistance Risk to buy Risk to Sell Signal Types and Timeframe Used You can use this indicator ju
FREE
SMA Indicator
Nitu Brijesh Yadav
Arrow Indicator (Buy/Sell Alerts) – Simple Yet Powerful Tool!             Product Version: 1.01           Indicator Type: Trend Reversal Signals           Timeframes Supported: All (Recommended: H1, H4, D1)           Key Features: Buy Signal: Green upward arrow () appears below the candle  Sell Signal : Red downward arrow () appears above the candle Accurate Trend Reversal Detection – Based on tried and tested SMA strategy. ️ Clean Chart View – Minimalist, non-i
FREE
SuperTrend V
Muhammad Hassaan
*This is TradingView indicator converted to mql4* The SuperTrend V indicator is a popular technical analysis tool used to identify trends and potential trend reversals in financial markets. It is based on the concept of the SuperTrend indicator but incorporates additional features and variations. The SuperTrend V indicator uses a combination of price action and volatility to determine the trend direction and generate trading signals. Here are the key components and features of the indicator: Ca
This is a regression tree indicator for MT4/MT5. This indicator classificate nodes on the time period so that the deviation becomes smaller, and displays regression line and channel for each node. It's free! Attached CartDemo.ex4 and CartDemo.ex5 is a Demo version and has the following limitations: Can't use HighSpeed method (default method is RandomForest) Maximum number of bars is 260 (increase from 200) There is no expiration date and can be started many times, but it stops after an hour.
FREE
This indicator alerts you when/before new 1 or 5 minute bar candle formed. In other words,this indicator alerts you every 1/5 minutes. This indicator is especially useful for traders who trade when new bars formed. *This indicator don't work propery in strategy tester.Use this in live trading to check functionality. There is more powerful Pro version .In Pro version,you can choose more timeframe and so on. Input Parameters Alert_Or_Sound =Sound ----- Choose alert or sound or both to notify y
FREE
Two Period RSI
Libertas LLC
5 (4)
Two Period RSI compares long-term and short-term RSI lines, and plots a fill between them for improved visualization. Fill is colored differently according to an uptrend (short period RSI above long period RSI) or a downtrend (short period RSI below long period RSI). Short-term RSI crossing long-term RSI adds a more robust trend confirmation signal than using single period RSI alone. This is a small tool to help visualize and confirm RSI trends. We hope you enjoy! Looking for RSI alerts? You can
FREE
Trend Filter Pro
Aleksandr Makarov
5 (1)
Special offer in honor of the New Year and Christmas!! https://www.mql5.com/ru/users/bossik2810 Trend Filter Pro Trend filter indicator. Very good filter for your trading system, I recommend to use it together with - System Trend Pro   or  Quantum Entry PRO The indicator no repaint!!! Settings: Change the Period parameter for better filtering ( default is 90) Any questions? Need help?, I am always happy to help, write me in private messages or In Telegram: https://t.me/Trader35_Admin
FREE
STM Signal MT4
Aren Davidian
4 (1)
Introducing the Professional Arka STM Signal Indicator With Arka Candle Close Time – 100% Free Version Fast, Accurate, and Unmatched in Identifying Trading Opportunities This indicator is the result of combining advanced price action analysis with specialized market algorithms, delivering clear, timely, and profitable signals. Completely Free – No Installation or Usage Limits ️ An automated trading bot, fully synchronized with it, is also ready to run. The Power of ARKA   STM Si
FREE
Renko bars builder
Navdeep Singh
4.2 (5)
The indicator builds a Renko chart in the sub window for the current symbol. The bars are formed from live data and the desired bar size can be set in the inputs tab. Most importantly, because the Renko chart only uses price to construct bars and ignores time, the indicator can be applied to any time frame and same results can be achieved. Recommended usage As Renko charts are famous for eliminating noise so traders can use this tool to see clear picture of the trend to help their analysis, entr
FREE
What is ADR? Quite simply, ADR (Average Daily Range) is the average of price movement over a period of time.  It can be used as a gauge of how far price may move on any given trading day. This indicator calculates 5, 10, 20 Average Daily Range Features: -  Average: Daily Range, Prev 1/5/10/20 days - Calculator maximum stop loss/profit target by Risk/Reward percent of ADR in Pips. - Candle countdown - ... Contact me if you need:  https://t.me/Cuongitl
FREE
Che cos'è lo Schaff Trend Cycle? Lo Schaff Trend Cycle (STC) è un indicatore di tipo oscillatore progettato per rilevare tempestivamente i cambiamenti di tendenza. A differenza degli indicatori tradizionali come le medie mobili o il MACD, lo STC combina cicli di mercato e momentum per identificare in modo più chiaro l'inizio e la fine di una tendenza. Caratteristiche principali Segnali chiari di inversione di tendenza: la linea del ciclo sale durante un trend rialzista e scende durante un trend
FREE
Gli utenti di questo prodotto hanno anche acquistato
Gann Made Easy
Oleg Rodin
4.83 (160)
Gann Made Easy è un sistema di trading Forex professionale e facile da usare che si basa sui migliori principi del trading utilizzando la teoria di mr. WD Gann. L'indicatore fornisce segnali ACQUISTA e VENDI accurati, inclusi i livelli di Stop Loss e Take Profit. Puoi fare trading anche in movimento utilizzando le notifiche PUSH. CONTATTAMI DOPO L'ACQUISTO PER RICEVERE GRATUITAMENTE LE ISTRUZIONI DI TRADING E OTTIMI INDICATORI EXTRA! Probabilmente hai già sentito parlare molte volte dei metodi d
Market Makers
Mohamed Hassan
5 (3)
After purchase, contact me privately to receive 1 month of free testing with EA Forex Proton! This advanced MT4 trading robot automatically executes signals from any MT4 indicator, including Market Makers. The latest version also includes AI integration, allowing each trade signal to be analyzed using Artificial Intelligence. Live Signal with EA Forex Proton: Click here Market Makers is a powerful price action trading system designed to identify high-probability Buy and Sell opportunities based
Scalper Inside PRO
Alexey Minkov
4.74 (69)
12% OFF EASTER SALE An exclusive indicator that utilizes an innovative algorithm to swiftly and accurately determine the market trend. The indicator automatically calculates opening, closing, and profit levels, providing detailed trading statistics. With these features, you can choose the most appropriate trading instrument for the current market conditions. Additionally, you can easily integrate your own arrow indicators into Scalper Inside Pro to quickly evaluate their statistics and profitabi
M1 Sniper
Oleg Rodin
5 (21)
M1 SNIPER è un sistema di indicatori di trading facile da usare. Si tratta di un indicatore a freccia progettato per l'intervallo temporale M1. L'indicatore può essere utilizzato come sistema autonomo per lo scalping sull'intervallo temporale M1 e come parte del tuo sistema di trading esistente. Sebbene questo sistema di trading sia stato progettato specificamente per il trading sull'intervallo temporale M1, può comunque essere utilizzato anche con altri intervalli temporali. Inizialmente ho pro
PRO Renko System
Oleg Rodin
5 (30)
PRO Renko System è un sistema di trading altamente accurato appositamente progettato per il trading di grafici RENKO. Questo è un sistema universale che può essere applicato a vari strumenti di trading. Il sistema neutralizza efficacemente il cosiddetto rumore di mercato che consente di accedere a segnali di inversione accurati. L'indicatore è molto facile da usare e ha un solo parametro responsabile della generazione del segnale. Puoi facilmente adattare lo strumento a qualsiasi strumento di
Advanced Supply Demand
Bernhard Schweigert
4.91 (299)
Speciale Trading- SCONTO DEL 40% La soluzione migliore per qualsiasi trader principiante o esperto! Questo indicatore è uno strumento di trading unico, di alta qualità e conveniente, perché abbiamo incorporato una serie di funzionalità proprietarie e una nuova formula. Con questo aggiornamento, potrai visualizzare doppie zone di timeframe. Non solo potrai visualizzare un TF più alto, ma anche entrambi, il TF del grafico e il TF più alto: MOSTRA ZONE ANNIDATE. Tutti i trader che operano con Of
Volatility Trend System - un sistema di trading che fornisce segnali per le voci. Il sistema di volatilità fornisce segnali lineari e puntuali nella direzione del trend, nonché segnali per uscirne, senza ridisegnare e ritardi. L'indicatore di tendenza monitora la direzione della tendenza a medio termine, mostra la direzione e il suo cambiamento. L'indicatore di segnale si basa sui cambiamenti della volatilità e mostra gli ingressi nel mercato. L'indicatore è dotato di diversi tipi di avvisi. Pu
Ultimate Sniper Dashboard
Hispraise Chinedum Abraham
4.82 (22)
Scontato a 299 dollari! I prezzi potrebbero aumentare in futuro! Leggi la descrizione qui sotto! Il miglior sistema di ingresso per la plancia Ultimate Sniper: LIVELLI DINAMICI FINALI. (Si prega di controllare i miei prodotti) L'Ultimate Sniper Dashboard funziona SOLO sui mercati live a causa dei limiti di test della MT4 multicurrency. Vi presentiamo l'Ultimate Sniper Dashboard! Il nostro migliore che contiene sia HA-Sniper, MA-Sniper e molte modalità speciali. Il cruscotto Ultimate Sniper è
L'indicatore " Dynamic Scalper System " è progettato per il metodo di scalping, ovvero per il trading all'interno di onde di trend. Testato sulle principali coppie di valute e sull'oro, è compatibile con altri strumenti di trading. Fornisce segnali per l'apertura di posizioni a breve termine lungo il trend, con ulteriore supporto al movimento dei prezzi. Il principio dell'indicatore. Le frecce grandi determinano la direzione del trend. Un algoritmo per generare segnali per lo scalping sotto fo
Trend Screener
STE S.S.COMPANY
4.79 (95)
Indicatore di tendenza, soluzione unica rivoluzionaria per il trading di tendenze e il filtraggio con tutte le importanti funzionalità di tendenza integrate in un unico strumento! È un indicatore multi-timeframe e multi-valuta al 100% non ridipingibile che può essere utilizzato su tutti i simboli/strumenti: forex, materie prime, criptovalute, indici e azioni. OFFERTA A TEMPO LIMITATO: l'indicatore di screening di supporto e resistenza è disponibile a soli 50$ e a vita. (Prezzo originale 250$) (o
Trend indicator AI
Ramil Minniakhmetov
4.53 (83)
Trend Ai indicator è un ottimo strumento che migliorerà l'analisi di mercato di un trader combinando l'identificazione della tendenza con punti di ingresso utilizzabili e avvisi di inversione. Questo indicatore consente agli utenti di navigare nelle complessità del mercato forex con fiducia e precisione Oltre ai segnali primari, l'indicatore Ai di tendenza identifica i punti di ingresso secondari che si presentano durante i pullback o i ritracciamenti, consentendo ai trader di capitalizzare le
Atomic Analyst
Issam Kassas
5 (4)
Innanzitutto, vale la pena sottolineare che questo indicatore di trading non è repaint, non è ridisegno e non presenta ritardi, il che lo rende ideale sia per il trading manuale che per quello automatico. Manuale utente: impostazioni, input e strategia. L'Analista Atomico è un indicatore di azione del prezzo PA che utilizza la forza e il momentum del prezzo per trovare un miglior vantaggio sul mercato. Dotato di filtri avanzati che aiutano a rimuovere rumori e segnali falsi, e aumentare il pote
Scalper Vault
Oleg Rodin
5 (36)
Scalper Vault è un sistema di scalping professionale che ti fornisce tutto il necessario per scalping di successo. Questo indicatore è un sistema di trading completo che può essere utilizzato dai trader di forex e opzioni binarie. L'intervallo di tempo consigliato è M5. Il sistema fornisce segnali di freccia accurati nella direzione della tendenza. Ti fornisce anche i segnali più alti e più bassi e i livelli di mercato di Gann. Gli indicatori forniscono tutti i tipi di avvisi, comprese le notifi
ATTUALMENTE SCONTATO DEL 40% La soluzione migliore per ogni principiante o trader esperto! Questo indicatore è uno strumento di trading unico, di alta qualità e conveniente perché abbiamo incorporato una serie di caratteristiche proprietarie e una nuova formula. Con un solo grafico è possibile leggere la forza delle valute per 28 coppie Forex! Immaginate come migliorerà il vostro trading perché sarete in grado di individuare l'esatto punto di innesco di una nuova tendenza o di un'opportunità
Attualmente 40% di sconto! La soluzione migliore per ogni principiante o trader esperto! Questo software per cruscotti funziona su 28 coppie di valute. Si basa su 2 dei nostri indicatori principali (Advanced Currency Strength 28 e Advanced Currency Impulse). Offre un'ottima panoramica dell'intero mercato Forex. Mostra i valori di forza delle valute avanzate, la velocità di movimento delle valute e i segnali per 28 coppie Forex in tutti i (9) timeframe. Immaginate come migliorerà il vostro tra
Trend Lines PRO
Roman Podpora
5 (1)
LINEE DI TENDENZA PRO       Aiuta a capire dove il mercato sta realmente cambiando direzione. L'indicatore mostra reali inversioni di tendenza e punti in cui i principali attori rientrano. Vedi  Linee BOS   Cambiamenti di tendenza e livelli chiave su timeframe più ampi, senza impostazioni complesse o rumore inutile. I segnali non vengono ridisegnati e rimangono sul grafico dopo la chiusura della barra. VERSIONE MT 5     -      Svela il suo massimo potenziale se abbinato all'indicatore   RFI LEVE
- Real price is 80$ - 40% Discount (It is 49$ now) Contact me for instruction, add group and any questions! - Non-repaint - I just sell my products in Elif Kaya profile, any other websites are stolen old versions, So no any new updates or support. - Lifetime update free Related product:   Bitcoin Expert Introduction The breakout and retest strategy is traded support and resistance levels. it involves price breaking through a previous level.  The break and retest strategy is designed to help tr
Versione MT5 disponibile qui: https://www.mql5.com/en/market/product/50048 Canale e gruppo Telegram: https://t.me/bluedigitsfx Accesso al gruppo V.I.P: Invia la prova di pagamento di uno dei nostri prodotti a pagamento in messaggio privato Broker consigliato: https://bit.ly/BlueDigitsFxStarTrader BlueDigitsFx Easy 123 System — Indicatore potente per rilevare inversioni e breakout su MT4 Sistema tutto-in-uno non repaint per individuare facilmente cambi di struttura del mercato, breakout e in
Support Resistance screnner
STE S.S.COMPANY
4.95 (37)
Support And Resistance Screener è in un indicatore di livello per MetaTrader che fornisce più strumenti all'interno di un indicatore. Gli strumenti disponibili sono: 1. Screener della struttura del mercato. 2. Zona di ritiro rialzista. 3. Zona di ritiro ribassista. 4. Punti pivot giornalieri 5. Punti pivot settimanali 6. Punti pivot mensili 7. Forte supporto e resistenza basati sul modello e sul volume armonici. 8. Zone a livello di banca. OFFERTA A TEMPO LIMITATO: il supporto HV e l'indicatore
Se acquisti questo indicatore, riceverai il mio Trade Manager Professionale   + EA  GRATUITAMENTE. Innanzitutto è importante sottolineare che questo sistema di trading è un indicatore Non-Repainting, Non-Redrawing e Non-Lagging, il che lo rende ideale sia per il trading manuale che per quello automatico. Corso online, manuale e download di preset. Il "Sistema di Trading Smart Trend MT5" è una soluzione completa pensata sia per i trader principianti che per quelli esperti. Combina oltre 10 indic
Dynamic Forex28 Navigator
Bernhard Schweigert
4.43 (7)
Dynamic Forex28 Navigator - Lo strumento di trading Forex di nuova generazione. ATTUALMENTE SCONTATO DEL 49%. Dynamic Forex28 Navigator è l'evoluzione dei nostri indicatori popolari di lunga data, che combinano la potenza di tre in uno: Advanced Currency Strength28 Indicator (695 recensioni) + Advanced Currency IMPULSE con ALERT (520 recensioni) + CS28 Combo Signals (Bonus). Dettagli sull'indicatore https://www.mql5.com/en/blogs/post/758844 Cosa offre l'indicatore di forza di nuova generazione?
Pips Generator
Oleg Rodin
4.6 (10)
Apollo Pips Generator è l'indicatore che fornisce segnali nella direzione del trend. L'indicatore fornisce più punti di ingresso in modo da poter sempre trovare un'opportunità di trading su cui trarre profitto. Presta attenzione agli screenshot. Gli screenshot mostrano lo strumento Pips Generator in combinazione con il mio altro strumento che è rappresentato dal canale con i segnali stellari che indicano i massimi e i minimi. Questa combinazione fornisce diversi modi per applicare il sistema. Do
FX Volume
Daniel Stein
4.63 (38)
FX Volume: Scopri il Vero Sentimento di Mercato dalla Prospettiva di un Broker Panoramica Rapida Vuoi portare la tua strategia di trading a un livello superiore? FX Volume ti offre informazioni in tempo reale su come i trader retail e i broker sono posizionati—molto prima che compaiano report in ritardo come il COT. Che tu miri a guadagni costanti o desideri semplicemente un vantaggio più solido sui mercati, FX Volume ti aiuta a individuare grandi squilibri, confermare i breakout e perfezionar
GOLD Impulse with Alert
Bernhard Schweigert
4.67 (12)
Questo indicatore è una super combinazione dei nostri 2 prodotti Advanced Currency IMPULSE with ALERT  +   Currency Strength Exotics . Funziona per tutti i time frame e mostra graficamente l'impulso di forza o debolezza per le 8 valute principali più un simbolo! Questo indicatore è specializzato nel mostrare l'accelerazione della forza delle valute per qualsiasi simbolo come oro, coppie esotiche, materie prime, indici o futures. Primo nel suo genere, qualsiasi simbolo può essere aggiunto all
Wave Cycle Counter
Eric Evert Ouweneel
Wave and Cycle counter to give an immediate indication how far the ongoing trend has progressed. Low numbers: trend has just started, ride the trend. Higher numbers: trend is 'older', watch for reversals This indicator is 100% compatible with the fantastic TopDog trading strategy. (I will NOT give any details about this Top Dog strategy) The trend direction is determined by a SMA value (or any other MA) you can set. Waves and cycles numbers and letters are derived from a SlowStoch setting. Wave
QM Pattern Scanner MT4
Reza Aghajanpour
4.86 (7)
Discount: It will be $39 for a week or for 2 purchases!  Contact me  to send you instruction and add you in group. QM (Quasimodo) Pattern is based on Read The Market(RTM) concepts. The purpose of this model is to face the big players of the market (financial institutions and banks), As you know in financial markets, big traders try to fool small traders, but RTM prevent traders from getting trapped. This style is formed in terms of price candles and presented according to market supply and dem
Indicatore Miraculous – Strumento Forex e Binario 100% Non-Repaint Basato sul Quadrato di Nove di Gann Questo video presenta l' Indicatore Miraculous , uno strumento di trading altamente accurato e potente, sviluppato specificamente per i trader di Forex e Opzioni Binarie . Ciò che rende unico questo indicatore è la sua base sul leggendario Quadrato di Nove di Gann e sulla Legge della Vibrazione di Gann , rendendolo uno degli strumenti di previsione più precisi disponibili nel trading moderno. L
CRT Multi-Timeframe Market Structure & Liquidity Sweep Indicator Non-Repainting | Multi-Asset | MT5 Version Available MT5 Version:   https://www.mql5.com/en/market/product/162075 Full User Guide — explains what each feature does and why:   https://www.mql5.com/en/blogs/post/767525 Quick Start User Guide  — explains how to configure and in what order:  https://www.mql5.com/en/blogs/post/767540 Indicator Overview CRT Ghost Candle HTF Fractal is a complete institutional-grade market structure too
Gold Buster M1 System è un sistema di trading professionale per i grafici M1 sulla coppia XAUUSD. Ma, nonostante il fatto che il sistema sia stato originariamente sviluppato esclusivamente per il trading di oro, il sistema può essere utilizzato anche con alcune altre coppie di valute. Dopo l'acquisto, ti fornirò un elenco di coppie di trading che possono essere utilizzate con il sistema oltre a XAUUSD, che amplierà le tue possibilità di utilizzare questo sistema. TUTTI GLI INDICATORI DEL SISTEMA
PipFinite Breakout EDGE
Karlo Wilson Vendiola
4.93 (487)
The Missing Edge You Need To Catch Breakouts Like A Pro. Follow a step-by-step system that detects the most powerful breakouts! Discover market patterns that generate massive rewards based on a proven and tested strategy. Unlock Your Serious Edge Important information here www.mql5.com/en/blogs/post/723208 The Reliable Expert Advisor Version Automate Breakout EDGE signals using "EA Breakout EDGE" Click Here Have access to the game changing strategy that will take your trading to the next l
Altri dall’autore
Spread and Cost pips
Alexander Shienkov
5 (2)
It is another simple information indicator. This indicator shows the current spread of a financial instrument and the value of one point with a volume of 0.10 lot. About the Spread Spread is the difference between the Ask and the Bid price of an asset in the stock or currency exchange. Let's refer to Central Banks and currency exchange in these banks, in order to understand why Spread is so important in currency trading. In Central Banks, we always see the difference between the buying and the
FREE
Indicator of vertical lines on the timeframes М5 and М1. It draws the lines for the period of the current day and the previous day. This indicator visualizes visually shows the trader the beginning and end of the chart hour, as well as the past hourly periods, 30-minute and 5-minute chart intervals. The advantage provided by this indicator is that the trader using this indicator on a chart of a currency pair with the smaller timeframe will always be aware of when the new hour begins. On the con
FREE
Today is the Day
Alexander Shienkov
5 (3)
This simple information indicator shows the name of the current day and past working days, months and years. On the concept of time and timeframe It is common knowledge that a timeframe is a time interval considered in technical analysis of free financial markets, during which the price and other market data changes occur when the price charts are plotted. In the MetaTrader 4 trading terminal, these periods are separated by vertical dashed line, which can be enabled or disabled by simply pressi
FREE
High and Low Levels EMA Технический индикатор в помощь трейдеру. Однажды пришла идея при изучении индикатора Moving A verage ( MA ). Так как мувинги эти сглаженное, среднее значения цены за выбранный период, то как и у обычной цены и у мувинга должны быть «хаи и лои». Данный индикатор, показывает уровни High и Low . Динамических уровней поддержки и сопротивления. О понятии High и Low . Хай  — от английского  high  — обозначает наиболее высокую цену («рынок на  хаях » — капитализация актив
FREE
Opening Candle Time
Alexander Shienkov
5 (1)
A simple information indicator showing the time left before the opening of the next candlestick or bar. About the concept of a timeframe A timeframe is the time interval considered in the technical analysis of free financial markets (the same applies to the global currency market), during which the price and other market data change. The smallest timeframe is the so-called tick. A timeframe is the time interval used to group quotes when drawing elements of a price chart (bars, Japanese candlest
FREE
ATR info panel
Alexander Shienkov
5 (1)
Индикатор таблица, постоянно меняющихся значений, пройденных ценой пунктов от начало дня (D1) , от начала недели (W1) и от начала текущего месяца (MN) . Индикатор также показывает средний дневной АТР за выбранный период. Параметры всей таблицы регулируются. Перемещение по осям монитора, для расположения в удобном месте, цвета текстов и заполнений ячеек, размеры столбцов, строк, цифр и текстов. Пользоваться можно на белом и тёмном фоне. По индикатору трейдер может легко определить настроение на р
Indicator of the Margin Call, Stop Out and Plus 100 (one hundred percent of profit to the deposit) levels. It has been designed to better visualize and maintain money management when trading financial instruments. The levels drawn by the indicator have different colors. They visualize the price range, at which a broker generates a notification (Margin Call) and force closes the deals (Stop Out) due to the shortage of funds on the account, in case the price goes against the positions opened by a
An indicator of round levels. A range of important price levels with sound and text alerts, which are generated when the current Bid price of a currency pair is equal to a round number. This indicator visually shows the trader true support and resistance levels, which are used by most of traders and trading robots. The advantage provided by this indicator is that the trader using this indicator on a chart does not need to draw any additional levels. Round price levels represent a certain barrier
Doji Marker Point
Alexander Shienkov
This indicator shows the levels and signal dots of the Doji pattern. The indicator allows traders to easily determine possible location of a price rebound. Doji is a candlestick with Open and Close price equal, or almost equal. It should also have shadows of approximately the same size on both sides. Doji denotes the balance between buyers and sellers, or the absence of major players, or level testing. This pattern can mean both a reversal and a continuation of the trend. Indicator Parameters I
This indicator visualizes the intersection of two moving averages. (SМА, EMA, SMMA, LWMA). It has been created for visibility of signals and notification about intersections of Moving Average. Moving Average is simply the averaged value of the price for the selected timeframe (TF). Therefore, the moving averages are used on a wide variety of timeframes, from 1 minute to a year and even decades. Possible types of moving averages in the indicator SMA (Simple Moving Average); EMA (Exponential Movi
This indicator visualizes the intersection of two moving averages in the MACD oscillator. It uses the histogram color to signal about the moving averages crossing the zero level of the indicator. The MACD (Moving Average Convergence/Divergence) indicator is a popular oscillator actively used by traders when working in the currency and stock markets to determine trends and to search for trading signals. This linear indicator allows obtaining a variety of trading signals: crossing the zero line; d
Folding meter 4 Trend Lines
Alexander Shienkov
4.5 (2)
Folding rule of 4 trend lines The indicator has been created based on the "Folding rule" trading strategy. It shows four pairs of inclined resistance and support lines. These lines are plotted based on the nearest High and Low of the ZigZag technical indicator with four given input parameters. The indicator draws dots above and below the price extremums that have been used for plotting the trend lines. The indicator of trend lines facilitates the plotting of trend lines, channels and technical p
Kiss III EMA
Alexander Shienkov
Индикатор динамического уровня сопротивления и поддержки Moving Average. Визуально показывает момент прикосновение цены Bid , одной или трёх скользящих средних с   заданными во входных параметрах свойствами. Создан для наглядности сигналов и оповещения состоявшегося пересечения (прикосновения) цены Bid и Moving Average. Скользящая средняя — это просто усредненное значение цены за выбранный период времени, он же таймфрейм (ТФ). Именно поэтому скользящие используются на самых разнообразных ТФ,
Open High Low Close Внешняя Свеча Индикатор внешних свечей наложенных на график с выбранными вами тайм фреймом. Наглядно отображаете уровни OHLC и пройденное значение ATR текущей свечи и свечей в истории. OHLC — аббревиатура, дословно расшифровывается как: O — open (цена открытия интервала (бара или японской свечи)). H — high (максимум цены интервала). L — low (минимум цены интервала). C — close (цена закрытия интервала). Данный индикатор наглядно покажет трейдеру, уровень открытия, закрыт
ATR Sessions Pips
Alexander Shienkov
Ещё один простой информационный индикатор, показывающий самые важные торговые сессии валютного рынка. О понятии торговых сессий. Всем известно, что торговая сессия – это промежуток времени, в течение которого банки и другие участники рынка ведут активную торговлю, при этом активизируются   в определённые часы рабочего дня. Валютный рынок, рынки акций и сырьевые рынки   работают круглосуточно с понедельника по пятницу, кроме праздничных дней. Когда в одной стране ещё спят, в другой рабочий ден
Risk Manager VT
Alexander Shienkov
Risk Manager VT Робот - помощник, от команды VT. О рискменеджменте в торговле: Грамотный риск менеджмент в трейдинге – это залог успеха при решении основных Ваших задач, при активной ручной торговле, на биржевом рынке: дисциплина и контроль эмоций! Данный помощник поможет вам с лёгкостью ограничивать риски на каждую сделку, и правильно выставить уровни прибылей. Те кто долго торгуют, на валютном рынке, уже знают, что правильное соотношение риск/прибыль, является эффективным инструментом в
Open Day and ATR
Alexander Shienkov
Информационный индикатор, показывающий самые важные торговые уровни для внутридневной торговли, и не только. О понятии уровней «Поддержка» и «Сопротивление». Всем известно, что исторический ценовой диапазон цен состоит из уровней от которых в прошлом, были значимые движения. И уровни работающие в прошлом, наверняка будут работать и сейчас. К примеру, уровень, находящийся снизу текущей цены является уровнем «Поддержки», если от него ранее было значительное движение. К примеру, уровень, нах
History VT
Alexander Shienkov
History VT Информационный индикатор. Показывает на графике, сразу после открытия сделки, стрелку именно на той японской свече, где позиция открыта. То есть там, где появилась штрихпунктирная линия открытой сделки, в терминале. Далее, после открытия сделки, как обычно, трейдер ставит SL и TP  и ждёт итога своего выбора направления движения. После того как сделка закрылась, по « sl » или « tp » или «вручную», индикатор отображает на графике уровни и текстовые сноски параметров сделки. Сноски
Auto Multi Channels VT Ещё один технический индикатор в помощь трейдеру. Данный индикатор, автоматически показывает, наклонные каналы в восходящем, нисходящем и боковом движении цены, т.е. тренды. (Внутри дня. Среднесрочные и долгосрочные, а также Восходящие, нисходящие и боковые). О понятии Тренд. На бирже, трендом называется  направленное движение ценового графика в одну из сторон (вверх или вниз) . То есть, тренд в трейдинге — это ситуация, когда цена определенное время возрастает или сниж
Old Time Frame EMA
Alexander Shienkov
Old Time Frame EMA   Индикатор двух динамических уровней сопротивления и поддержки Moving Average. Данный индикатор рисует на открытом графике младшего тайм фрейма, ЕМА со старшего тайм фрейма.   Создан для наглядности сигналов, для входа в рынок, для тех трейдеров, у кого Средние Скользящие Цены (ЕМА или МА), являются основным сигналом для открытия или закрытия сделок. А также ориентиром, направлением тренда в движении текущих цен, внутри дня и в среднесрочной торговле. Возможные типы сред
Filtro:
_Striker_
161
_Striker_ 2024.06.12 10:55 
 

L'utente non ha lasciato alcun commento sulla valutazione.

Alexander Shienkov
6930
Risposta dello sviluppatore Alexander Shienkov 2024.06.12 13:11
Благодарю! Попутного тренда в рынках, и в жизни в целом!
Coreentrades
188
Coreentrades 2024.06.03 09:03 
 

L'utente non ha lasciato alcun commento sulla valutazione.

Alexander Shienkov
6930
Risposta dello sviluppatore Alexander Shienkov 2024.06.03 18:44
tnk/
Rispondi alla recensione