Volatility Atlas
- Indicatori
- Versione: 1.0

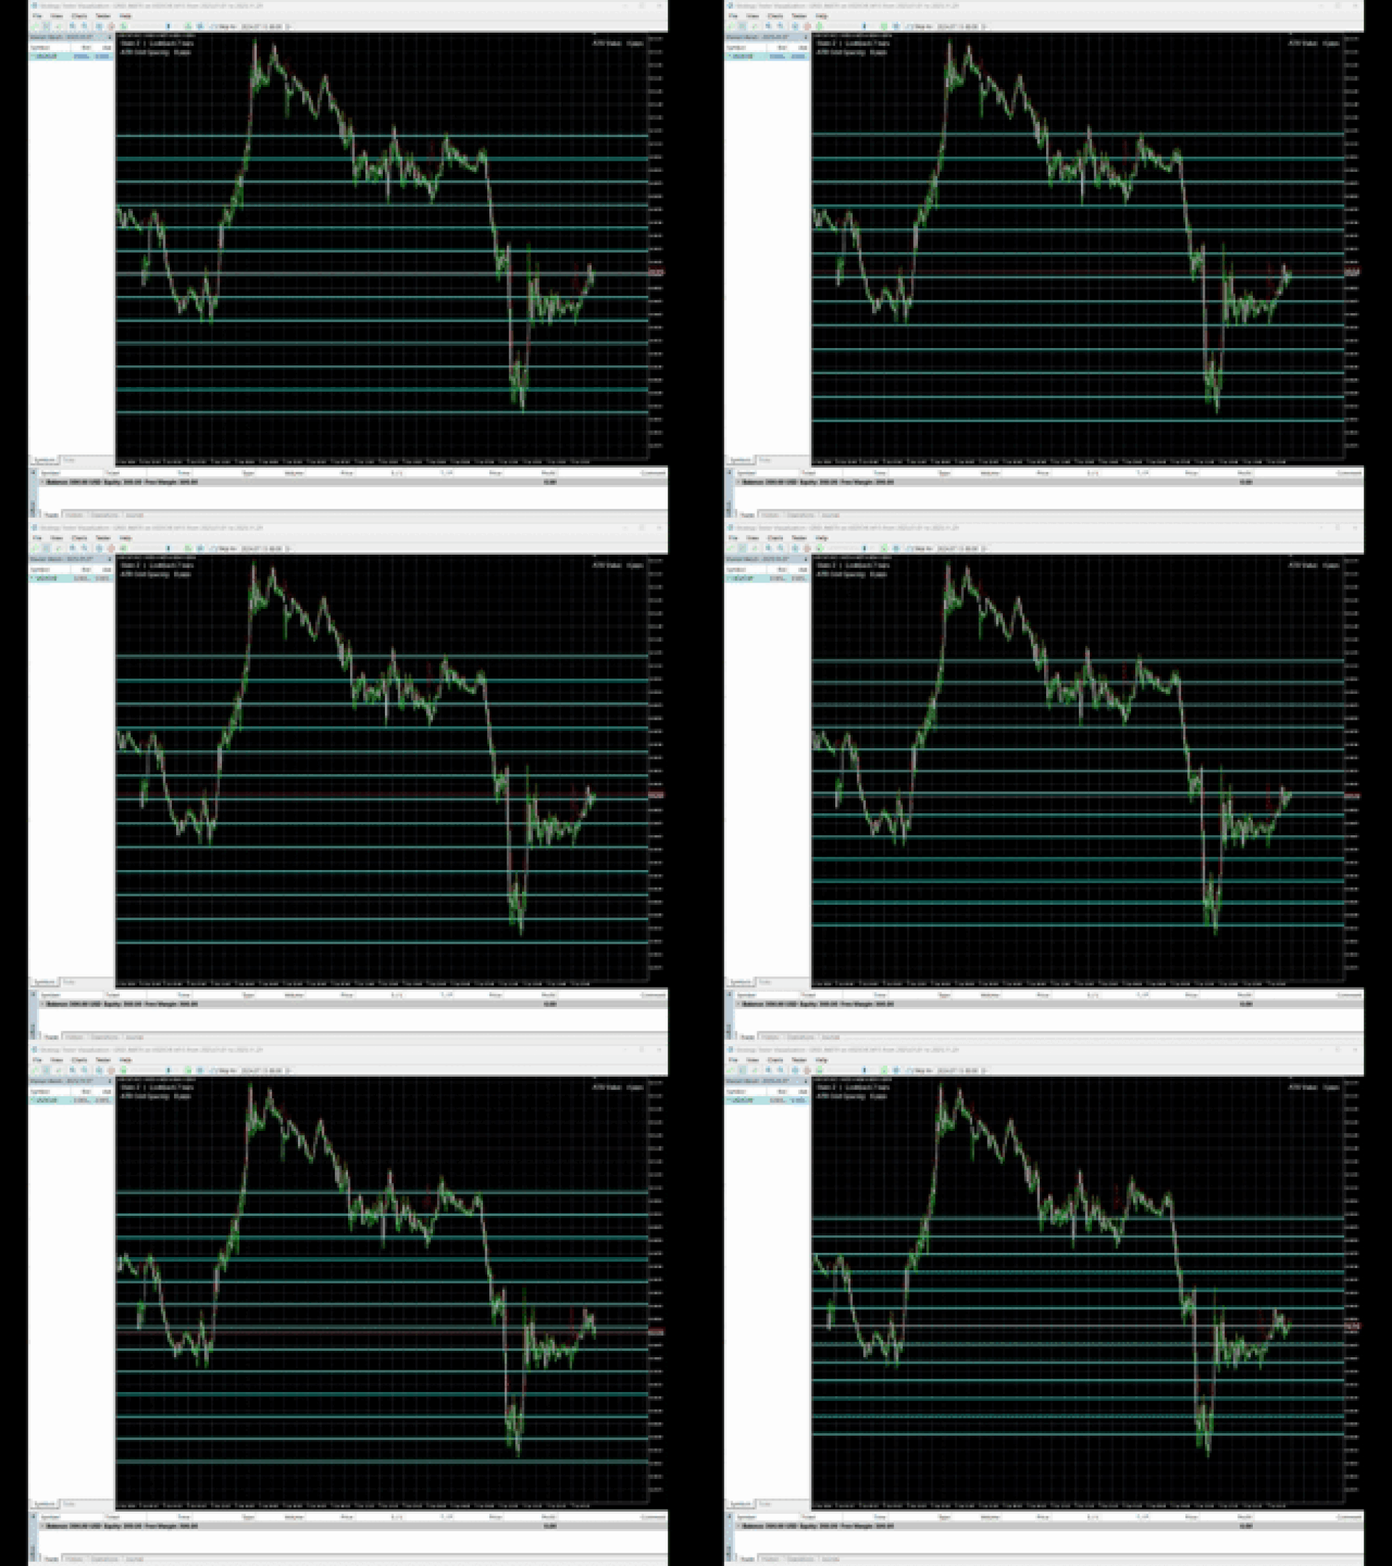
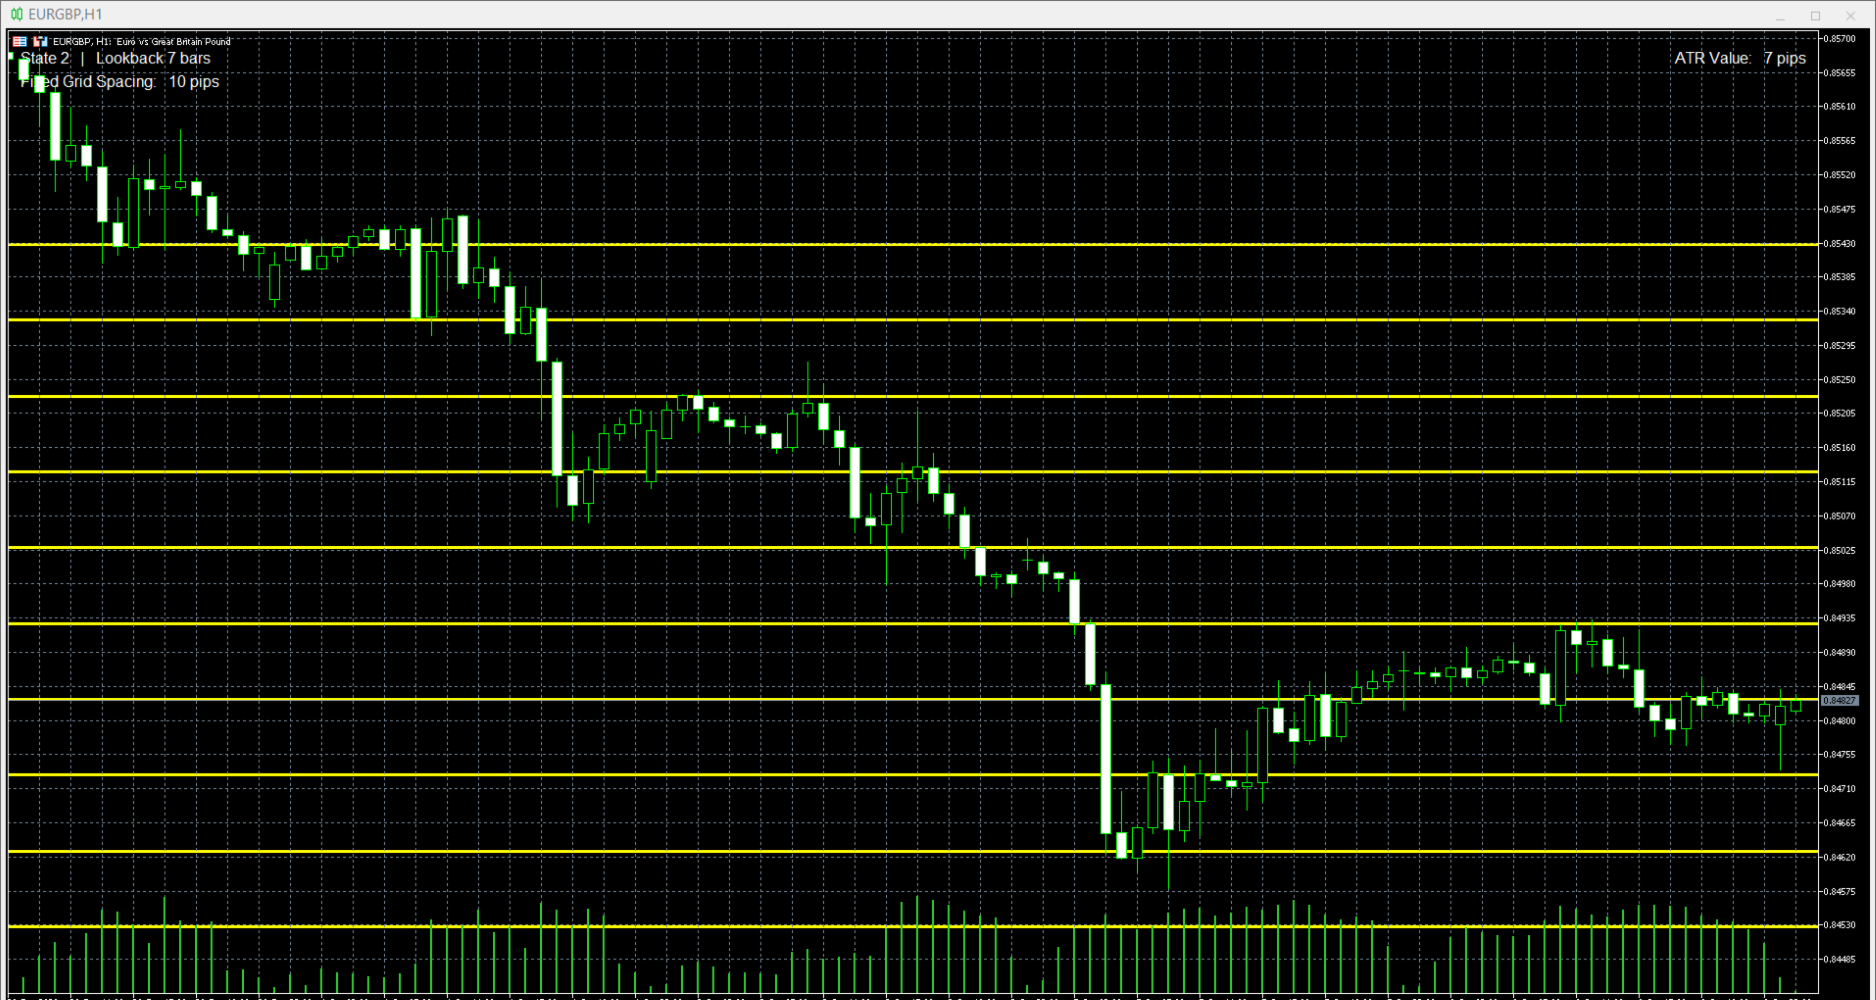
motive is to turn market volatility and selected time/session reference points into a visual price grid. Instead of claiming to predict price direction, it gives the trader a structured way to judge where current price sits relative to ATR-derived or fixed-distance ranges.
Potential
- Volatility awareness: ATR-based spacing expands and contracts with measured price volatility.
- Price-range context: Multiple grid levels show how far price has traveled from a reference point.
- Session analysis: The four states provide different reference frameworks, including previous forex sessions, previous candles, 12-hour cycles, and the most recent London session.
- Potential extension/reversal context: Price reaching an outer grid can identify a market that has traveled substantially relative to the selected range.
- Custom analysis: Traders can choose ATR or fixed-pip spacing, lookback periods, multipliers, number of lines, and calculation timeframe.
- Strategy compatibility: It can complement trend, structure, price action, support/resistance, or other analytical methods rather than replacing them.
Limitations
- It does not predict direction. ATR measures volatility/range, not whether price will rise or fall.
- Grid lines are not guaranteed support or resistance. A line becomes more meaningful only when supported by independent market evidence.
- A grid touch is not a trade signal. Price can pass through, reject, or remain around a grid level.
- Higher ATR does not prove higher trading participation or volume. It indicates greater price movement.
- No profitability is guaranteed. The grid should be treated as an analytical framework, not a standalone trading system.
- Results depend heavily on the selected state, timeframe, ATR settings, and market conditions.
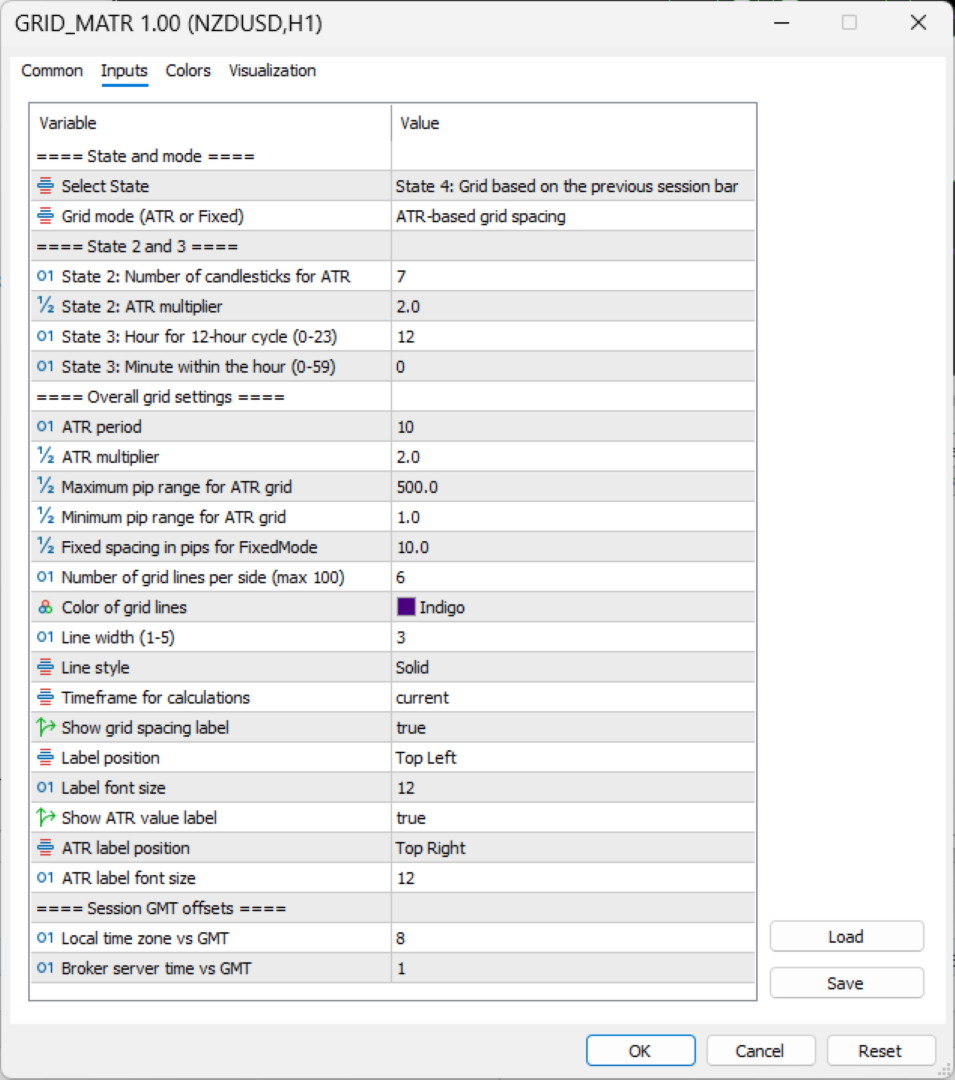
| Variable | Value | Function / Purpose |
|---|---|---|
| SelectState | State4 | Selects the reference framework used to establish the grid. State 4 uses the most recent London trading session. |
| SelectGrid | ATRMode | Chooses between volatility-based ATR spacing and a fixed pip-distance grid. |
| LookbackPeriod | 7 | State 2 only: number of previous candlesticks used to calculate the ATR reference. |
| lb_range_mltpr | 2.0 | State 2 only: multiplier applied to the calculated ATR range, controlling how widely the grid is spaced. |
| Hour_ | 12 | State 3 only: establishes the starting hour of the 12-hour cycle. |
| Minutes | 0 | State 3 only: establishes the starting minute of the 12-hour cycle. |
| atr_period | 7 | General ATR calculation period. Determines how many candles are considered when measuring volatility. |
| atr_mult | 2.0 | Multiplies the ATR measurement to determine the distance between grid levels. |
| atr_maxpips | 500 | Caps the maximum ATR-derived grid range so unusually large volatility does not create excessively wide spacing. |
| atr_minpips | 1 | Establishes the minimum ATR-derived range so extremely low volatility does not produce impractically small spacing. |
| fixed_spacing_pips | 50.0 | Determines the distance between grid levels when FixedMode is selected instead of ATR mode. |
| lines_count | 6 | Number of grid lines drawn on each side of the reference level. |
| lines_color | Indigo | Controls the color of the grid lines. |
| lines_width | 3 | Controls the thickness of the grid lines. |
| lines_style | STYLE_SOLID | Controls whether grid lines are solid, dashed, dotted, etc. |
| tf | PERIOD_CURRENT | Timeframe used for the indicator's calculations. PERIOD_CURRENT means the chart's current timeframe. |
| ShowStateLabel | true | Shows or hides the label identifying the currently selected grid state. |
| ShowGridSpacing | true | Shows or hides the calculated spacing between grid levels. |
| LabelPosition | TopLeft | Determines where the state and grid-spacing information is positioned on the chart. |
| LabelFontSize | 12 | Controls the font size of the state and grid-spacing labels. |
| LabelColor | clrWhite | Controls the color of the state and grid-spacing text. |
| LabelXOffset | 8 | Horizontal pixel distance between the label and its selected chart edge. |
| LabelYOffset | 18 | Vertical pixel distance between the label and its selected chart edge; also helps keep it clear of chart information. |
| LabelLineGap | 6 | Adds vertical separation between stacked information labels to prevent overlap. |
| ShowATRValue | true | Shows or hides the current ATR value on the chart. |
| ATRLabelPosition | BottomLeft | Determines where the ATR-value label appears. |
| ATRLabelFontSize | 12 | Controls the ATR-value label's font size. |
| ATRLabelColor | clrWhite | Controls the ATR-value label's color. |
| LocalGMT | 8 | Defines the user's local GMT offset for converting session times. |
| BrokerGMT | 1 | Defines the broker's MT4 server-time GMT offset so the indicator can align its session calculations correctly. |