Trader Diary
- Utilità
- Versione: 3.21
- Attivazioni: 5

Trader Diary is an AM QuantLab expert advisor for MetaTrader 5. It reads trades that are already closed and shows how the period turned out. It does not place orders or close positions.
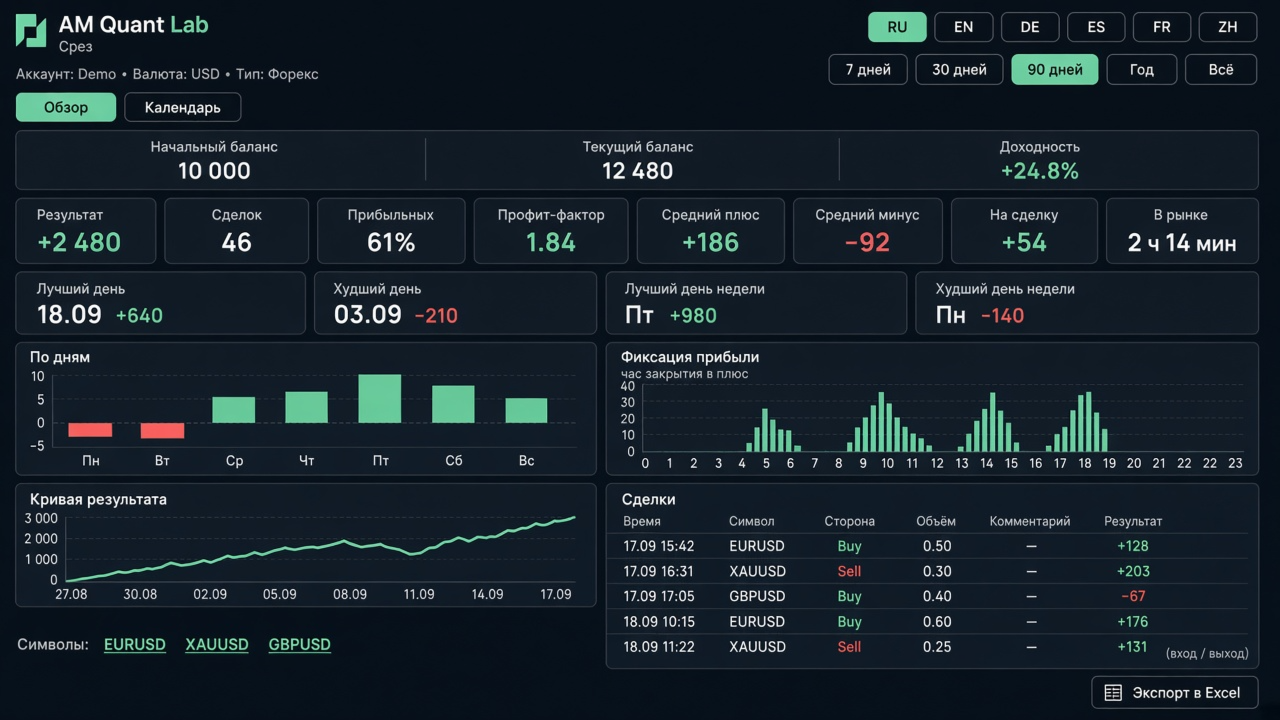
After launch it opens in its own full-screen window, off the price chart. Periods: 7 days, 30 days, 90 days, or one year. Languages: Russian, English, German, Spanish, French, and Chinese.
Overview. Twelve cards: result, number of trades, win rate, profit factor, average win, average loss, result per trade, time in the market, best and worst day (date as 18.09), best and worst weekday. If there is only one day or one weekday, the second card shows a dash.
Charts. Seven columns from Monday to Sunday: a profitable day is green; if there are more losing trades, the column is red. “Profit taken” groups winning trades by the hour they were closed. Below that: the cumulative equity curve and a symbol list with result, trade count, and win rate.
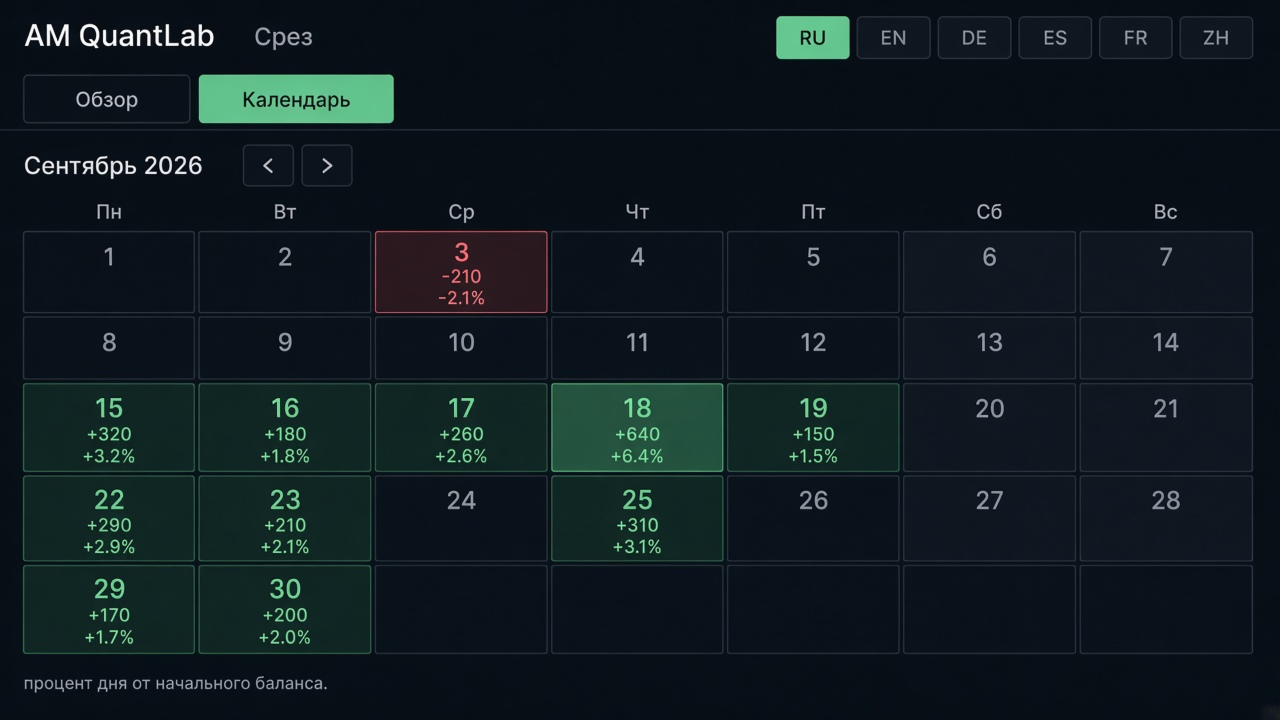
Calendar. Each day of the month shows the result and that day’s percent of the starting balance. Months can be flipped.
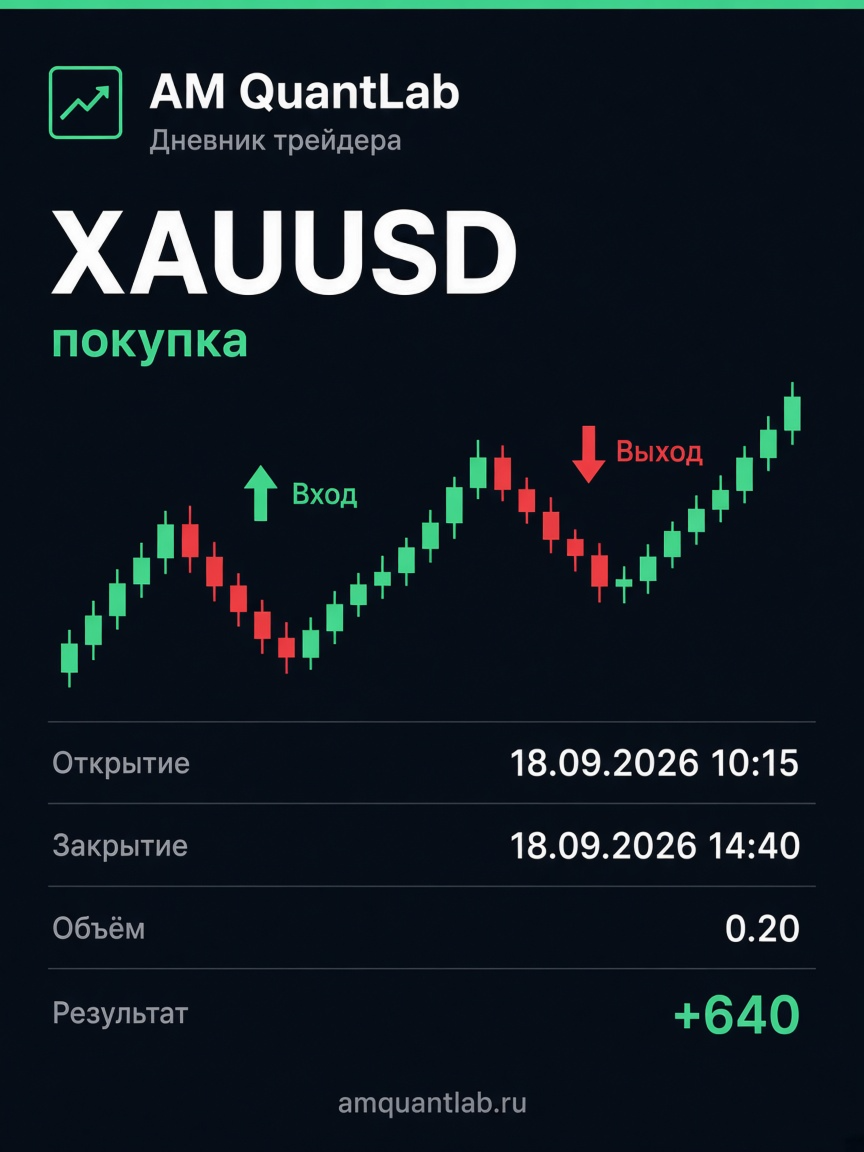
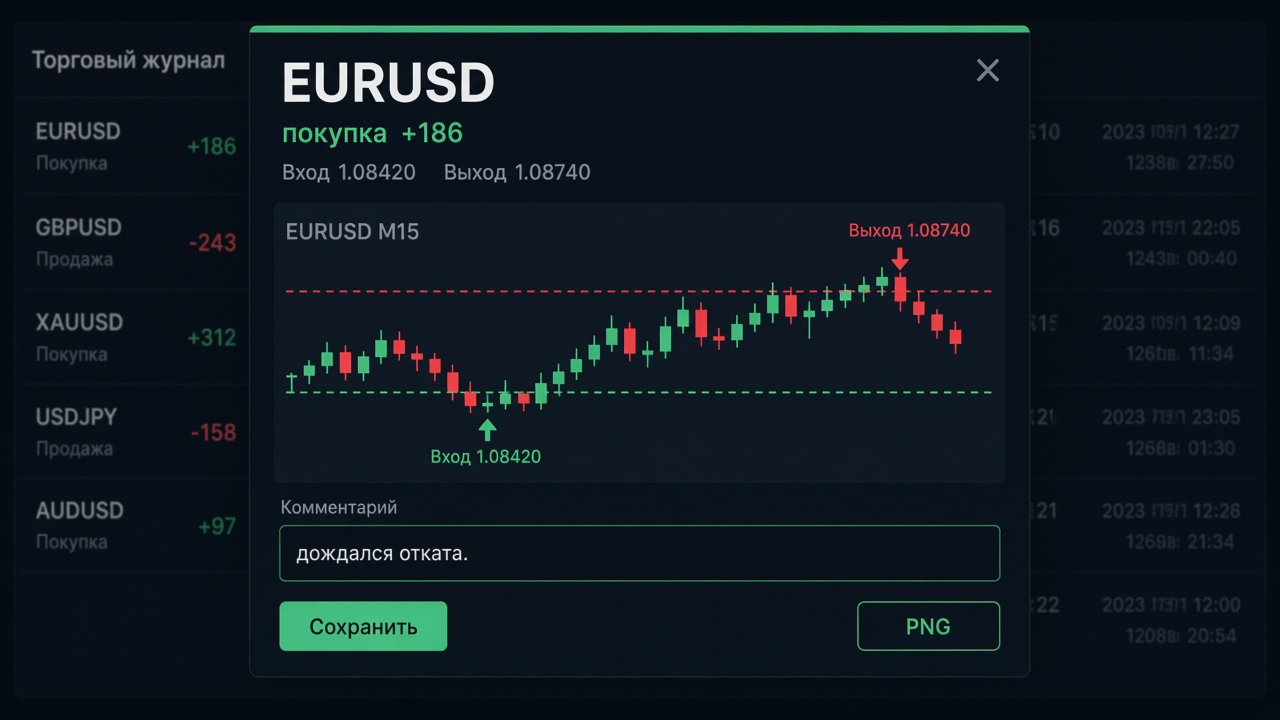
A trade. Click a row to open that trade’s candles: a buy is a green arrow up, a sell is a red arrow down. Closing a buy is a red arrow; closing a sell is a green arrow. A comment can be saved on the row. PNG saves a trade card to a chosen folder: symbol, side, entry and exit chart, time, volume, and result. The picture does not include the percent of starting balance, the comment, or the account number. The footer is amquantlab.ru.
Excel. The period’s list exports to .xls: close, open, symbol, side, volume, result, currency, and note.
Click a symbol name to open every entry and exit of that symbol for the selected period.