Fabii Memory Support Resistance

Smetti di indovinare quali zone di supporto e resistenza contano: ognuna mostra quante volte il prezzo l'ha testata. No repaint.
Qualsiasi coppia, qualsiasi timeframe. Sul tuo grafico in 2 minuti. Test gratuito nello Strategy Tester.


Get more indicators here
Baselines, volatility filters and oscillators. No repaint.


Perché ti serve

Disegni supporto e resistenza a mano, e due trader non disegnano mai gli stessi livelli sullo stesso grafico. Non sai quali livelli meritano la tua attenzione. Metti uno stop dietro un livello che il prezzo non ha mai rispettato e lo scopri solo quando si rompe.

Cosa ottieni

Fabii Memory Support Resistance disegna zone di supporto e resistenza da una regola e conta quante volte il prezzo ha testato ciascuna, così smetti di indovinare quali livelli contano.

  • Ogni zona nasce da una regola e non dal tuo occhio, così tu e un altro trader vedete gli stessi livelli.
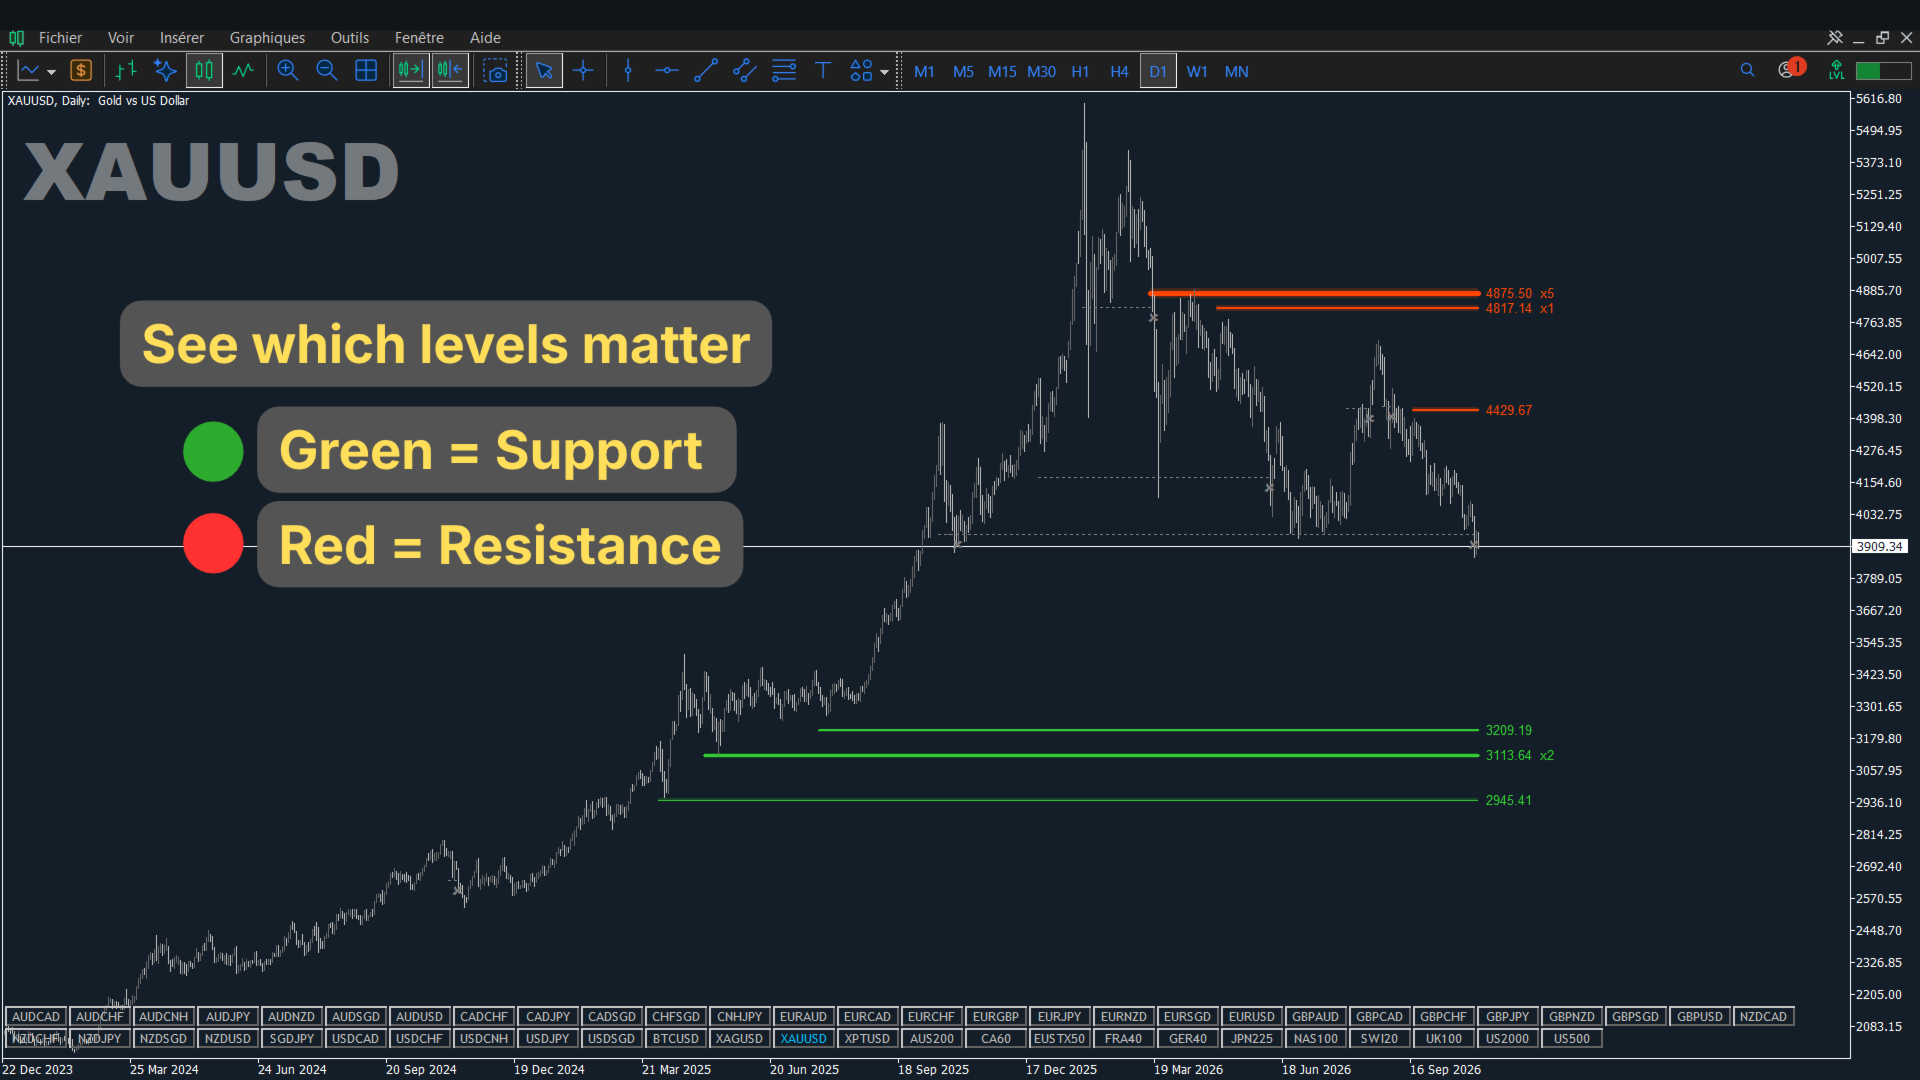
  • Ogni livello mostra un conteggio dei tocchi (per esempio x3) e una linea più spessa quanto più viene testato, così vedi a colpo d'occhio quali livelli il prezzo ha rispettato di più.
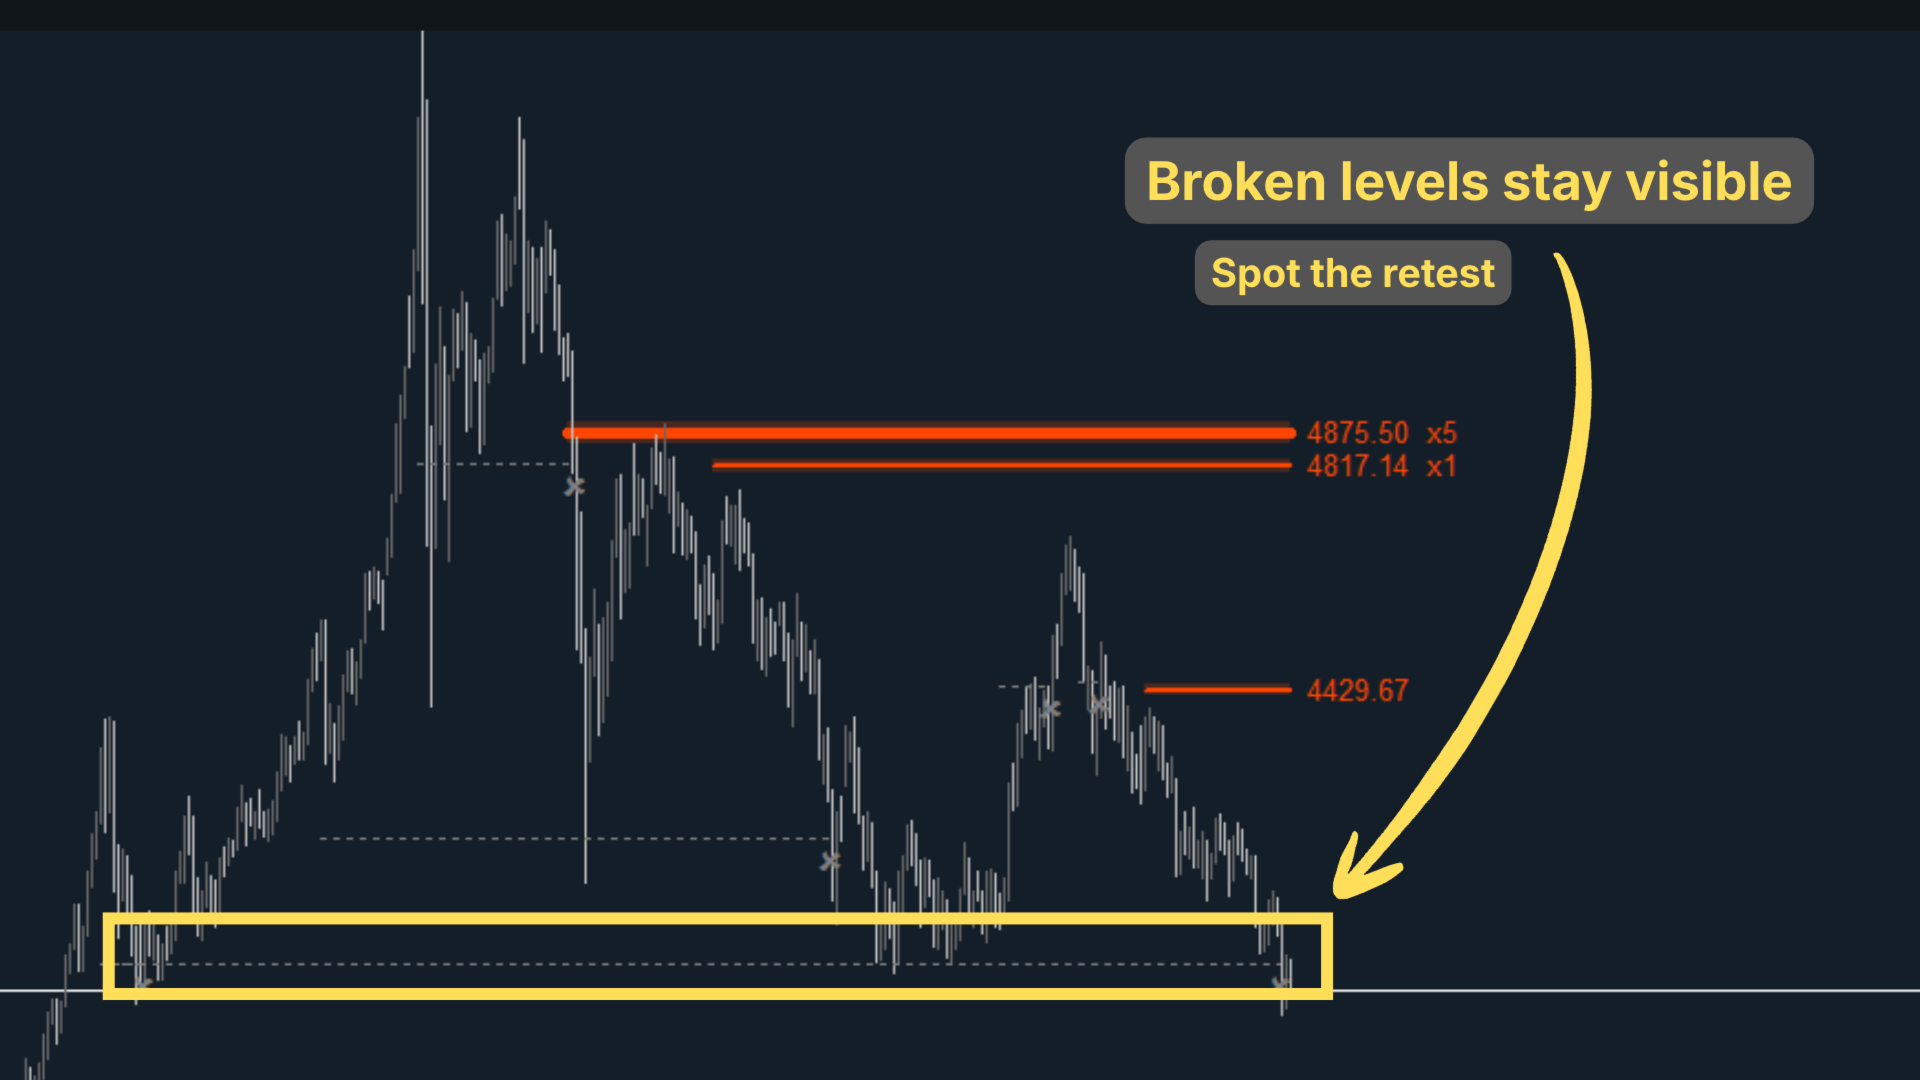
  • Le zone verdi stanno sotto il prezzo e quelle rosse sopra. Un livello rotto diventa una linea grigia tratteggiata che termina sulla candela della rottura, così il grafico resta leggibile.
  • Avvisi per un nuovo livello, una rottura, un retest di un livello rotto e, se vuoi, un tocco, così non devi guardare il grafico.
  • Cinque buffer per il tuo Expert Advisor: supporto più vicino, resistenza più vicina, un punteggio di forza per ciascuno e l'evento della candela, così puoi costruire le tue regole.

Come funziona

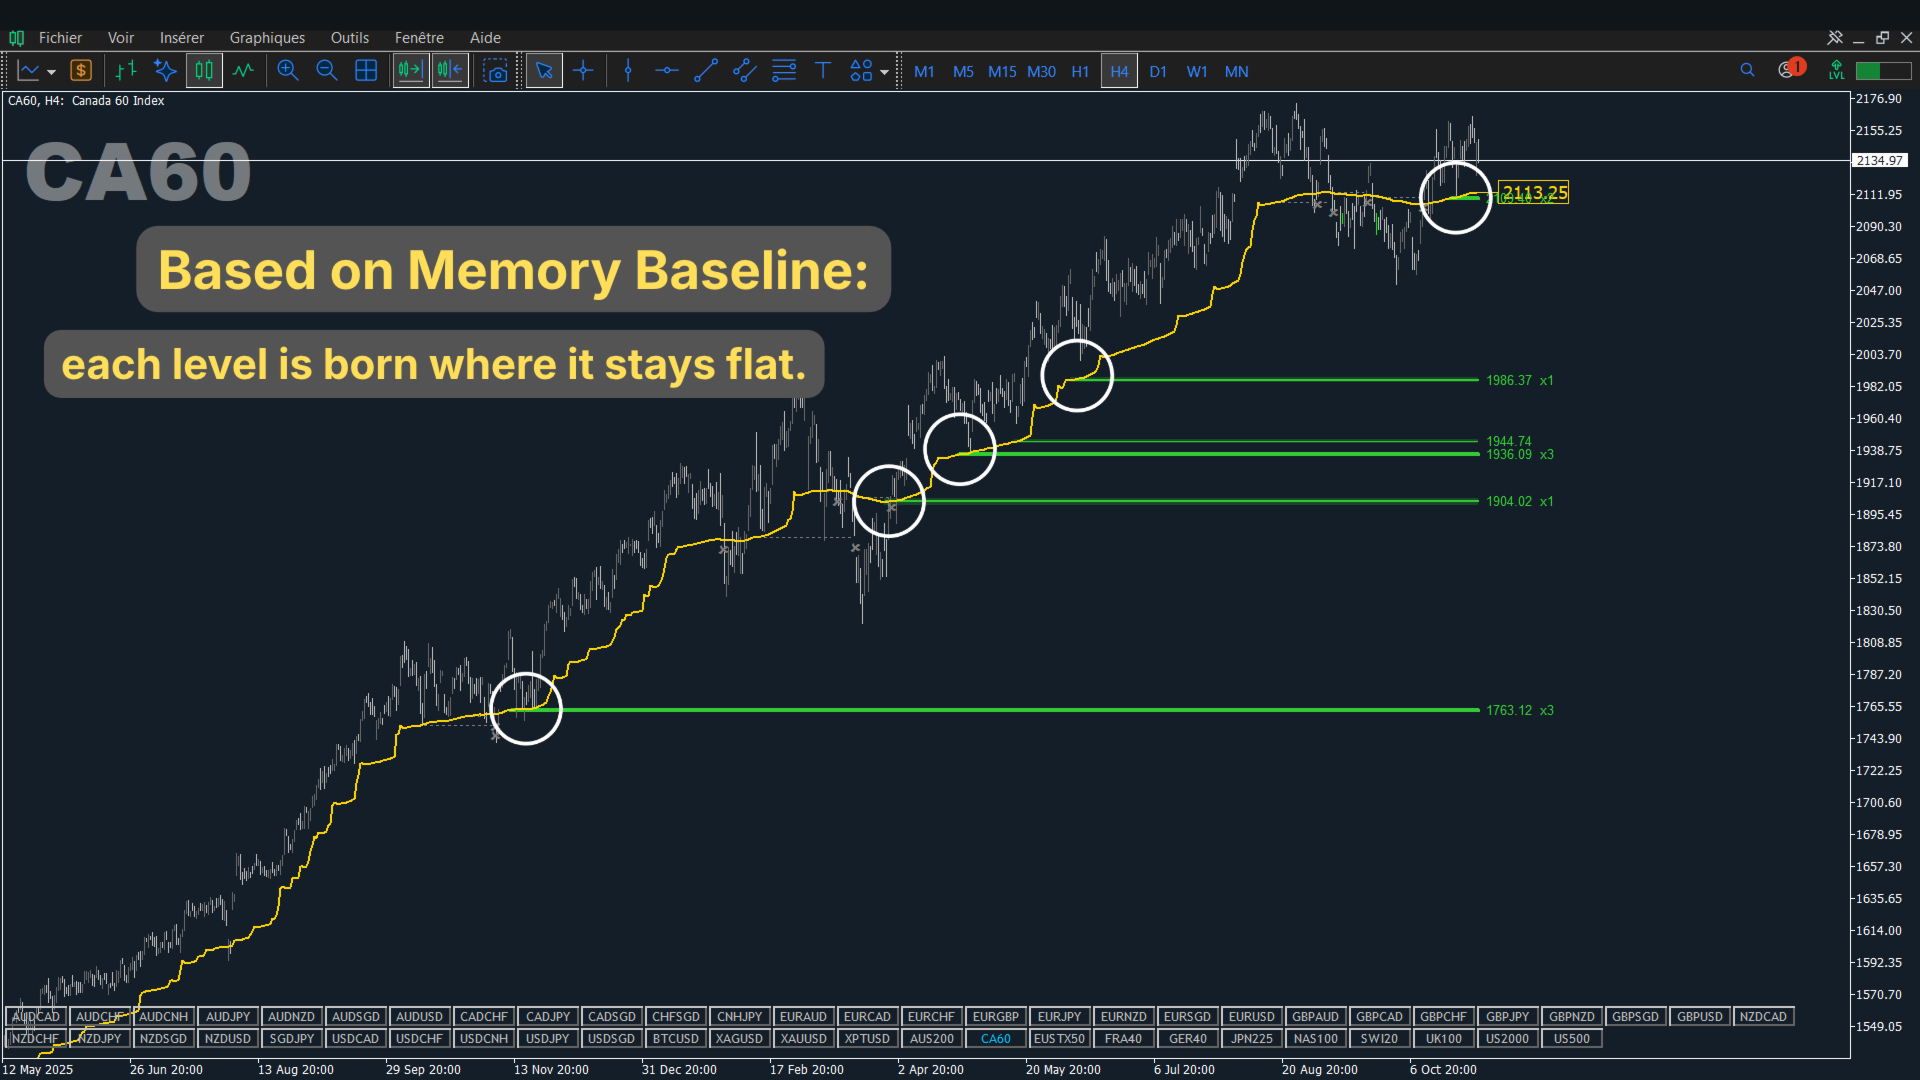
L'indicatore parte dalla Memory Baseline, una media mobile adattiva che resta quasi piatta finché il prezzo non la spinge abbastanza. Quando la baseline varia meno di 0,10 volte l'Average True Range (ATR) per almeno 5 candele chiuse, quel plateau diventa un livello al valore della baseline. È un supporto se il prezzo chiude sopra e una resistenza se chiude sotto. Una candela che chiude oltre il livello di 0,25 volte l'ATR lo rompe, e il livello resta come linea grigia tratteggiata fino a quella candela. Un nuovo livello entro 0,50 volte l'ATR da uno esistente dello stesso tipo aggiunge un tocco a quello esistente, invece di creare un duplicato. I livelli usano solo candele chiuse.

Come usarlo

  1. Applica l'indicatore a qualsiasi grafico.
  2. Leggi i colori: il verde sotto il prezzo è un supporto, il rosso sopra è una resistenza, e il numero dopo il prezzo indica quante volte il prezzo l'ha testato.
  3. Aspetta che il prezzo raggiunga una zona e agisci solo quando una candela chiude allontanandosi da essa, con lo stop dall'altra parte della zona.
  4. Una croce grigia segnala una rottura. Se il prezzo torna su quel livello, l'avviso di retest ti informa.

Impostazioni principali

Setting What it does Default
Base MA period Length of the moving average behind the baseline 200
Plateau minimum length (closed bars) Bars the baseline must stay flat before a level exists; fewer bars give more levels 5
Break = close beyond level by x ATR How far a close must go beyond a level to break it 0.25
Zone half-width / touch distance (x ATR) Half-height of the zone and the distance that counts as a touch 0.10
Active levels shown (nearest to price) How many levels are drawn, nearest first 6
Alert on new level / break / retest / touch Choose the events, then pick popup, sound or push Touch off; no channel on

Le altre impostazioni controllano colori, zone, etichette, marcatori e il file audio.

Provalo prima di decidere

No repaint puoi verificarlo tu stesso. Lascia chiudere una candela e controlla che i valori del Data Window del supporto e della resistenza più vicini per quella candela non cambino. Per testarlo: apri lo Strategy Tester, seleziona questo indicatore ed eseguilo in modalità visuale sulla tua coppia e sul tuo timeframe.

Gli aggiornamenti sono gratuiti. Ogni versione è elencata nella sezione What's new di questa pagina, così sai sempre cosa è cambiato.

Fabii Memory Baseline è un indicatore separato che mostra la baseline stessa, con una sovrapposizione di un timeframe superiore e avvisi propri. Fabii Memory Distance Oscillator è un indicatore separato che mostra, in una sottofinestra, quanto il prezzo è lontano dalla baseline. Segui il mio profilo per essere avvisato quando vengono pubblicati nuovi indicatori.

Ottienilo e guarda i tuoi primi livelli sul tuo grafico. Fabii Memory Baseline aggiunge la linea della baseline e una sovrapposizione di un timeframe superiore.

Commenti e recensioni

Domande? Pubblica un commento su questa pagina o scrivimi e ricevi una risposta entro 24 ore.

Se ti fa risparmiare tempo, una breve recensione che indichi quale coppia e quale timeframe usi aiuta altri trader a trovarlo.

I risultati passati non prevedono i risultati futuri. Questo indicatore non fornisce consulenza finanziaria.
Altri dall’autore
Fabii Universal Trend Baseline
Fabien Georges Andre Guillemaud
Prova 18 baseline su un solo grafico e tieni quella che si adatta al tuo mercato. Un menu, una logica. No repaint. Qualsiasi coppia, mercato e timeframe. Demo gratuita nello Strategy Tester. Get more indicators here Baselines, volatility filters and oscillators. No repaint. Perché ti serve La baseline che va bene su una coppia ritarda su un'altra, o salta in laterale. Cambiarla significa caricare un altro indicatore e rifare il grafico. Così tieni una baseline che non si adatta al tuo mercato
Fabii Half Trend Baseline
Fabien Georges Andre Guillemaud
Smetti di operare contro il trend del timeframe superiore. Due baseline, un grafico. Senza repaint. Qualsiasi coppia, qualsiasi timeframe. Sul tuo grafico in 2 minuti. Demo gratuita nello Strategy Tester. Get more indicators here Baselines, volatility filters and oscillators. No repaint. Perché ti serve Entri in un trade perché una linea è diventata verde sul tuo grafico. Poi apri un timeframe superiore e vedi che il trend più grande punta nella direzione opposta. Il segnale era reale. Il tre
Fabii Memory Distance Oscillator
Fabien Georges Andre Guillemaud
Guarda quanto il prezzo si è allontanato dalla linea base e quando inizia a tornare. Un istogramma, una lettura. No repaint. Qualsiasi coppia, qualsiasi timeframe, qualsiasi mercato. Sul tuo grafico in 2 minuti, gratis. Get more indicators here Baselines, volatility filters and oscillators. No repaint. Perché ti serve Vedi un movimento forte e vuoi entrare. Il prezzo è già lontano dalla sua media, entri tardi e il mercato arretra subito dopo. Oppure aspetti un ritracciamento e non sai disting
FREE
Fabii Vwap SSL Baseline
Fabien Georges Andre Guillemaud
Smetti di indovinare quale incrocio del VWAP conta: una linea colorata mostra il tuo lato. No repaint. Qualsiasi coppia. Ancoraggio giornaliero, settimanale o mensile. Sul tuo grafico in 2 minuti. Test gratuito nello Strategy Tester. Get more indicators here Baselines, volatility filters and oscillators. No repaint. Perché ti serve La maggior parte dei trader legge il prezzo medio ponderato per il volume (VWAP) come una semplice linea e discute ogni tocco. Questa baseline mostra invece un lat
FREE
Fabii Essential Trend Baseline
Fabien Georges Andre Guillemaud
Smetti di entrare su inversioni di tendenza senza momentum. Una linea, un grafico, nessun secondo indicatore. No repaint. Qualsiasi coppia, mercato e timeframe. Sul tuo grafico in 2 minuti. Test gratuito nello Strategy Tester. Get more indicators here Baselines, volatility filters and oscillators. No repaint. Perché ti serve Entri perché la linea è diventata verde. Il prezzo va alla deriva per dieci candele e poi si inverte. Il segnale era reale, ma il momentum no. Ogni ingresso su un'inversi
FREE
Fabii Volatility Bias
Fabien Georges Andre Guillemaud
Scopri quale lato, rialzista o ribassista, guida la volatilità in un unico istogramma centrato sullo zero. No repaint. Qualsiasi mercato, qualsiasi timeframe. Sul tuo grafico in 2 minuti. Demo gratuita nello Strategy Tester. Get more indicators here Baselines, volatility filters and oscillators. No repaint. Perché ti serve Un movimento sembra forte: candele verdi, prezzo in salita. Ma non sai se lo sostiene una vera volatilità rialzista, o se sale a piccoli passi mentre le oscillazioni più gr
Fabii Rsx Ema Oscillator
Fabien Georges Andre Guillemaud
Smetti di indovinare quando il momentum gira: una linea RSX fluida e un incrocio di segnale te lo mostrano. No repaint. Qualsiasi coppia, qualsiasi timeframe. Sul tuo grafico in 2 minuti. Demo gratuita nello Strategy Tester. Get more indicators here Baselines, volatility filters and oscillators. No repaint. Perché ti serve Guardi un oscillatore di momentum e ogni tocco della linea di segnale sembra un'inversione. La linea salta da candela a candela, l'istogramma cambia colore con piccoli movi
Fabii Atr Volatility Zones
Fabien Georges Andre Guillemaud
Scopri se la volatilità di ogni candela è bassa, media o alta per questo mercato, in tre colori. No repaint. Qualsiasi coppia, qualsiasi timeframe, qualsiasi mercato. Sul tuo grafico in 2 minuti. Gratis da provare nello Strategy Tester. Get more indicators here Baselines, volatility filters and oscillators. No repaint. Perché ti serve La stessa ampiezza significa cose diverse su mercati diversi e in momenti diversi. Guardi l'ultima candela e non sai dire se la sua ampiezza è grande o piccola
FREE
Fabii Yang Zhang Volatility Filter
Fabien Georges Andre Guillemaud
Scopri quando la volatilità basta per operare — dal vivo, senza repaint, su qualsiasi coppia. Qualsiasi coppia, qualsiasi timeframe. Le linee si fissano alla chiusura della candela. Demo gratuita nello Strategy Tester. >> Get more free and premium indicators here Baseline, volatility, oscillators and more. No repainting. No guessing. Just clean signals. IL PROBLEMA Il tuo ingresso può essere giusto e non portare da nessuna parte. Con il mercato fermo, il prezzo va alla deriva, il rumor
Fabii Nma Ssl Channel
Fabien Georges Andre Guillemaud
Get a clear trend line that holds in trends and stays quiet in noise — no repaint. Any pair, any timeframe. Signals lock on bar close. Free to download. Test it in the Strategy Tester before using it live. >> Get more free indicators here Baseline, volatility, oscillators & more — free and premium. No repainting. No guessing. Just clean signals. THE PROBLEM Most SSL channels use a fixed-speed moving average. That means the line reacts the same whether price is trending hard or grindin
FREE
Fabii Adxvma Ssl Channel
Fabien Georges Andre Guillemaud
One clean trend line that follows the lows while the trend holds, and flips above price only when the move truly turns. No repaint. Any pair, any timeframe. Every flip is final on bar close. Try it free on your own charts in the Strategy Tester. >> Get more free indicators here Baseline, volatility, oscillators & more — free and premium. No repainting. No guessing. Just clean signals. THE PROBLEM Most trend lines flip too early. A classic SSL channel rides two simple moving averages,
FREE
Fabii Adaptive Trend Baseline
Fabien Georges Andre Guillemaud
Resta nella tendenza con una baseline che rallenta nel rumore e accelera nei movimenti. Cinque medie adattive. No repaint. Qualsiasi coppia, mercato e timeframe. Demo gratuita nello Strategy Tester. Get more indicators here Baselines, volatility filters and oscillators. No repaint. Perché ti serve Una media a velocità fissa ritarda in un movimento forte e salta nel rumore. Entri tardi, o entri su una piccola oscillazione. Nessuna delle due entrate corrisponde al mercato che operi. Ogni ingres
FREE
Fabii Ehlers Adaptive Bands
Fabien Georges Andre Guillemaud
Know exactly when the trend flips — before you miss the move. Signals lock on bar close, no repaint. Any pair, any timeframe. Free demo in the Strategy Tester. THE PROBLEM Most trend tools give you a direction — but they keep repainting until the bar closes, or they lag so far behind that the entry is gone by the time they confirm. You end up either chasing or sitting out clean moves. Every bar you misread the regime is a trade you size wrong or skip entirely. THE SOLUTION Fabi
FREE
Fabii NNFX Atr Levels
Fabien Georges Andre Guillemaud
<p>Pianifica ogni trade con un clic: Entry, Take Profit e Stop Loss disegnati per te. Nessun repaint.<br/> Qualsiasi coppia, qualsiasi timeframe. Sul tuo grafico in 2 minuti. Test gratuito nello Strategy Tester.</p> <p><br></p> <p><a href=" https://www.mql5.com/en/users/fabienfxtrades/seller " target="_blank">Get more indicators here</a><br>Baselines, volatility filters and oscillators. No repaint.</p> <p><br></p> <h3>Perché ti serve</h3> <p>Pianifichi a mano un trade basato sull'Average True Ra
Fabii Kaufman Efficiency Ratio
Fabien Georges Andre Guillemaud
Vedi a colpo d'occhio se il prezzo è in tendenza o solo in rumore, con una sola linea da 0 a 1. No repaint. Qualsiasi coppia, qualsiasi timeframe. Sul tuo grafico in 2 minuti. Demo gratuita nello Strategy Tester. Get more indicators here Baselines, volatility filters and oscillators. No repaint. Perché ti serve Vedi un movimento pulito sul grafico ed entri. Poche candele dopo il prezzo si ferma, va di lato e ti fa uscire. Il movimento sembrava una tendenza, ma era per lo più avanti e indietro
FREE
Fabii Volatility ATR Percentile
Fabien Georges Andre Guillemaud
Vedi se la volatilità misurata dall'Average True Range (ATR) è calma o tesa, da 0 a 100. Senza repaint. Qualsiasi coppia, qualsiasi timeframe. Sul tuo grafico in 2 minuti. Demo gratuita nello Strategy Tester. Get more indicators here Baselines, volatility filters and oscillators. No repaint. Perché ti serve Un valore grezzo di ATR come 0.0040 dice poco. È alto per questa coppia adesso, o normale? Per saperlo devi tornare indietro di settimane di barre e tirare a indovinare. Così entri in un m
FREE
Fabii Volatility Acceleration Index
Fabien Georges Andre Guillemaud
See at a glance when volatility is speeding up before a move — and when it is fading into a dead market. Any pair, any timeframe. No repaint — signals are final on bar close. Try it free in the Strategy Tester before you buy. THE PROBLEM Most volatility tools tell you how big the range is right now. They do not tell you the one thing that matters for timing: is volatility accelerating or slowing down? You end up entering just as a move runs out of steam, or sitting out while a breakout
FREE
Fabii Memory Baseline
Fabien Georges Andre Guillemaud
Leggi il trend e quello del timeframe superiore sullo stesso grafico, con una linea che mantiene il suo livello. No repaint. Qualsiasi coppia, qualsiasi timeframe. Sul tuo grafico in 2 minuti. Demo gratuita nello Strategy Tester. Get more indicators here Baselines, volatility filters and oscillators. No repaint. Perché ti serve Una media mobile semplice resta indietro rispetto al prezzo. Dopo un movimento forte, la linea resta lontana dal prezzo. Per vedere il timeframe superiore devi cambiar
FREE
Fabii Supertrend NMA
Fabien Georges Andre Guillemaud
Resta nel trend anche tra il rumore dei range con un SuperTrend su un centro adattivo. No repaint. Qualsiasi coppia, qualsiasi timeframe. Sul tuo grafico in 2 minuti. Test gratuito nello Strategy Tester. Get more indicators here Baselines, volatility filters and oscillators. No repaint. Perché ti serve Entri perché il SuperTrend ha appena girato. Il prezzo si muove di lato per alcune candele, la linea torna indietro, ed esci dall'operazione oppure salti il segnale successivo. Il SuperTrend cl
Fabii Adxvma Ssl Pro
Fabien Georges Andre Guillemaud
One adaptive SSL trend line that only flips when the move is real, plus a second SSL baseline from a higher timeframe on the same chart, Buy/Sell arrows, and an ATR filter that blocks weak signals before they reach you. No repaint. Try the free version first: Fabii Adxvma Ssl Channel. THE PROBLEM A classic SSL channel flips on every small push. Even the adaptive ADXVMA version flips too often in choppy markets, fires arrows on signals that reverse the next bar, and shows you only one ti
Fabii Nma Ssl Pro
Fabien Georges Andre Guillemaud
Know the trend direction before you enter — adaptive SSL line with an ATR filter that blocks weak flips. No repaint. Any pair, any timeframe. Signals lock on bar close. Test it free in the Strategy Tester before buying. THE PROBLEM Standard SSL channels flip at every small push against the trend. You take the signal, price reverses immediately, and you stop out. Tighten the filter, you miss real moves. Loosen it, you drown in noise. And watching one timeframe only, you never know whethe
Fabii Responsive Trend Baseline
Fabien Georges Andre Guillemaud
Individua prima le inversioni di tendenza con una baseline a basso ritardo. Cinque medie veloci. No repaint. Qualsiasi coppia, mercato e timeframe. Demo gratuita nello Strategy Tester. Get more indicators here Baselines, volatility filters and oscillators. No repaint. Perché ti serve Una media lenta conferma la tendenza quando il movimento è già in corso. Vedi l'inversione tardi ed entri tardi. Ogni ingresso tardivo ti costa un prezzo peggiore e uno stop loss più lontano. Cosa ottieni Fabii R
Fabii Ehlers Trend Baseline
Fabien Georges Andre Guillemaud
Leggi la tendenza su una linea più liscia, con meno piccole oscillazioni. Cinque filtri di elaborazione del segnale. No repaint. Qualsiasi coppia, mercato e timeframe. Demo gratuita nello Strategy Tester. Get more indicators here Baselines, volatility filters and oscillators. No repaint. Perché ti serve Una linea rumorosa si inverte a ogni piccola oscillazione. Vedi un nuovo segnale, entri, e il movimento si inverte. Ogni falsa inversione ti costa uno stop loss. Cosa ottieni Fabii Ehlers Tren
FREE
Fabii Coral Trend
Fabien Georges Andre Guillemaud
Know your trend bias on two timeframes at once — no repaint, signals final on bar close. Any pair, any timeframe, any market. Free demo in the Strategy Tester. >> Get more free and premium indicators here Baseline, volatility, oscillators & more. No repainting. No guessing. Just clean signals. THE PROBLEM You know the chart-timeframe trend. But you do not know whether the higher timeframe agrees — until you flip to it, then flip back, and the moment is gone. Entering with the short-t
FREE
Fabii Htf Po3 Candle Projection
Fabien Georges Andre Guillemaud
Guarda la candela del timeframe superiore formarsi accanto al prezzo, con un conto alla rovescia. Senza repaint. Qualsiasi simbolo. Sul tuo grafico in 2 minuti. Test gratuito nello Strategy Tester. Get more indicators here Baselines, volatility filters and oscillators. No repaint. Perché ti serve Operi su M5 o M15, ma la candela giornaliera fissa il quadro della giornata. Per vedere dove ha aperto, quanto si è estesa e quanto tempo le resta, cambi grafico o apri una seconda finestra. Ogni cam
Fabii Confluence Oscillator
Fabien Georges Andre Guillemaud
Smetti di contare i segnali a occhio: sette indicatori classici votano in un unico punteggio da -100 a +100. No repaint. Qualsiasi coppia, qualsiasi timeframe. Sul tuo grafico in 2 minuti. Test gratuito nello Strategy Tester. Get more indicators here Baselines, volatility filters and oscillators. No repaint. Perché ti serve Sovrapponi più indicatori in sottofinestre e conti i loro segnali a occhio. Uno sale, un altro è piatto, un terzo punta nella direzione opposta. Entri con una maggioranza
FREE
Filtro:
Nessuna recensione
Rispondi alla recensione