Volumeshadow
- Indicatori
- Versione: 1.0
- Attivazioni: 5

Volumeshadow visualizes the Cumulative Volume Delta (CVD) directly on the price chart and provides an instant view of the balance between buyers and sellers. The CVD is displayed as colored shadow bodies on each candle, allowing potential CVD divergences to be identified.
The indicator is based on tick volume and offers Forex and CFD traders in particular an effective way to analyze order flow-like market activity.
Highlights
• CVD displayed directly on the main chart – no separate window required
• Early identification of CVD divergences
• Tick volume based – ideal for Forex and CFD traders
• Daily CVD reset
• Calculated exclusively on closed candles – no repainting
• Clean and unobtrusive visualization for efficient market analysis
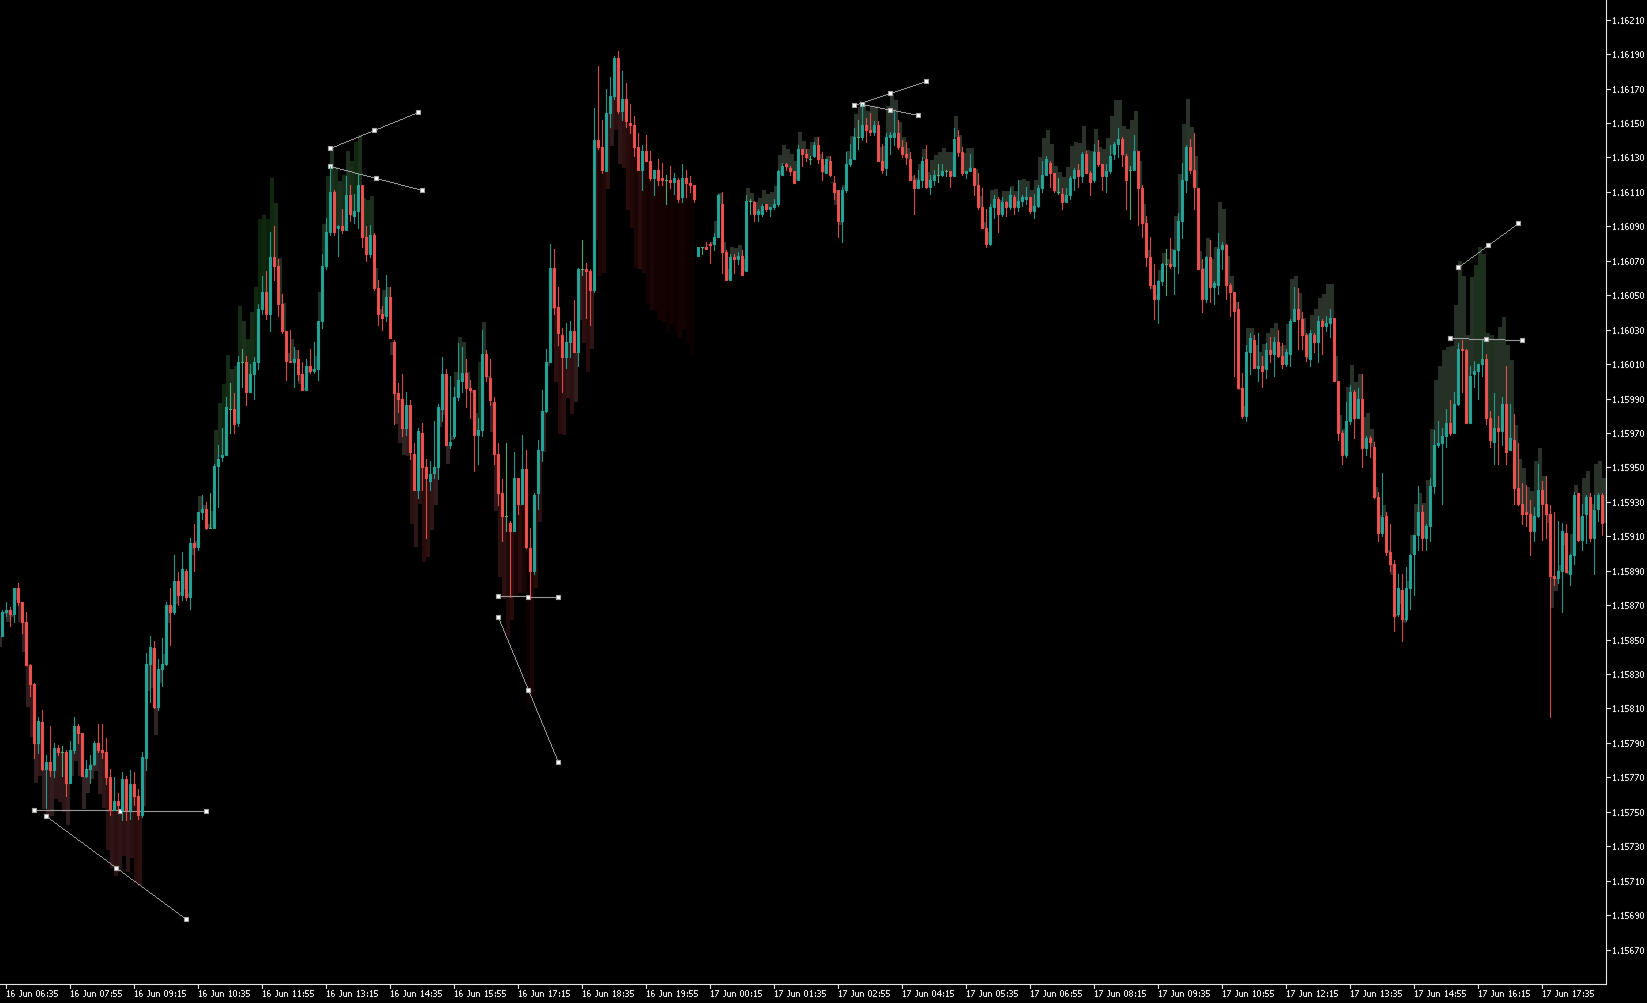
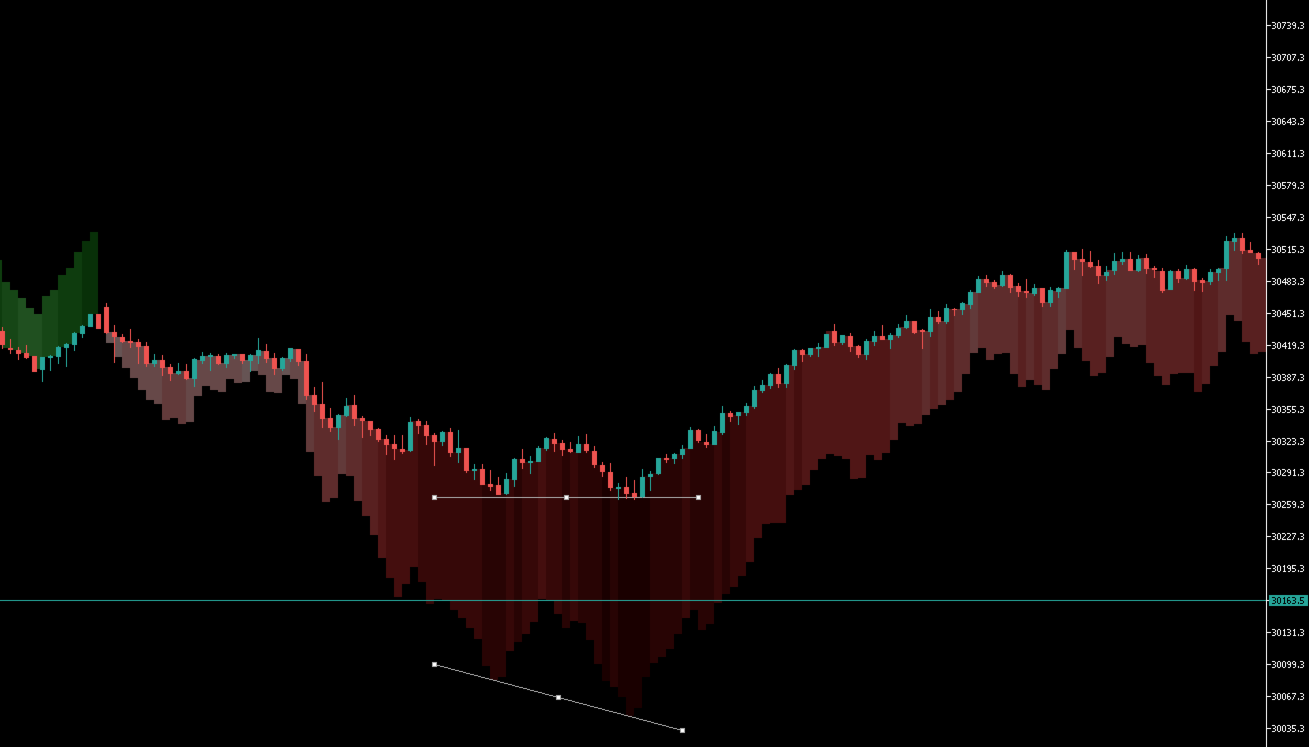
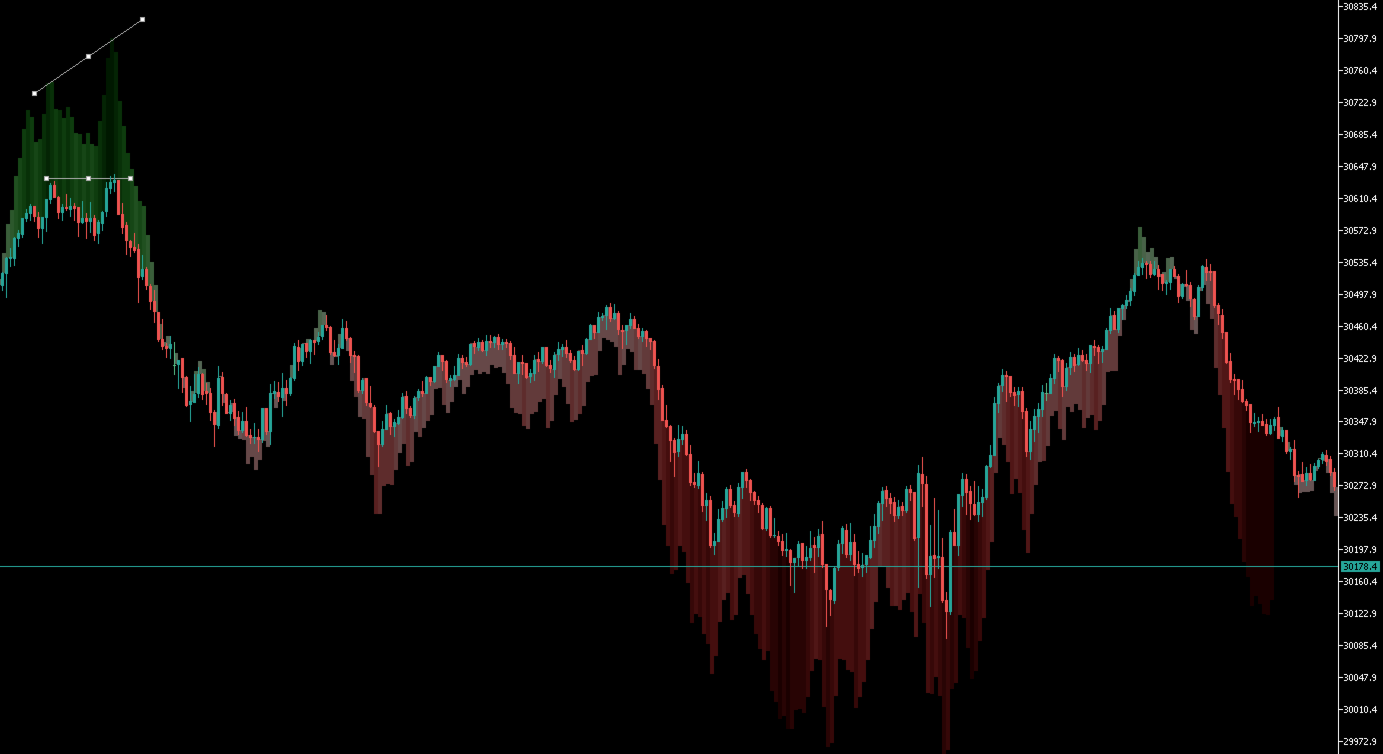
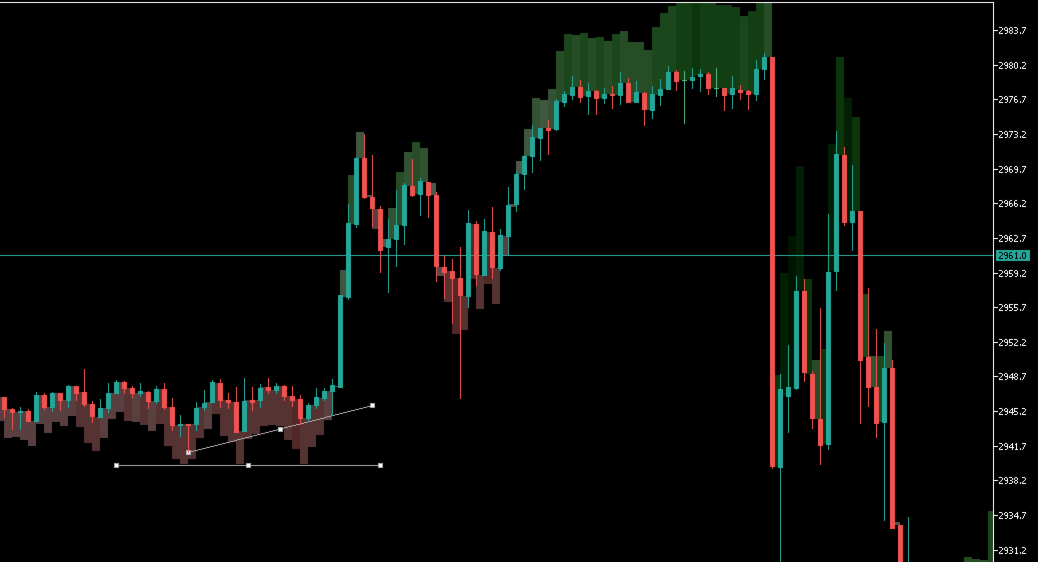
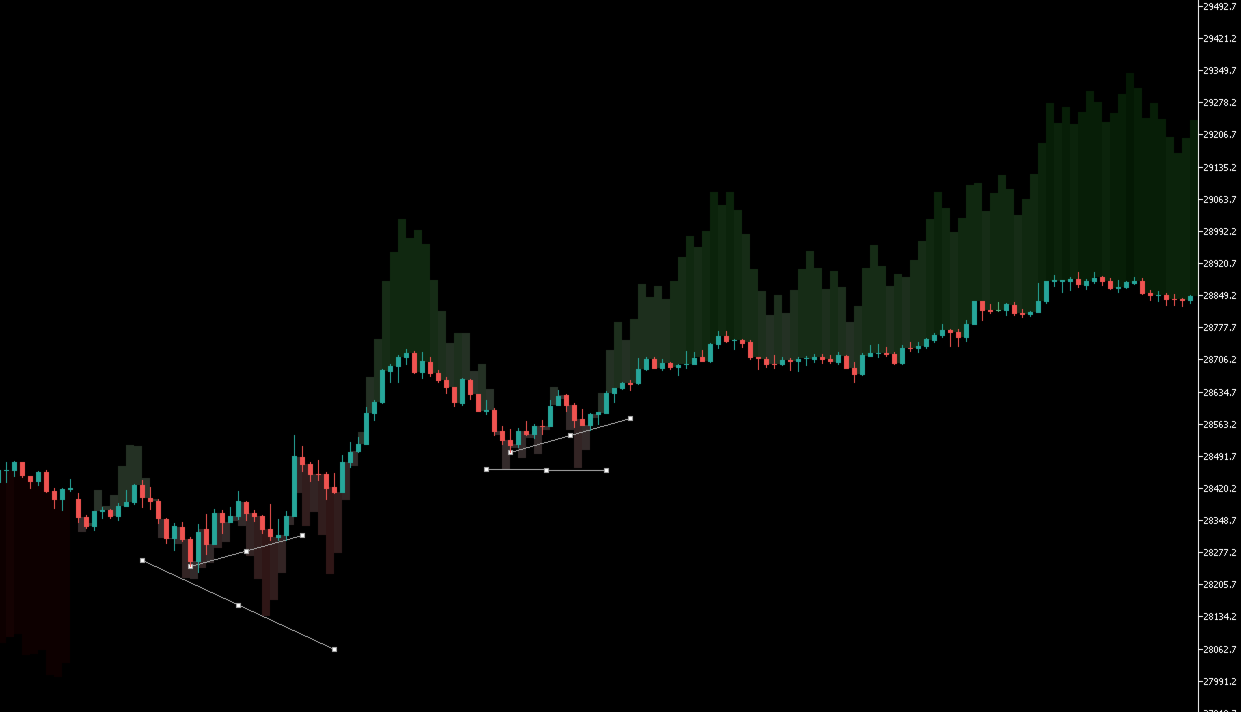
My Personal Interpretation of the Indicator as a Simple Example
(The 5-minute chart is my preferred timeframe.)
Bearish Divergences
Price: Equal High
CVD: Clear Higher High
or
Price: Lower High
CVD: Equal High / Higher High
Personal Interpretation: Despite increasing or persistent buying strength, the market fails to form a new high or even forms a lower high. Buying strength is being absorbed.
Bullish Divergences
Price: Equal Low
CVD: Clear Lower Low
or
Price: Higher Low
CVD: Equal Low / Lower Low
Personal Interpretation: Despite increasing or persistent selling strength, the market fails to form a new low or even forms a higher low. Selling strength is being absorbed.
Note
CVD divergences can serve as an additional filter for trading decisions. Identifying buying or selling absorption may help traders avoid taking positions against the prevailing absorption and reduce the likelihood of unfavorable entries. If no clean and clear divergence is present, I personally interpret this as a healthy market.
All screenshots were taken over the past days and weeks and show examples from EUR/USD, S&P 500, US100, and Gold on the 5-minute chart.
The CVD divergences shown in the product images have been manually identified and marked and are provided for demonstration purposes only. Volumeshadow does not automatically detect or highlight divergences. The interpretation and identification of potential divergences are left entirely to the trader.