CandlePOC Pro
- Indicatori
- Versione: 1.0

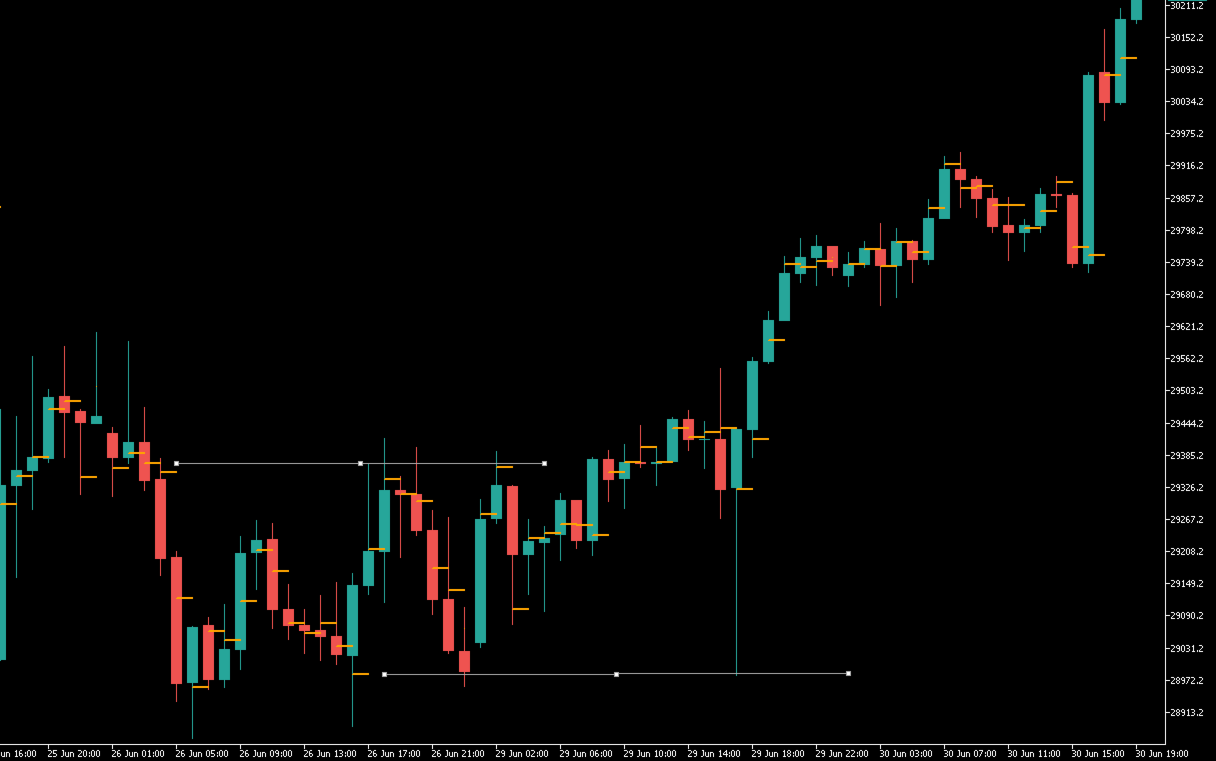
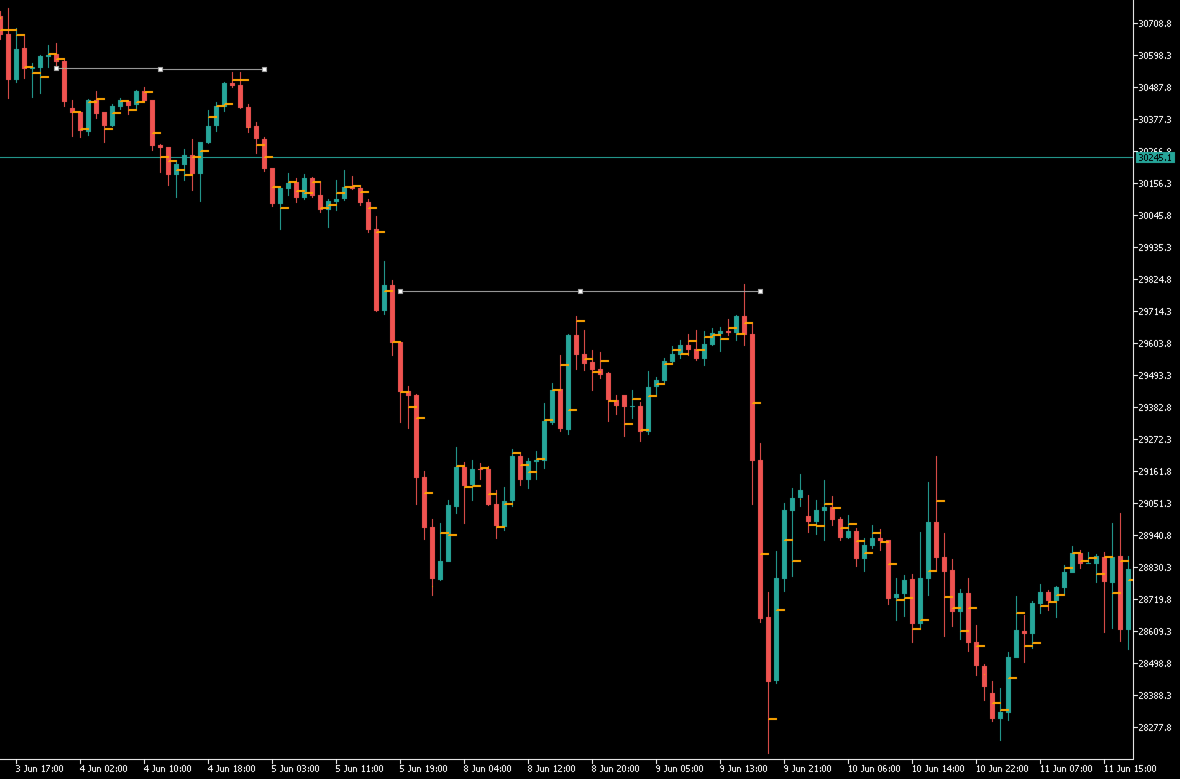
CandlePOC Pro is a professional MT5 indicator that visualizes the Point of Control (POC) of every individual candle directly on the chart. For each completed candle, the price level with the highest trading activity is identified and displayed as a horizontal line.
The calculation is based on MetaTrader 5 Tick Volume, allowing traders to identify the price levels where the highest amount of activity occurred within each candle.
Once a candle is closed, its POC remains fixed and is never recalculated. This creates a valuable historical map of important price levels. The indicator automatically adapts to the currently selected chart timeframe.
Main Features- Point of Control for every individual candle
- Tick Volume-based calculation
- POCs are displayed only after a candle has closed
- Previously calculated POCs are never continuously recalculated
- Automatically adapts to any chart timeframe
- Instant redraw while scrolling or zooming
- Fully customizable colors
- Choose between Bull/Bear coloring or a single neutral color
- Display POC lines in front of or behind the candles
- Efficient incremental calculation for excellent performance
- Suitable for Forex, Indices, CFDs, Stocks and Cryptocurrencies
The indicator uses the Tick Volume provided by your broker.
Tick Volume does not measure the actual number of traded contracts. Instead, it counts the number of price changes (ticks) occurring within each candle. In the Forex and CFD markets, Tick Volume is widely accepted as a reliable approximation of actual market activity and is commonly used by professional traders for volume analysis.
The Point of Control is calculated from the Tick Volume distribution within each individual candle.
ApplicationsCandlePOC Pro is ideal for:
- Order Flow Analysis
- Tick Volume Analysis
- Intraday Trading
- Scalping
- Swing Trading
- Market Structure Analysis
- Support and Resistance Analysis
- Reaction Zone Identification
- Identifying Price Acceptance within Individual Candles
The Point of Control provides its greatest value at significant market highs and lows. When a candle's POC forms near an important market extreme, it can indicate price acceptance, trend exhaustion, or a potential reaction zone. Combined with market structure, trend analysis and price action, these POC levels can help identify high-probability trade entries and exits.
SettingsMax Bars
Defines the maximum number of historical candles for which POC lines are displayed.
Line Length
Determines how far the horizontal POC line extends beyond the end of each candle.
Line Width
Sets the thickness of the POC lines.
Draw Behind Candles
Choose whether the POC lines are displayed in front of or behind the candles.
Use Tick POC
Enables or disables Tick Volume-based POC calculation.
Enabled
The Point of Control is calculated using the Tick Volume distribution within each candle.
Disabled
The midpoint of the candle body is used as the reference price.
Price Bins
Defines the number of price intervals (bins) used to calculate the Tick Volume Point of Control.
Higher values provide a more detailed and accurate Tick POC calculation.
Positive Color
Defines the color of POC lines for bullish candles.
Negative Color
Defines the color of POC lines for bearish candles.
Use Bull/Bear Colors
Selects the coloring mode.
Enabled
- Bullish candles are displayed using the selected Positive Color.
- Bearish candles are displayed using the selected Negative Color.
Disabled
All POC lines are displayed using a single Neutral Color.
Neutral Color
Defines the color of all POC lines when Bull/Bear coloring is disabled.
Force Redraw On Scroll
Instantly redraws all visible POC lines while scrolling or zooming the chart, ensuring they appear without delay.
Draw Last Bar After No Ticks
Displays the Point of Control of the last candle even if no new ticks are received after the market has closed.
No Tick Seconds For Last Bar
Defines how many seconds without new ticks must pass before the last candle is treated as closed.
Draw Last Bar Immediately On Load
Immediately draws the Point of Control of the last candle when the indicator is loaded after the market has already closed.