Quantview Analytics Pro
- Utilità
- Versione: 1.18
- Aggiornato: 9 maggio 2026

QuantView Analytics Pro is An on-chart graphical dashboard that tracks, aggregates, and analyzes your trading history. Calculate Profit Factors, Average Win/Loss, and long/short directional bias splits for every Symbol and Magic Number in your portfolio.
Elevate Your Trading Forensics with QuantView Analytics Master
You are currently using the free version of QuantView Analytics Pro. If you are a serious algorithmic developer or quantitative trader, it is time to upgrade your risk management with QuantView Analytics Master.
The Master edition is a massive leap forward, transforming your MT5 chart into an institutional-level diagnostic terminal. It exposes the hidden risk profile of your algorithms by evaluating your EAs across three critical dimensions:
-
Deep EA & Symbol Forensics: Instantly identify win rates, profit factors, and exact buy/sell ratios to spot malfunctioning trend filters.
-
Advanced Risk Tracking: Calculate Recovery Factors, Maximum Drawdown, and worst-case losing streaks per Magic Number, all while monitoring Live Floating P&L.
-
Temporal Diagnostics: Break down your Net P&L day-by-day. Turn a break-even robot into a highly profitable one just by knowing which days to turn it off.
-
Institutional CSV Export: Bypass MT5's reporting limits with a single click, exporting timestamped matrices for advanced analysis in Excel, Python, or Tableau.
Take control of your portfolio today. 📈 Upgrade to the Master Edition: https://www.mql5.com/en/market/product/176371
Full Description:
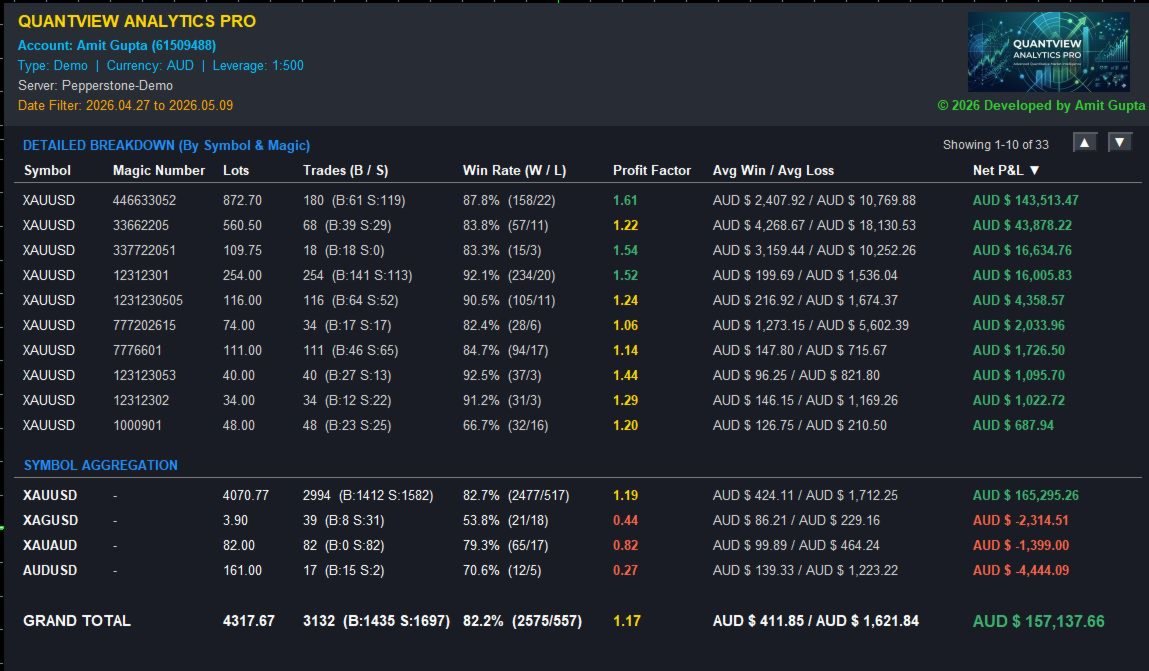
QuantView Analytics Pro is an analytical dashboard built directly into your MetaTrader 5 terminal. Designed for quantitative traders and algorithmic developers, this tool transforms raw trading history into a readable and actionable matrix.
Whether you are running multiple Expert Advisors using different Magic Numbers or managing a multi-currency portfolio, QuantView Analytics Pro isolates your performance metrics to help you evaluate your strategies.
Key Features:
-
Detailed Strategy Breakdown: Automatically isolates your trading history by both Symbol and Magic Number
-
Symbol Aggregation: A dedicated summary section combines all magic numbers to display your net exposure and performance per asset.
-
Advanced KPIs: Calculates core performance metrics, including Profit Factor , Average Win vs. Average Loss , and Win Rate %.
-
Directional Bias Tracking: Splitting your total trades into exact Buy (B) and Sell (S) metrics allows you to monitor your directional bias and identify if an EA is struggling under specific market conditions.
-
Dynamic Sorting Engine: Use the built-in sorting logic to dynamically rank your dashboard by Symbol, Magic Number, Lots, Trades, Win Rate, Profit Factor, or Net P&L.
-
Smart Currency Formatting: Automatically detects your broker's account currency and formats your P&L with proper localized symbols ($, €, £, ¥, CHF) and thousands-separators for clean readability.
-
Non-Intrusive UI: Built with a dark-mode aesthetic , dynamic up (▲) and down (▼) scroll buttons for unlimited strategy rows, and strict Z-layering to ensure chart candlesticks and history arrows do not bleed through the dashboard.
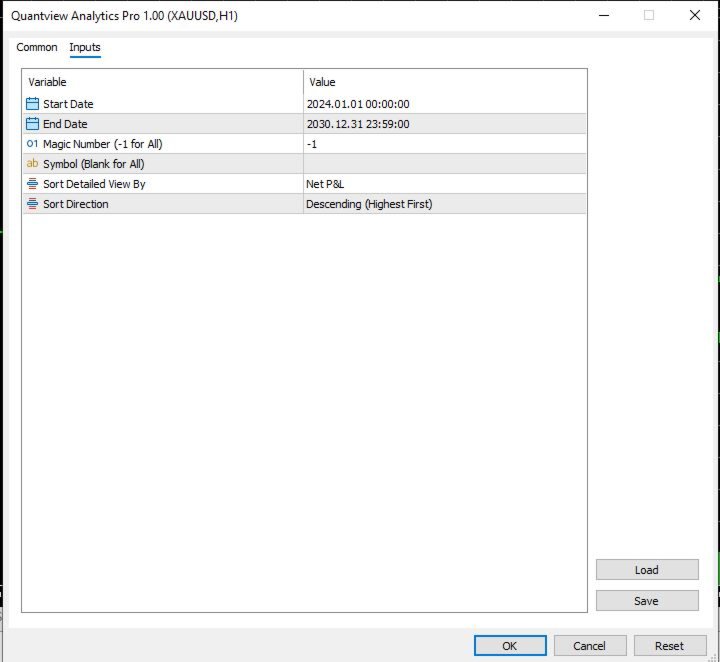
Input Parameters:
-
InpStartDate / InpEndDate: Define the exact historical time window you want to analyze.
-
InpMagicNumber: Enter a specific Magic Number to isolate a single EA, or leave as -1 to analyze your entire account.
-
InpSymbol: Type a specific ticker to isolate one asset, or leave blank to analyze all traded symbols.
-
InpSortCol: Choose how the dashboard ranks your strategies.
-
InpSortDir: Choose Ascending or Descending sort direction.
(Note: This is a purely analytical dashboard and does not execute or manage live trades.)