Advanced ADX Multi Timeframe
- Indicatori
- Versione: 3.0
- Aggiornato: 16 aprile 2026

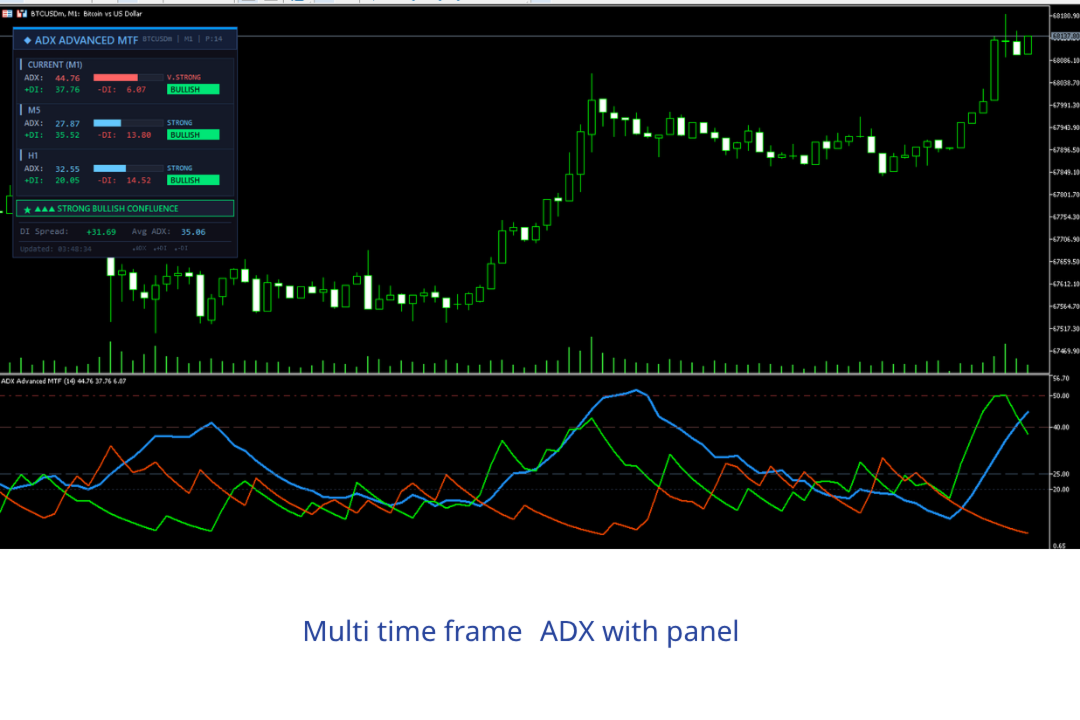
Advanced ADX Multi Timeframe is a professional ADX indicator for MetaTrader 5. It combines the classic Average Directional Index with multi-timeframe analysis and a clean on-chart panel, so you can read trend strength and direction across several timeframes at once.
Features
- Classic ADX engine: real-time ADX, +DI and -DI values on the current chart.
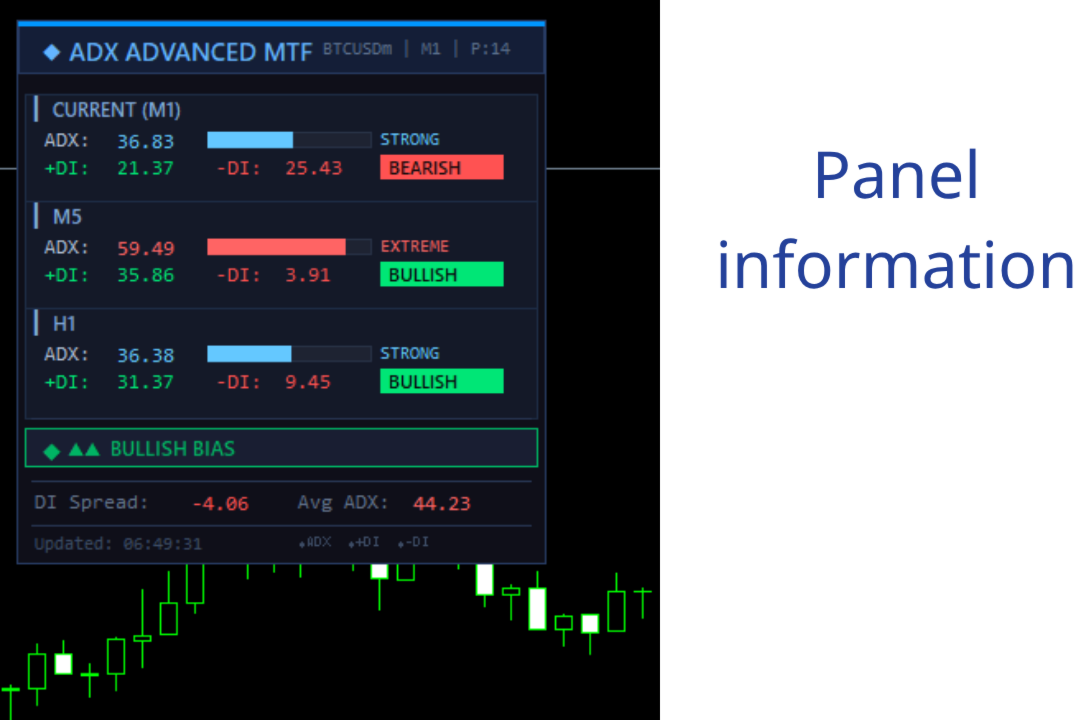
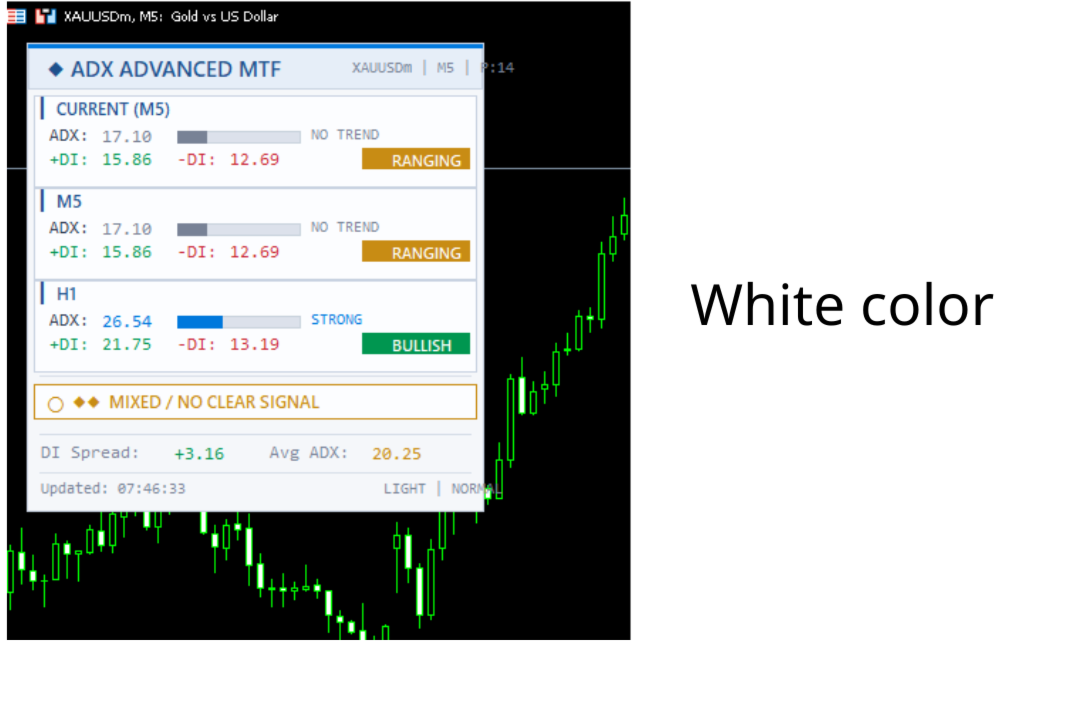
- Multi-timeframe panel: shows trend strength and direction for several timeframes side by side, so you do not switch charts to check alignment.
- Direction and strength at a glance: color-coded readout separates trending from ranging conditions.
- Lightweight on-chart panel with adjustable position and colors.
- Works on all symbols and timeframes.
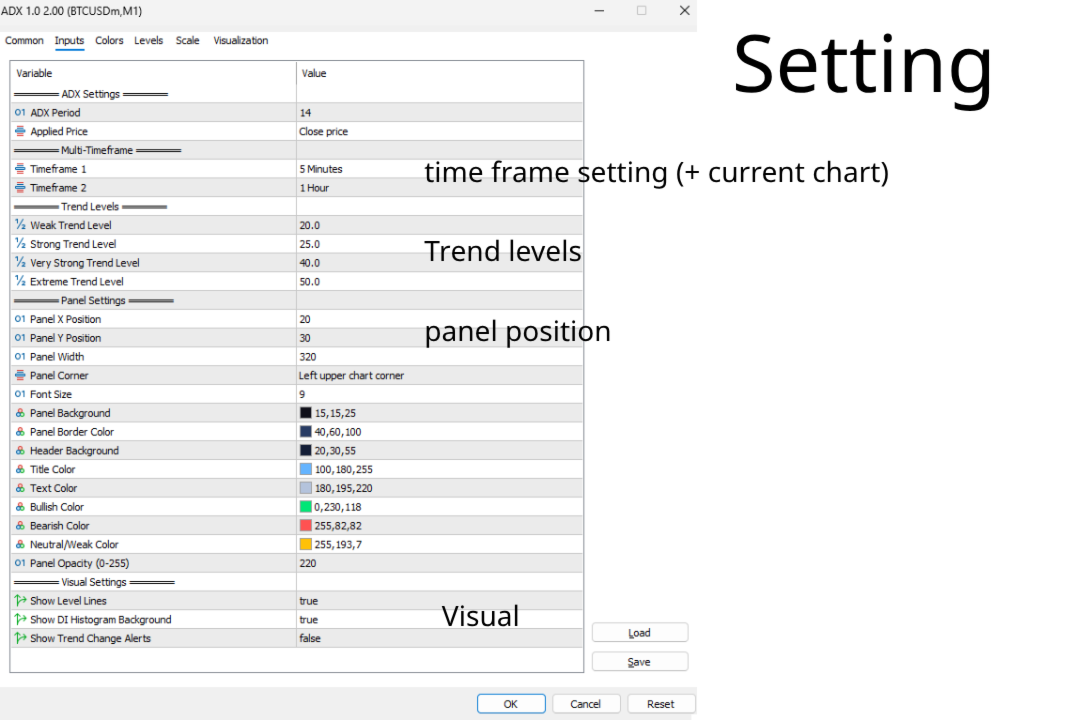
Inputs
- ADX Period: averaging length of the ADX calculation (default 14).
- Timeframes: the set of timeframes shown in the panel.
- Strength Threshold: ADX level that counts as a real trend (for example 20-25).
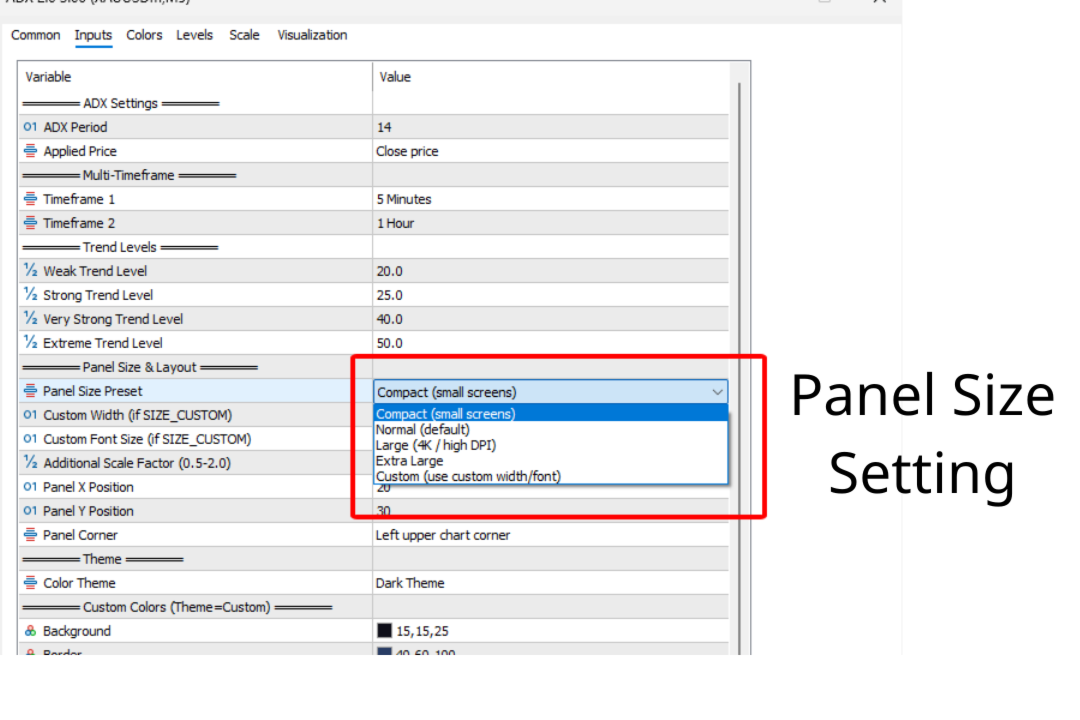
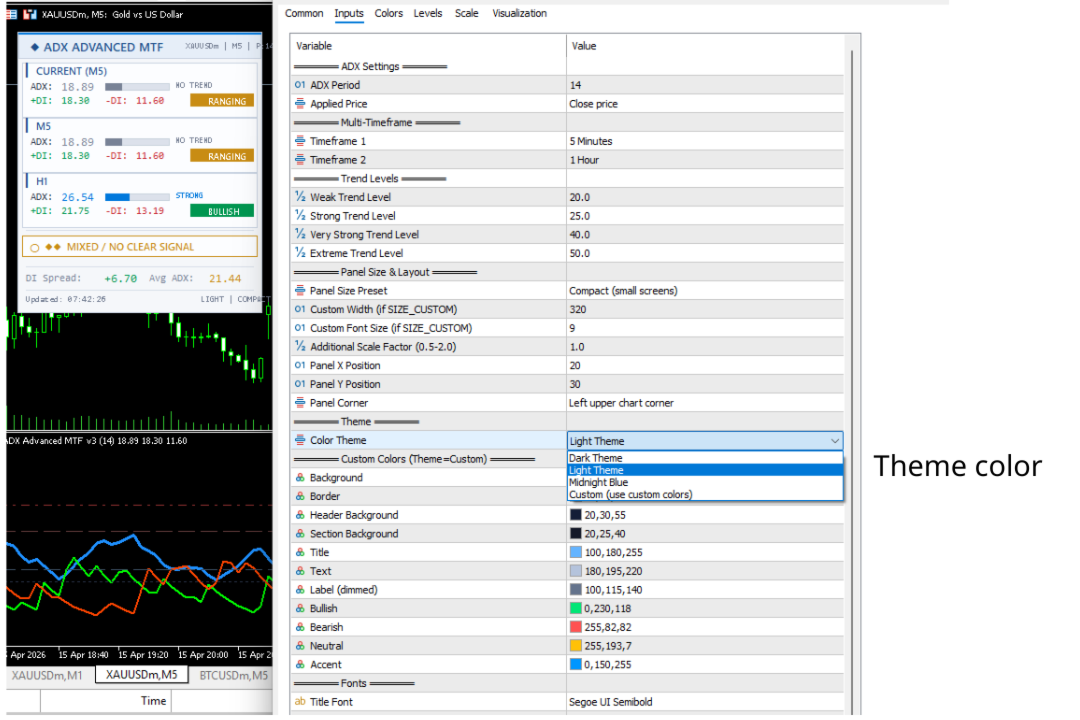
- Panel position, size and color options.
Outputs
- ADX, +DI and -DI lines in the indicator window.
- Multi-timeframe panel listing each timeframe with its trend strength and direction.
Alerts
Optional alerts can be sent as a screen popup, sound, push notification and email when ADX crosses your strength threshold or when direction flips.
Limitations
ADX measures trend strength, not direction by itself; read direction from the +DI/-DI relationship. Like all averaging indicators it lags somewhat, and in choppy markets ADX stays low. Use it as a filter alongside your entry method.
Full settings guide: see the Comments section.


The indicator is helping me filter my trades, and the author is very friendly and helpful with the explanations.