SMC indicator advanced
- Indicatori
- Versione: 4.0
- Attivazioni: 10

SMC Indicator Advanced is a complete Smart Money Concepts tool for MetaTrader 5. It automatically identifies the patterns institutions leave behind and helps you align with smart-money flow: banks, funds and market makers.
Features
- Market structure: labels higher highs and lower lows, draws Break of Structure (BOS) for continuation and Change of Character (ChoCH) for potential reversal.
- Order Blocks: marks bullish and bearish institutional entry zones as colored rectangles, with close or wick mitigation.
- Fair Value Gaps: highlights bullish and bearish price imbalances from aggressive moves.
- Liquidity zones: marks buy-side (BSL) and sell-side (SSL) liquidity where stops rest above highs and below lows.
- Chart-control options: cap the number of order blocks, gaps and liquidity zones shown for a clean chart.
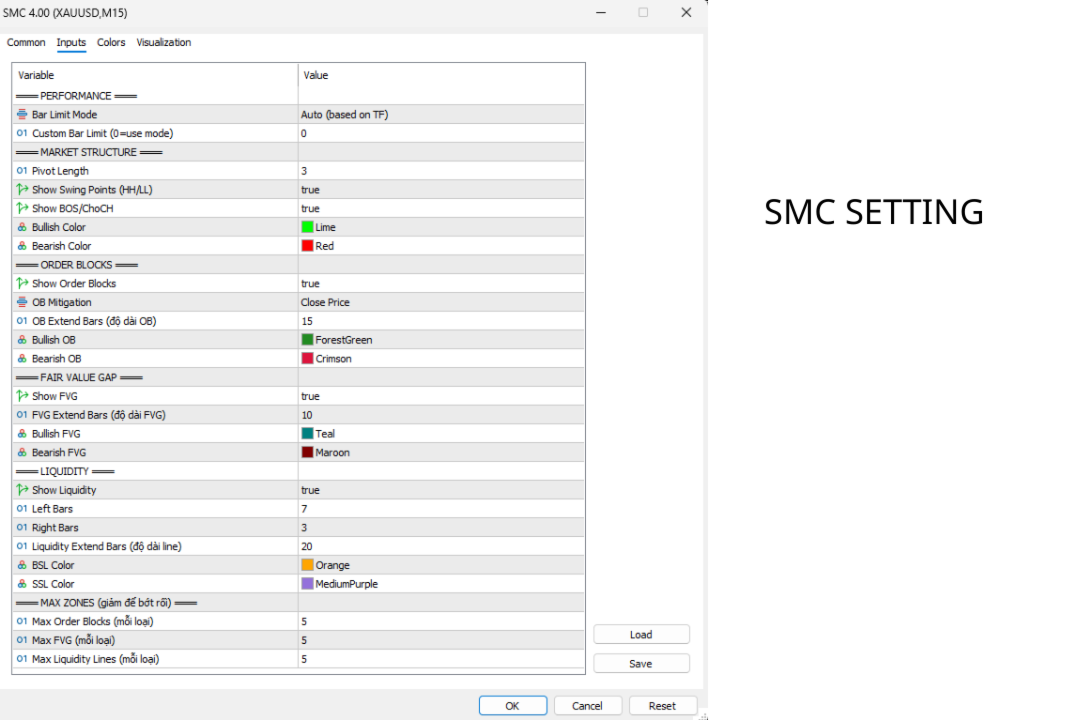
Inputs
- Pivot Length: bars to confirm a swing (default 3; 2-3 for M5-H1, 5+ for H4+).
- Bar Limit Mode: Auto (recommended) or a custom bar count.
- OB Mitigation: Close (default) or Wick (more conservative).
- OB Extend Bars: order-block display length (default 15).
- FVG Extend Bars: gap display length (default 10).
- Liquidity Left/Right Bars: pivot detection (default 7/3); Liquidity Extend Bars (default 20).
- Max Order Blocks / FVG / Liquidity: per-type display caps (default 5 each).
- Show Swing Points and Show BOS/ChoCH toggles.
Outputs
- HH/LL labels, dashed BOS lines and thick ChoCH lines.
- Green/red order-block rectangles, FVG zones, and orange BSL / purple SSL liquidity lines.
Alerts
Alerts can be sent as a screen popup, sound, push notification and email on a BOS, ChoCH, or when price reaches a key zone.
Limitations
SMC is a framework for reading structure, not a mechanical buy/sell system; you still need bias and confirmation. Lower pivot lengths produce more, noisier structure. Reduce the max-zone settings on busy charts.
Full guide with examples: see the Comments section.
Group support: https://www.mql5.com/en/channels/vuongphamtrading