Pro15
- Experts
-
Jason Smith
 Innovating the Future of Trading with Precision and Strategy
Welcome to my MQL5 profile! I’m TraderSmith, a passionate and results-driven trader committed to developing Expert Advisors (EAs) that transform complex market data into simple, actionable trading decisions. - Versione: 1.93
- Aggiornato: 20 febbraio 2026
- Attivazioni: 5
It's recommended that you read through the entire document..
Pro15 is a professional breakout Expert Advisor built around clearly defined daily price structure.
The EA continuously calculates and plots the current day’s high, low, open, and multiple intraday equilibrium levels directly on the chart, then executes trades when price breaks these levels according to your selected confirmation rules.
This Trading bot is designed so the same engine can be run side by side as both a trend-following and a mean-reversion system
In trend mode the EA buys breaks of the daily high and sells breaks of the daily low, while the mean reversion mode allows the logic to be flipped to fade extremes instead of chasing momentum.
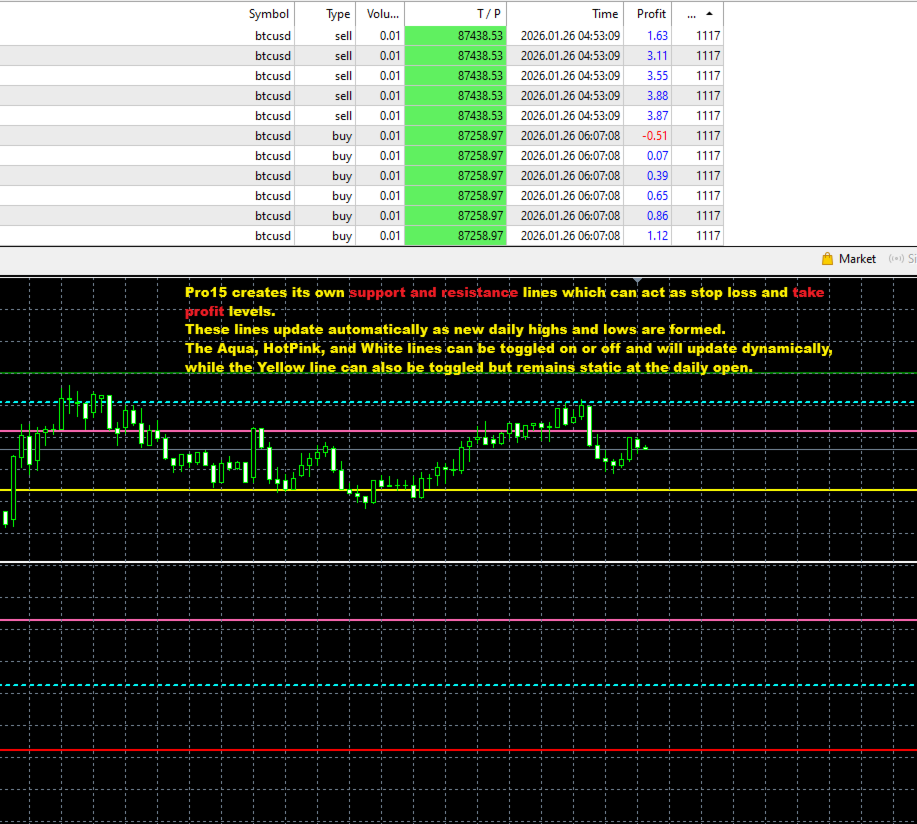
Pro15 creates its own support and resistance lines which can act as stop loss and take profit levels.
These lines update automatically as new daily highs and lows are formed. The Aqua, HotPink, and White lines can be toggled on or off and will update dynamically, while the Yellow line can also be toggled but remains static at the daily open.
At the core of the system are the daily high and daily low lines, shown in green and red.
These represent the most important breakout levels of the session and are used as the primary trade triggers.
A white midline is drawn at the exact 50 percent level between the daily high and daily low, highlighting the session’s balance point.
This level can be used visually as a mean-reversion reference or selected as a dynamic take profit target for trades that aim to exit at equilibrium rather than at fixed distances.
The yellow daily open line marks the price where the trading day began.
This level often acts as a magnet during intraday trading and can be used as an adaptive take profit level when price retraces back toward session balance.
Two pink mid-range lines are calculated at the 50 percent points between the daily high and the daily open, and between the daily low and the daily open.
These levels sit closer to current price than the full-range midline and are designed for conservative or partial exits, allowing profits to be secured earlier during steady trending conditions.
For stronger momentum moves, the EA also plots aqua continuation lines, which are midpoints between the pink lines and the daily high or daily low.
These levels act as deeper continuation targets and are ideal for capturing extended breakouts without relying on fixed pip take profits.
The green line marks the current day’s high.
This is the highest price reached since the daily session opened and acts as the primary breakout level for buy trades in normal mode or sell trades in inverse mode.
The red line marks the current day’s low.
This is the lowest price reached since the daily session opened and acts as the primary breakout level for sell trades in normal mode or buy trades in inverse mode.
Any of these lines can be enabled, hidden, or selected as live take profit targets, allowing trades to adapt dynamically to changing market structure rather than remaining locked to static values.
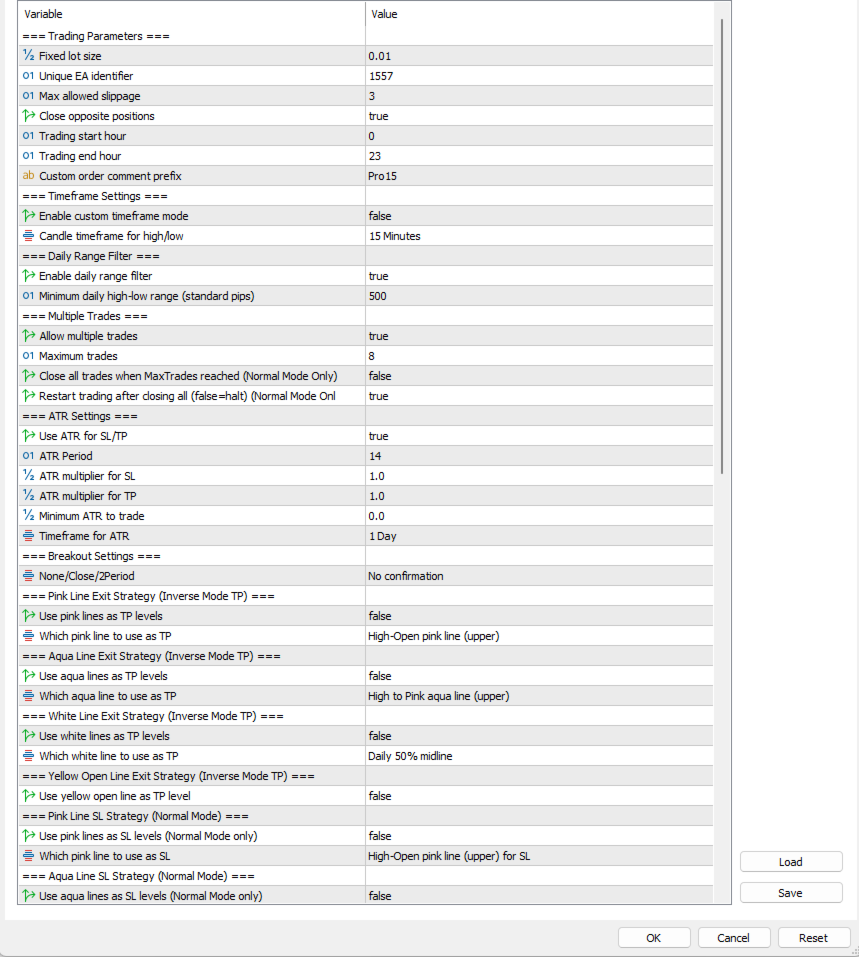
Breakout entries can be filtered using no confirmation, candle close confirmation, or two-candle confirmation, and a built-in daily range filter ensures trades are only taken once sufficient volatility is present, helping avoid low-range market conditions.
Risk management is fully configurable with ATR-based or fixed stop losses and take profits, optional real-time TP updates to selected structure lines, support for single or multiple trades, and intelligent handling of maximum trade limits. In normal mode, the EA can automatically close all positions when the maximum number of trades is reached and either pause or restart trading based on user preference.
The horizontal lines represent key price levels calculated from the current trading day and are used both for visual structure and optional trade exits.The pink lines are the 50 percent levels between the daily high and the daily open, and between the daily low and the daily open.
These levels sit closer to price than the full range midline and are useful for partial or conservative exits during trending days.
The aqua lines are secondary midpoints calculated between the pink lines and the daily high or daily low.
These represent deeper continuation targets and are typically used when price shows strong momentum beyond the initial breakout.
All horizontal lines update automatically throughout the day as new highs or lows are formed.
They can be shown or hidden individually and selected as dynamic take profit targets, allowing trades to exit at logical intraday structure levels instead of fixed pip values.
In trend-following mode, the EA runs in normal logic with inverse disabled. Trades are opened when price breaks above the daily high or below the daily low, aligning entries with directional momentum. Take profits can be set to the pink, aqua, or ATR-based targets, allowing the trade to ride continuation moves while stops expand and contract with volatility. This configuration is ideal for sessions that trend strongly after expansion and is best paired with the daily range filter so trades only occur once volatility is present.
In mean-reversion mode, the EA is run with inverse logic enabled. Instead of buying strength or selling weakness, the system sells breaks above the daily high and buys breaks below the daily low, fading extended price moves back toward balance. In this configuration, take profits are typically set to the white daily midline or the yellow daily open, which represent natural equilibrium levels for intraday price rotation.
Volatility Qualification: The Daily Range Filter
The Daily Range Filter is a volatility qualification system that measures the current day's trading range against a user-defined pip threshold.
When active, it blocks all trade execution until the market demonstrates sufficient movement, serving as a quality control mechanism that ensures trades only occur during periods of adequate volatility.
This filter operates independently on D1 data regardless of your selected trading timeframe and automatically adjusts pip calculations for different instrument types.
For inverse trading strategies, this feature is particularly valuable as it prevents premature entries during low-volatility conditions where breakouts are more likely to fail, ensuring you only trade when market movement supports your contrarian approach.
Stops can remain ATR-based to adapt to volatility while targets remain structure-based.
The multi-timeframe feature:
This feature implements the same core breakout trading strategy across any timeframe while preserving identical trade logic and risk management.The system operates identically whether configured for daily, hourly, or minute-based trading—only the calculation period changes.
When UseCustomTimeframe = false, the EA defaults to D1 calculations, using the traditional daily high, low, and open values for breakout determination.
This maintains compatibility with standard daily breakout methodologies.
When UseCustomTimeframe = true, the EA switches to your selected timeframe (M1 through MN1) while executing identical logic: it calculates the highest high and lowest low within that period, determines the midpoint and secondary levels using the same percentage ratios, and identifies breakouts using the same confirmation rules.
The strategy mathematics remain constant; only the input candle data changes.
Identical Trading Execution:
Entry signals, stop-loss placement, take-profit calculations, and position management execute identically across all timeframes. A breakout on a 4-hour chart triggers the same trade as a breakout on a daily chart, with proportional adjustments for the condensed timeframe. All visual indicators recalculate based on the selected period while maintaining consistent color schemes and line styles.
Smart Trade Halt: Maximum Position Management: 8 and out (offshoot strategy)
The Max Then Halt feature provides automated trade limit enforcement by closing all positions and halting new trade entries once a user-defined maximum number of trades is reached.
When activated, the system continuously monitors open positions and, upon hitting the predetermined limit, automatically executes a full closure of all trades within the strategy.
Following this closure, the EA enters a halted state where it continues to monitor markets and update levels but blocks all new trade entries until the next trading period begins, effectively enforcing disciplined position limits and preventing overexposure while maintaining market awareness for the subsequent session.
This dual-mode approach allows the trader to capture both sides of market behavior.
During strong directional days, the trend-following instance can exploit breakout continuation. During rotational or overextended conditions, the mean-reversion instance can fade extremes back toward the daily open or midline.
Since both modes reference the same daily structure levels, they remain logically consistent while expressing opposite market assumptions.
By running the EA in parallel configurations,becomes a structure-based trading framework rather than a single-bias strategy, capable of adapting to different market regimes without changing code, indicators, or charts.
What makes this approach rare is that a single daily-structure framework can simultaneously support two fundamentally opposite strategies—trend-following and mean-reversion—without conflict.
Most systems are built for one market behavior: either chasing breakouts or fading extremes.
Trying to combine both usually leads to overlapping trades, conflicting signals, or excessive risk.
Bug report
Given the complexity of this EA. Some bugs may not have been discovered yet.
If you think you've found a bug in Pro15.
Do not rush the process.
- Write a precise description of the context.
- Write a description of the error as precise as possible.
- Attach the logs of the expert tab for the corresponding date.
- Attach the logs from the log tab for the corresponding date.
L'utente non ha lasciato alcun commento sulla valutazione.