Institutional Flow Dashboard
- Indicatori
-
Raymond Paul Raphael
 Specializes in high-performance trading tools designed for the modern MQL5 environment.
 - Versione: 1.0
- Attivazioni: 5
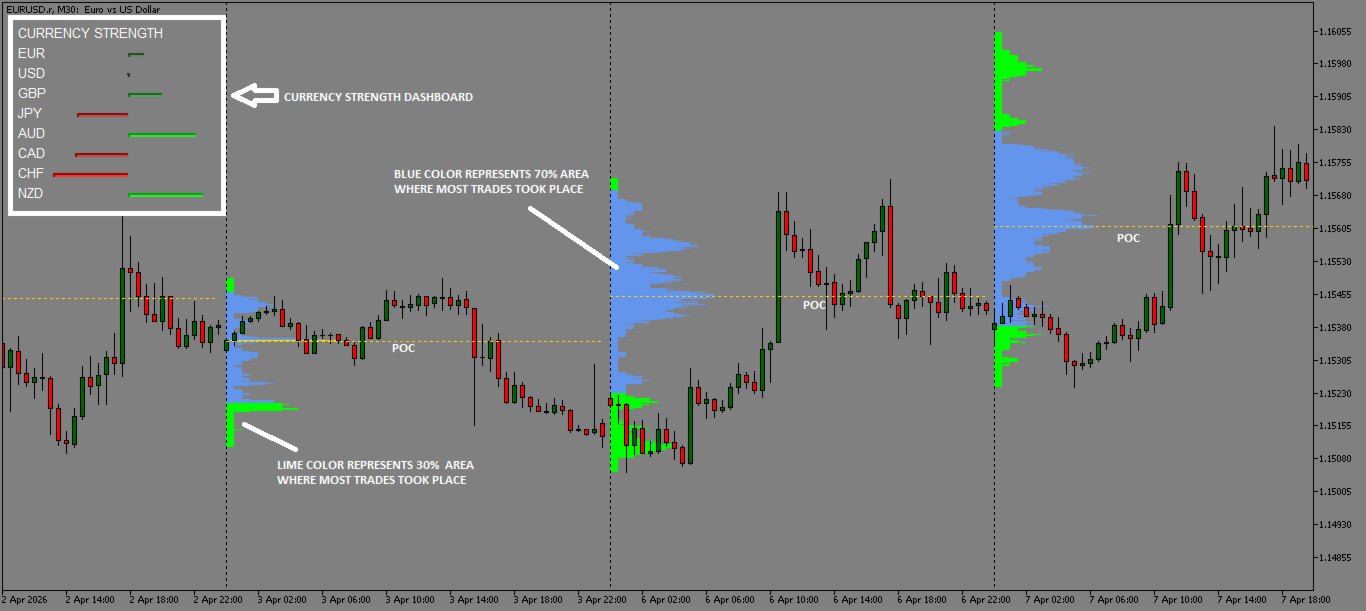
Institutional Flow Dashboard is a comprehensive technical analysis tool that combines two powerful methodologies: Volume Profiling and Relative Currency Strength. This all-in-one interface is designed to help traders identify high-liquidity price levels and market momentum in real-time.
Key Features:
- Volume Profile Analysis: Visualizes the distribution of volume across price levels, identifying the Point of Control (POC) and Value Area (VA).
- Multi-Currency Strength Meter: Analyses 8 major currencies across their respective pairs to determine absolute strength and weakness.
- Institutional Levels: Highlights areas of high trading activity where institutional orders are typically concentrated.
- Fully Customizable: Adjust the look, feel, and calculation periods to fit your specific trading style.
How to Use:
- Identify Market Bias: Use the Strength Meter to find the strongest vs. the weakest currency (e.g., Buy Strong, Sell Weak).
- Locate Entry Targets: Use the Volume Profile to find the POC and Value Area boundaries. Look for price reactions at these high-volume nodes.
- Confirm Confluence: Execute trades when a strong currency is bouncing off a significant volume level.
Main Settings:
- Enable Volume Profile: Toggle the profile display on/off.
- Profile Period: Choose between Daily, Weekly, or Monthly profiles.
- Value Area Percentage: Define the width of the value area (Default is 70%).
- Calculation Period: Adjust the number of bars used for currency strength assessment.
About the Developer
RAYLURKS FX specializes in high-performance trading tools designed for the modern MQL5 environment. For support, setup guides, feature requests, troubleshooting, or to explore my other trading utilities please visit my profile and send me a direct message—I am happy to assist you in optimizing your trading setup : RAYLURKS FX MQL5 Profile