Multi Asset Correlation Matrix


Master Your Portfolio Risk with Institutional-Grade Analysis

Are you trading multiple currency pairs, gold, and indices without knowing how they move together? Correlation is the silent account killer. When assets become highly correlated, your risk doubles, and your diversification becomes an illusion.

The Multi-Asset Correlation Matrix is a professional-grade decision-making dashboard designed for traders who manage complex portfolios. It doesn't just show numbers; it provides a statistical deep dive into how your assets interact in real-time.

Why This Matrix is Different

Unlike basic correlation tables, this tool uses advanced metrics to ensure you aren’t trading on "noise."

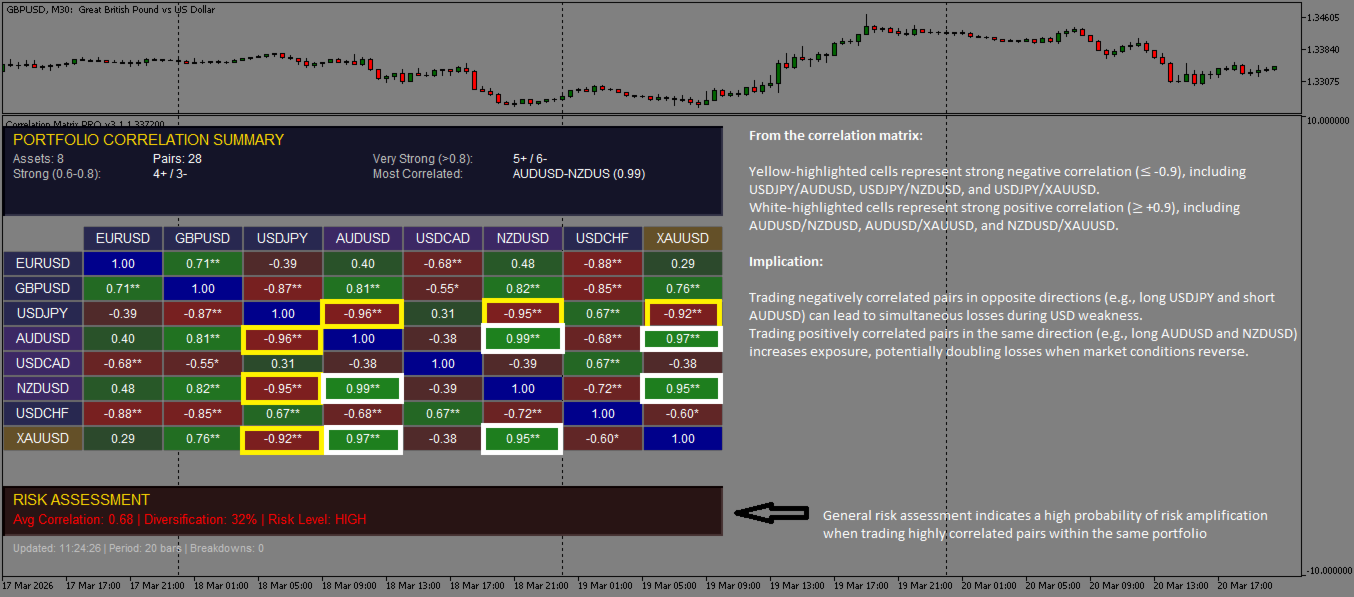
  • Executive Portfolio Summary: Get an instant bird's-eye view of your total exposure. This panel tallies your Strong (0.6–0.8) and Very Strong (>0.8) correlations, separating them by Positive (+) and Negative (-) directions. If you see "3-" under Strong, you know exactly how many pairs are moving in opposite directions at a glance.
  • Statistical Significance Indicators: Not all correlations are meaningful. The tool calculates p-values and marks valid relationships with stars (***, **, *). No stars? The correlation is likely random noise.
  • Correlation Breakdown Detection: A "black swan" early warning system. The matrix detects when historical correlations suddenly snap (e.g., Gold and EURUSD stop moving together), highlighting the cell in Orange to alert you to shifting market regimes.
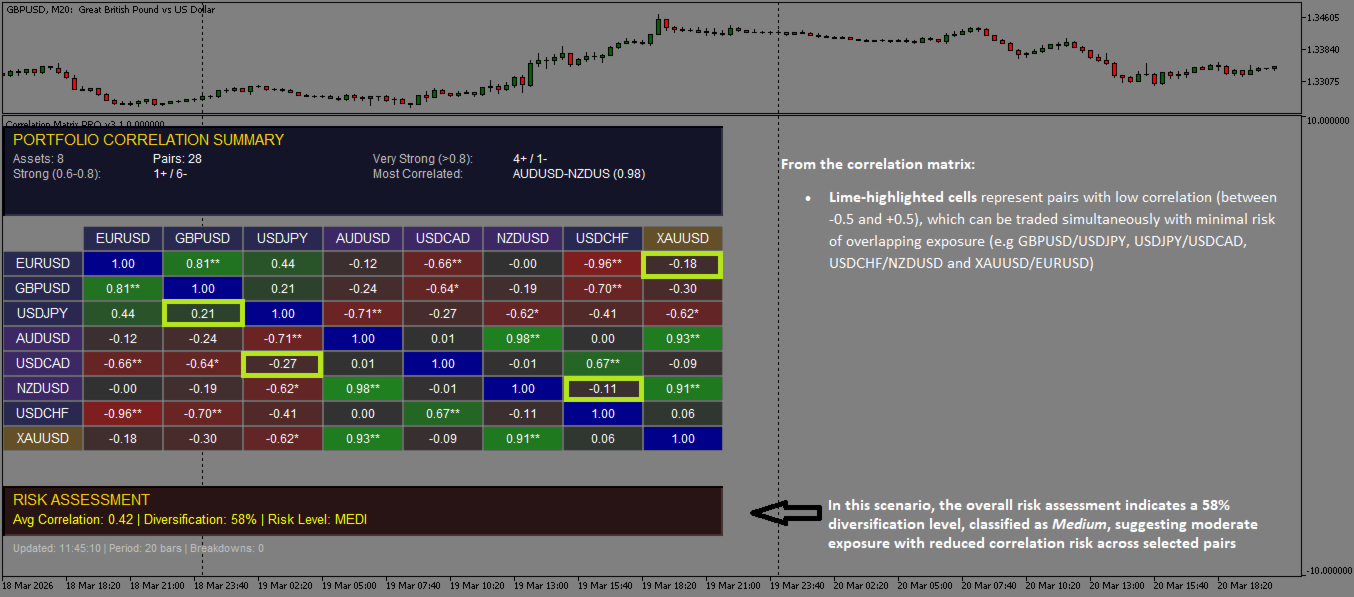
  • Dynamic Risk Assessment: Receive a real-time "Risk Level" (Low/Medium/High) and a Diversification Percentage based on the average absolute correlation of your entire portfolio.
  • Intelligent Asset Grouping: Automatically categorizes and color-codes assets by type (Forex Majors, Minors, Commodities, Indices, and Crypto) for a clean, professional interface.
  • Correlation Period: Choose the lookback period (default 20 bars).
  • Input Symbols: Supports up to 15 assets simultaneously.
  • Optimization: Light CPU footprint with adjustable refresh rates (InpUpdateRateSec).

Professional Features

  • Real-Time Heatmap: Visual color-grading updates every few seconds to catch rapid market shifts.
  • Smart Multi-Channel Alerts: Terminal pop-ups and Mobile Push Notifications trigger when assets exceed your defined threshold (e.g., > 0.85).
  • Customizable UI: Fully adjustable colors, cell sizes, and screen positioning to fit any trading template.
  • Multi-Timeframe Engine: Analyze correlations across any timeframe, from M1 to MN1.

How to Trade with the Matrix

  1. Identify Overexposure: If you are Long EURUSD and Long GBPUSD with a 0.95* correlation, you are doubling your risk on the same move.
  2. Hedge Efficiently: Use the summary panel to find assets with strong negative correlations (near -1.00) to balance your portfolio during volatility.
  3. Spot Regime Changes: Use Breakdown Detection to see when "normal" market behavior is failing—often a lead indicator of a major trend reversal.

About the Developer

RAYLURKS FX specializes in high-performance trading tools designed for the modern MQL5 environment. For support, setup guides, feature requests, troubleshooting, or to explore my other trading utilities please visit my profile and send me a direct message—I am happy to assist you in optimizing your trading setup : RAYLURKS FX MQL5 Profile


Prodotti consigliati
Introduction to Fractal Pattern Scanner Fractal Indicator refers to the technical indicator that makes use of the fractal geometry found in the financial market. Fractal Pattern Scanner is the advanced Fractal Indicator that brings the latest trading technology after the extensive research and development work in the fractal geometry in the financial market. The most important feature in Fractal Pattern Scanner is the ability to measure the turning point probability as well as the trend probabil
The indicator determines a special pattern of Joe Dinapoli. It gives very high probability buy and sell signals. Indicator does not repaint. Indicator Usage Buy Signal ''B'' Entry : Market buy order at signal bar close Stop : Low of signal bar Take Profit : First swing high Sell Signal ''S'' Entry : Market sell order at signal bar close Stop : High of signal bar Take Profit : First swing low Indicator Parameters Fast EMA : External Parameter (should be kept as default) Slow EMA: External Param
Yawabeh SD Pro –  Professional Supply and Demand Indicator Trade Smarter with Volume-Confirmed Supply/Demand Zones Our institutional-grade algorithm identifies high-probability reversal zones before price reacts, giving you the edge in Forex, Crypto, and Stocks. Key Features Multi-Timeframe Confirmation – View trend strength across multiple timeframes simultaneously – Align your trades with higher timeframe momentum Smart Alert System – Real-time notifications for: – Strong demand/supply zone
Manyal trading system, CovEchoTrend Robot, focuses on reliability and flexibility. By employing statistical analysis methods to study the relationships between the base indicator and market patterns, the system enables a deeper understanding of market processes. Intelligent pattern analysis: The application of statistical data processing helps identify key trend reversal points more accurately, signaling significant market shifts. Informed decision-making is based on the intersection of indicato
Questo indicatore è un indicatore per l'analisi automatica delle onde perfetto per il trading pratico! Caso... Nota:   non sono abituato a usare nomi occidentali per la classificazione delle onde a causa dell'influenza della convenzione di denominazione di Tang Lun (Tang Zhong Shuo Zen), ho chiamato l'onda base come   penna   e la banda dell'onda secondaria come   segmento   At allo stesso tempo, il segmento ha la direzione del trend. La denominazione   è principalmente segmento di trend   (que
Rocket Trend
Andriy Sydoruk
The Rocket Trend indicator is trending. The indicator draws two-color points connected by lines along the chart. This is a trend indicator, it is an algorithmic indicator. It is easy to work and understand when a blue circle appears, you need to buy, when a red one appears, sell. The indicator is used for scalping and pipsing, and has proven itself well. Rocket Trend is available for analyzing the direction of the trend for a specific period of time. Ideal for novice traders learning the laws o
Range Directional Force Indicator – Designed for You to Optimize! The Range Directional Force Indicator is a cutting-edge tool designed to empower traders by visualizing market dynamics and directional strength. Built to offer insights into market trends and reversals, this indicator is an invaluable asset for traders seeking precision in their strategies. However, it is important to note that this indicator is not optimized, leaving room for you to tailor it to your unique trading preferences.
Holiday Sales Zones Indicator The Zones Indicator is your everyday Trading tool that  leverages advanced algorithms, including ICT institutional concepts like order blocks , engulfing candle patterns , and Level interactions , to identify critical levels of supply and demand (Resistance & Support). Visual signals are generated and clearly marked on the chart, providing a straightforward guide for traders to spot key opportunities. Key Features Advanced Algorithmic Analysis : Identifies supply
The new update makes this indicator a complete tool for studying, analyzing and operating probabilistic patterns. It includes: On-chart Multi-asset percentage monitor. Configurable martingales. Twenty-one pre-configured patterns, including Mhi patterns and C3. An advanced pattern editor to store up to 5 custom patterns. Backtest mode to test results with loss reports. Trend filter. Hit operational filter. Martingale Cycles option. Various types of strategies and alerts. Confluence between patter
MarketMagnet
Kelly Adediran Raymond
Are you ready to take your trading journey to new heights? Look no further than MarketMagnet, this groundbreaking indicator designed to propel your trading success with excitement and accuracy. Powered by the convergence of Momentum and CCI (Commodity Channel Index), MarketMagnet equips traders with the ultimate tool to determine direction and entry prices for a wide range of recommended currency pairs and instruments. It is designed for traders seeking to scalp for a few pips on lower timeframe
First Dawn MT5
Innovicient Limited
The First Dawn indicator uses a unique mechanism to search and plot signals. This keeps searching for signals, making it a great indicator for scaping and identification of changes in direction, swing trading and trend trading. The    First Dawn     helps you get early signals. The backtest gives the true picture of how the indicator works with real/demo accounts. Although this is a tiny indicator it is packed with advantageous settings that will help you whether you desire to: Snap the Peaks a
Session Map Pro automatically plots the critical price levels from previous trading days and overlays visual session markers, giving you an instant "roadmap" of potential support and resistance.   It transforms your chart into a strategic trading battlefield.   Detailed Line Reference Guide (For visual display m1-m5 works best but can be attached to any time frame) Default lookbackDays=5. "Set to 1 for today only and a less cluttered display"  1.Horizontal lines (n) Days)    Solid GREEN Line (
Consecutive candles can give us an indication as to the strength of a trend. With this indicator, you can set the number of consecutive bull or bear candles you wish to be present before achieving a valid signal of RSI crossing into overbought or oversold. With this information, you can better judge if a continuation or reversal situation is about to present. RSI has two settable levels Interesting settings: Number of consecutive candles needed before a valid signal Overbought level of RSI Over
FREE
the fundamental technical indicator Informative Trend, which allows you to assess the current market situation in order to enter the market of the selected currency pair in a trend and with minimal risk. It basically uses the process of identifying the rate of change in price growth and allows you to find entry and exit points from the market. The indicator was created on the basis of the original indicators for searching for extreme points and is well suited for determining a reversal or a la
General Description In the simplest terms this is a contrarian intra-day scalping system. Built to try and let correct trades run as far as possible and flip the trade when indicated. The indicator looks at historical daily trading ranges to lay out levels at which it takes long and short positions based on the statistical levels. The indicator is built around index futures, mainly around S&P and the DOW but can be used an any futures contract mainly using AMP Futures to trade. The indicator is
The Plasma Trend indicator is a simple technical indication that is used to determine the current trend direction in the market. The Plasma Trend indicator is a powerful tool for determining the direction of the trend in the Forex market. It is based on both standard technical indicators and proprietary mathematical calculations, which provides a more accurate and reliable trend determination. Its implementation in the form of lines of two colors simplifies the visual determination of a change
Neuro Future
Sergey Rozhnov
Indicatore di rete neurale       con apprendimento integrato. Si tratta di un vero e proprio sistema di intelligenza artificiale autonomo,   basato su un perceptron personalizzabile multilivello e impostazioni di training avanzate per prevedere le future variazioni di prezzo. È possibile addestrare l'indicatore autonomamente su qualsiasi simbolo finanziario, senza bisogno di conoscenze specifiche di machine learning: tutto ciò di cui si ha bisogno è raccolto in questo strumento e implementato in
My PVSR
Ashok Kumar Singha
My PVSR   is based on All Type of Pivot Points. Use this Indicator to get proper Support / Resistance Zone and Trade accordingly.. Recommendation: Use this Indicator along with my another Indicator --->>> Dr. Trend   <<<--- Click Here ; To get the best output result feel free to contact me ; Best of Luck It can be used for: All Pairs: Forex, Cryptocurrencies, Metals, Stocks, Indices etc. All Timeframe All Brokers All type of Trading Style like Scalping, Swing, Intraday, Short-Term, Long-
Fibrillar
Vitalii Zakharuk
It is very easy to use the Fibrillar indicator, since the simplest is to look at the chart and act according to the indications of the colored arrows. The algorithm takes into account the measurement of prices, and this method also focuses on measuring each of the price drops (H / C, H / O, LC, LO) - which gives more detailed information, but also more averaged. When calculating this indicator, logarithmic gains are first calculated at the closing price, which allows you to filter out the tren
ACB Breakout Arrows Scanner MT5
KEENBASE SOFTWARE SOLUTIONS
Questo è uno scanner multi-simbolo e multi-timeframe per il nostro indicatore ACB Breakout Arrows . Con le impostazioni predefinite, analizza i segnali di acquisto/vendita su 28 coppie di valute e 9 timeframe contemporaneamente .  Caratteristiche Può analizzare 252* combinazioni di simboli e timeframe da un singolo grafico. Apre il grafico del segnale con un modello predefinito con un solo clic.  Facile da spostare ovunque sul grafico tramite drag and drop. Avvisi in tempo reale tramite popup,
Skiey
Vitalii Zakharuk
Skiey - Indicator of easy solutions! Using this indicator is very simple, since the simplest is to look at the chart and act according to the color arrows. Such a calculation option takes into account intraday price fluctuations and focuses on measuring the "candlestick" share in the trend. The algorithm takes into account the measurement of prices, this method also emphasizes the measurement of each of the price drops (H / C, H / O, LC, LO) - which gives more detailed information but also mor
Trader Dynamic Index Added Signal – Un approccio scientifico basato sul contesto per l’analisi delle oscillazioni di mercato 1. Introduzione Nell’analisi tecnica moderna, gli oscillatori tradizionali spesso producono segnali isolati , scollegati dal contesto generale del mercato , causando un’alta percentuale di falsi segnali o segnali deboli. Trader Dynamic Index Added Signal (TDI-AS) è stato sviluppato per risolvere questo problema, ridefinendo la generazione di segnali basati sugli oscillator
Visual Trend Reversals — Professional Trend Reversal Indicator for MetaTrader 5 Visual Trend Reversals is a modern and efficient indicator for MetaTrader 5, specifically designed for the timely identification of trend reversal points and analysis of market conditions on any instrument: forex, cryptocurrencies, stocks, indices, and commodities. The indicator is optimized to improve entry quality, minimize false signals, and maximize clarity for traders of any experience level. Key Advantages of V
First time on MetaTrader, introducing IQ Star Lines - an original Vedic Astrology based indicator. "Millionaires don't use astrology, billionaires do" . - J.P. Morgan, Legendary American financier and banker. IQ Star Lines, an unique astrological indicator purely based on   Vedic astrology   calculations, published for the   first time on Metatrader.  This unique tool plots dynamic planetary grid lines based on real-time stars, constellations, and celestial movements, which allows you to plot t
Orderflow Super Candles - Simple Footprint Chart Indicator Platform: MetaTrader 5 (MT5)  (The last screenshot shows the use of the DOM tool in conjunction with the product.) 1. Product Introduction Orderflow Super Candles is a professional charting tool based on underlying Tick data analysis, designed to provide traders with a deep "X-ray" view of the market. By parsing the buy and sell volume distribution within each candlestick, this indicator visualizes the hidden market microstructure. It
CONGESTION BREAKOUT PRO This indicator scans the breakout of congestion zones . This indicator unlike any other congestion indicator you will find in the market right now,  it uses an advanced algorithm not peculiar to most traditional congestion indicators available today . The advanced algorithm used to define the congestions  is greatly responsible for the high rate real congestion zones and low rate fake congestion zones spotted by this product. UNDERSTANDING CONGESTION Congestion are ar
This indicator builds upon the previously posted Nadaraya-Watson smoothers. Here we have created an envelope indicator based on Kernel Smoothing with integrated alerts from crosses between the price and envelope extremities. Unlike the Nadaraya-Watson estimator, this indicator follows a contrarian methodology. Please note that by default this indicator can be subject to repainting. Users can use a non-repainting smoothing method available from the settings. The triangle labels are designed so
Adjustable Consecutive Fractals  looks for 2 or more fractals in one direction and sends out a on screen alert, sound alert and push notification, for strong reversal points . Adjustable Consecutive Fractals, shows the fractals on chart along with a color changing text for buy and sell signals when one or more fractals appear on one side of price. Adjustable Consecutive Fractals is based Bill Williams Fractals . The standard Bill Williams fractals are set at a non adjustable 5 bars, BUT withe th
Regent Street, rather than an expert or an indicator, is an all-in-one trading assistant easing your trading sessions by providing signals and notifications. It's an assistant rather than a robot - "an assisted steering rather than an autopilot", and now, it autoadjusts itself to any instrument, any timeframe & any circumstance. Note from the author: Regent Street's frontend is exactly the same as an other product Ermou Street , but the backend is different. Performances for each are very relati
RBreaker
Zhong Long Wu
RBreaker Gold Indicators is a short-term intraday trading strategy for gold futures that combines trend following and intraday reversal approaches. It not only captures profits during trending markets but also enables timely profit-taking and counter-trend trading during market reversals. This strategy has been ranked among the top ten most profitable trading strategies by the American magazine   Futures Truth   for 15 consecutive years. It boasts a long lifecycle and remains widely used and st
Gli utenti di questo prodotto hanno anche acquistato
ARICoins
Temirlan Kdyrkhan
ARICoin is a powerful trading companion designed to generate high-probability entry signals with dynamic TP/SL/DP levels based on volatility. Built-in performance tracking shows win/loss stats, PP1/PP2 hits, and success rates all updated live. Key Features: Buy/Sell signals with adaptive volatility bands Real-time TP/SL/DP levels based on ATR Built-in MA Filter with optional ATR/StdDev volatility Performance stats panel (Success, Profit/Loss, PP1/PP2) Alerts via popup, sound, push, or email Cust
AriX
Temirlan Kdyrkhan
1 (4)
AriX Indicator for MT5 A powerful trend-following and signal-evaluation tool AriX is a custom MT5 indicator that combines Moving Averages and ATR-based risk/reward logic to generate clear buy/sell signals. It visualizes dynamic SL/TP levels, evaluates past trade outcomes, and displays win/loss statistics in a clean on-chart panel. Key features include: Buy/Sell signals based on MA crossovers ATR-based SL/TP1/TP2/TP3 levels with visual lines and labels Signal outcome tracking with real-time stat
Strumento per market maker. Meravith: Analizzerà tutti i timeframe e mostrerà il trend attualmente in corso. Evidenzierà le zone di liquidità (equilibrio dei volumi) dove i volumi rialzisti e ribassisti sono uguali. Mostrerà tutti i livelli di liquidità dei diversi timeframe direttamente sul grafico. Genererà e presenterà un’analisi di mercato testuale a scopo di riferimento. Calcolerà obiettivi, livelli di supporto e punti di stop-loss in base al trend attuale. Calcolerà il rapporto rischio/ren
OmniSync Projection
Antonio-alin Teculescu
5 (1)
Chronos Fractal Engine is an innovative price projection indicator for MetaTrader 5, designed to transform your technical analysis by intelligently identifying and projecting historical price patterns. Built upon an advanced correlation algorithm and the fractal principles of the market, this powerful tool visualizes potential future price movements, giving you a unique edge in your trading decisions. What is Chronos Fractal Engine? At its core, the Chronos Fractal Engine employs a sophisticat
ARIPoint
Temirlan Kdyrkhan
ARIPoint is a powerful trading companion designed to generate high-probability entry signals with dynamic TP/SL/DP levels based on volatility. Built-in performance tracking shows win/loss stats, PP1/PP2 hits, and success rates all updated live. Key Features: Buy/Sell signals with adaptive volatility bands Real-time TP/SL/DP levels based on ATR Built-in MA Filter with optional ATR/StdDev volatility Performance stats panel (Success, Profit/Loss, PP1/PP2) Alerts via popup, sound, push, or email Cu
L'indicatore " Dynamic Scalper System MT5 " è progettato per il metodo di scalping, ovvero per il trading all'interno di onde di trend. Testato sulle principali coppie di valute e sull'oro, è compatibile con altri strumenti di trading. Fornisce segnali per l'apertura di posizioni a breve termine lungo il trend, con ulteriore supporto al movimento dei prezzi. Il principio dell'indicatore. Le frecce grandi determinano la direzione del trend. Un algoritmo per generare segnali per lo scalping sott
SunSignal ML — AI Gold Signals with Multi-Timeframe Confluence SunSignal ML is an advanced AI-powered signal indicator purpose-built for XAUUSD gold trading. It combines a proprietary adaptive trend algorithm with six machine learning models trained on confirmed price pivots to produce high-confidence entry signals with multi-timeframe validation. The indicator runs efficiently on M1, M5 and M15 timeframes and is designed for traders who want precision entries guided by data rather than guesswor
CGE Trading Suite
Carl Gustav Johan Ekstrom
5 (1)
CGE Trading Suite delivers the analytical edge typically reserved for professional trading desks. The platform integrates a full suite of analytical tools into one seamless workflow: dynamic grid mapping, liquidity behavior analysis, ECM, trend lines, MIDAS, trade cycles, and directional channel projections. Together, these provide a unified view of market structure and momentum. Directional clarity is further enhanced by the capital flow index, which measures currency basket strength to identif
ARIScalping
Temirlan Kdyrkhan
ARIScalp is a powerful trading companion designed to generate high-probability entry signals with dynamic TP/SL/DP levels based on volatility. Built-in performance tracking shows win/loss stats, PP1/PP2 hits, and success rates all updated live. Key Features: Buy/Sell signals with adaptive volatility bands Real-time TP/SL/DP levels based on ATR Built-in MA Filter with optional ATR/StdDev volatility Performance stats panel (Success, Profit/Loss, PP1/PP2) Alerts via popup, sound, push, or email Cus
L’indicatore evidenzia le zone in cui viene dichiarato interesse sul mercato , per poi mostrare la zona di accumulo degli ordini . Funziona come un book degli ordini su larga scala . Questo è l’indicatore per i grandi capitali . Le sue prestazioni sono eccezionali. Qualsiasi interesse ci sia nel mercato, lo vedrai chiaramente . (Questa è una versione completamente riscritta e automatizzata – non è più necessaria un’analisi manuale.) La velocità di transazione è un indicatore concettualmente nuo
TrendMaestro5
Stefano Frisetti
Attenzione alle truffe, questo indicatore e' distribuito esclusivamente su MQL5.com nota: questo indicatore e' per METATRADER5, se vuoi la versione per  METATRADER4 questo e' il link:   https://www.mql5.com/it/market/product/108106 TRENDMAESTRO ver 2.5 TRENDMAESTRO   riconosce un nuovo TREND sul nascere, non sbaglia mai. La sicurezza di identificare un nuovo TREND non ha prezzo. DESCRIZIONE TRENDMAESTRO identifica un nuovo TREND sul nascere, questo indicatore prende in esame la volatilita' i
Weis Wave with Alert MT5
Trade The Volume Waves Single Member P.C.
4.94 (17)
Rental/Lifetime Package Options and Privileges  Rent Monthly Six Months   Yearly/Lifetime Weis Wave with Speed with Alert+Speed Index x x x Manual  x x x Quick Set up Video x x x Blog x x x Lifetime Updates x x x Setup and Training Material x x Discord Access Channel "The SI traders"          x Rectangle Break Alert Tool      x How to trade with it:    http://www.tradethevolumewaves.com   ** If you purchase please contact me to setup your  : Training Room and  complete manual access.  Wei
Rtc ML Ai Predictor
Muhammad Faisal Sagala
Rtc ML Ai | Predictor CORE MACHINE LEARNING ENGINE Adaptive ML Market Predictor – Multi-Bar Trend & Candle Forecast What This Indicator Does This indicator is a  real-time market prediction engine  designed to analyze price behavior and estimate  future market tendencies . Unlike conventional indicators, this system  does not rely on static parameters or historical curve-fitting , but adapts its internal state dynamically during live market operation. Instead of using static rules, the indic
Max Ribbon Mt5
Stefano Frisetti
ATTENZIONE: Questo indicatore è distribuito ESCLUSIVAMENTE su MQL5.com Versione MT4:   https://www.mql5.com/it/market/product/160363 Versione MT5:   https://www.mql5.com/it/market/product/160410 ================================================================================ MAX RIBBON ver 1.00 L'indicatore che ti mostra il TREND in modo chiaro e inequivocabile! ================================================================================ DESCRIZIONE MAX RIBBON è un indicatore di trend
IVISTscalp5
Vadym Zhukovskyi
5 (6)
What's new about iVISTscalp5 forecast indicator (Version 10)? iVISTscalp5 is a unique nonlinear forecasting for a week ahead system for any financial instrument which executes fast scalping using time levels. iVISTscalp5 is a tool for easy study and understanding of financial market. 1) iVISTscalp5 forecast indicator has been completely rewritten into another programming language (C++), which has accelerated data loading and processing. As a result, a different graphical display of forecasts
+++++++++++++++++++++++++++++++++++++++++++++++++++++++++++++++++++++++++++++++++++++++++++++++++ +++ Link to EURUSD Only Free Version -->  https://www.mql5.com/en/market/product/156904?source=Unknown +++++++++++++++++++++++++++++++++++++++++++++++++++++++++++++++++++++++++++++++++++++++++++++++++ Hallo Trader, This is a traditional GANN & FIBONACCI strategy based on detection of an impulsive move in the opposite direction. This is called a Breakout. At the moment of Breakout, the indicator draw
Big Player Range
Thalles Nascimento De Carvalho
5 (3)
BigPlayerRange – Il miglior indicatore per MT5 BigPlayerRange è considerato il miglior indicatore per Mini Indice e Mini Dollaro su MetaTrader 5. Questo strumento essenziale evidenzia le zone strategiche di azione dei grandi player, offrendo un’analisi tecnica istituzionale di altissima precisione. Come usare BigPlayerRange: Questo indicatore mostra zone di acquisto (linea verde) e di vendita (linea rossa). Quando il prezzo chiude fuori da queste aree, è probabile un movimento di tendenz
Frontier Pivots
Nestor Jose Mendez Boza
FRONTIER PIVOTS - Geometric Levels Indicator This indicator plots support and resistance levels/ranges on the chart using mathematical calculations. It helps traders identify potential price reaction zones based on geometric patterns. Main Features: Automatically calculates and displays key price levels Plots both support and resistance lines Uses daily price data for level calculation Clean visual presentation with different colors for different level types No repainting - levels remain static
Jita Indicator Pro MT5 | All Timeframes Professional Trend Agreement System – Premium Edition ($500) What Is Jita Indicator Pro? Jita Indicator Pro is a structured trend-confirmation system designed for serious traders who value precision, alignment, and controlled signal behavior. It combines: Advanced band-based trend direction logic ATR-driven structural trigger engine Dual-confirmation agreement system Locked history update design This indicator prints signals only when multiple conditions
VTrende Pro
Andrii Diachenko
5 (1)
VTrende Pro - MTF indicator for trend trading with a display panel for MT5 *** Videos can be translated into any language using subtitles (video language - Russian) Although the signals of the VTrende Pro indicator can be used as signals of a full-fledged trading system, it is recommended to use them in conjunction with the Bill Williams TS. VTrende Pro is an extended version of the VTrende indicator. Difference between Pro version and VTrende: - Time zones - Signal V - signal 1-2 waves -    S
Recommended TimeFrame >= H1. 100% Non Repainted at any moment.  Use it carefully, only with Trend Direction. Trading Usage: 2 Variants: as Range System or as BreakOut System (Both Only With Trend Direction)::: (Always use StopLoss for minimise Risk); [1] as Range System: (Recommended) in UP TREND:  - BUY in Blue Line , then if price goes down by 50 points (on H1) open Second BUY.   Close in any Profit you wish: TrailingStop(45 points) or Close when Price touches upper Gold Line. in DOWN TREND
FXLAND Smart Reversal Indicator (MT5) FXLAND Smart Reversal Indicator is a professional technical analysis tool designed to help traders identify potential price reversal zones and key market turning points with clarity and precision. The best reversal indicator and price return by choosing only one ceiling or floor in each time frame A masterpiece of combining mathematics and Gann, fractal matrix, Fibonacci, movement angle and time. Completely intelligent Key Features Detects potenti
Pantera Indicator
Temirlan Kdyrkhan
5 (1)
A tool for on-chart strategy backtesting and performance analysis. A utility for developing, debugging, and testing custom trading ideas and indicator functions. An indicator designed to quickly test trading concepts and visualize the effectiveness of different input parameters. An all-in-one sandbox for testing everything from simple crossovers to complex, multi-condition trading systems.
AlgoEAs Trend Dashboard V1 Indicator for MT5 Introduction: This is a Dashboard Indicator based on 7 built in Multi Timeframe indicators. This strategy gives Buy/Sell Ideas based on 9 trend states. Easy to view gas guage to view current trend. Has as optional Alerts to enable with 9 messages. Run on M15 chart, with M15, H1, and H4 indicator time frames. Great tool! Features: Non-Repainting Dashboard For Desktop MT5 Only, Works On Any Mt5 Pair Great for Intraday and Swing Trading Easy view gas
WanaScalper
Isaac Wanasolo
1 (1)
A scalping indicator based on mathematical patterns, which on average gives signals with relatively small SL, and also occasionally helps to catch big moves in the markets (more information in the video) This indicator has three main types of notifications: The first type warns of a possible/upcoming signal on the next bar The second type indicates the presence of a ready signal to enter the market/open a position The third type is for SL and TP levels - you will be notified every time price re
Historical Similarity Matcher Indicator (HI.SI.MA) Try it free today — demo version now available!   https://www.mql5.com/en/market/product/167114 Overview The Historical Similarity Matcher is a technical analysis indicator for MetaTrader 5. It scans historical price data to find segments that show statistical similarity to a user-selected reference period on the chart.
XCalper TFO
Aecio de Feo Flora Neto
This oscillator was developed exclusively by xCalper in 2015 based on moving averages calculations to indicate and try predicting oversold and overbought levels. The fast line (white, by default) oscillates basically between values -0.5 (oversold) and +0.5 (overbought). Whenever this line crosses upward value -0.5, it means an oversold price level. When it crosses downward value +0.5, it means an overbought price level. When fast line crosses value 0.0 and returns, it is a strong pull-back indic
The Expert Advisor and the video are attached in the Discussion tab . The robot applies only one order and strictly follows the signals to evaluate the indicator efficiency. Pan PrizMA CD Phase is an option based on the Pan PrizMA indicator. Details (in Russian). Averaging by a quadric-quartic polynomial increases the smoothness of lines, adds momentum and rhythm. Extrapolation by the sinusoid function near a constant allows adjusting the delay or lead of signals. The value of the phase - wave s
Классификатор силы тренда. Показания на истории не меняет. Изменяется классификация только незакрытого бара. По идее подобен полной системе ASCTrend, сигнальный модуль которой, точнее его аппроксимация в несколько "урезанном" виде, есть в свободном доступе, а также в терминале как сигнальный индикатор SilverTrend . Точной копией системы ASCTrend не является. Работает на всех инструментах и всех временных диапазонах. Индикатор использует несколько некоррелируемых между собой алгоритмов для класси
FFx Universal Strength Meter PRO is more than a basic strength meter. Instead of limiting the calculation to price, it can be based on any of the 19 integrated strength modes + 9 timeframes. With the FFx USM, you are able to define any period for any combination of timeframes. For example, you can set the dashboard for the last 10 candles for M15-H1-H4… Full flexibility! Very easy to interpret... It gives a great idea about which currency is weak and which is strong, so you can find the best pai
Altri dall’autore
TradePilot Execution Utility The Ultimate Execution & Risk Management Dashboard TradePilot Execution Utility is a high-performance trade management dashboard built specifically for professional manual traders and those undertaking Prop Firm challenges . It bridges the gap between complex risk mathematics and rapid execution, ensuring you never miss a setup or over-leverage your account. 1. Visual Risk-Based Lot Sizing Forget manual calculators. TradePilot uses your chart as the primary interface
SmartRR Visual Planner
Raymond Paul Raphael
SmartRR Visual Planner is a high-performance utility designed to eliminate manual calculations and human error from your trading workflow. Built for speed and precision, it allows you to visually map out trades using a drag-and-drop interface while providing real-time professional risk metrics. KEY FEATURES 1. Interactive Visual Planning Stop guessing your levels. With one click, the tool generates three distinct, selectable lines (Entry, Stop Loss, and Take Profit) directly on your chart. Seaml
Filtro:
Nessuna recensione
Rispondi alla recensione