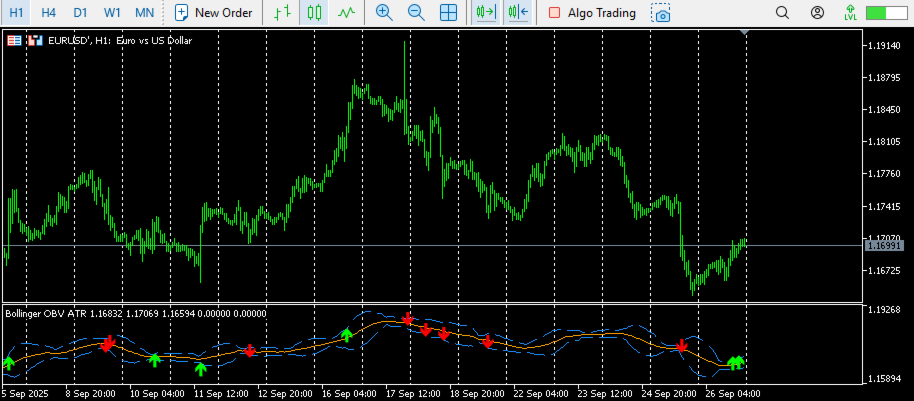
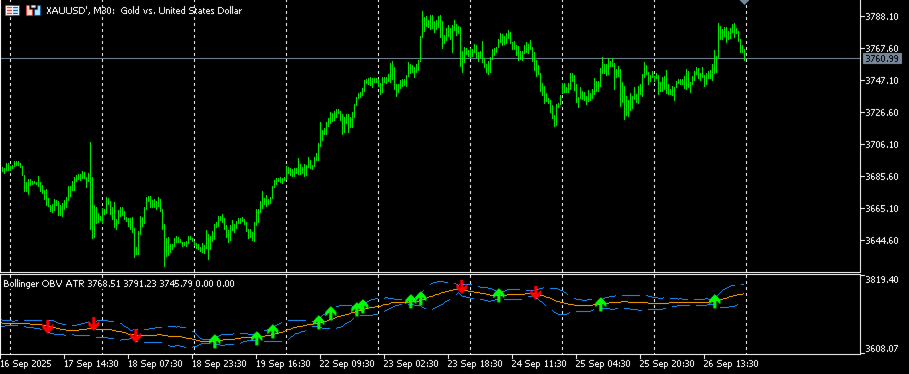
Smart Flow Bands
- Indicatori
- Versione: 1.3
- Aggiornato: 31 dicembre 2025

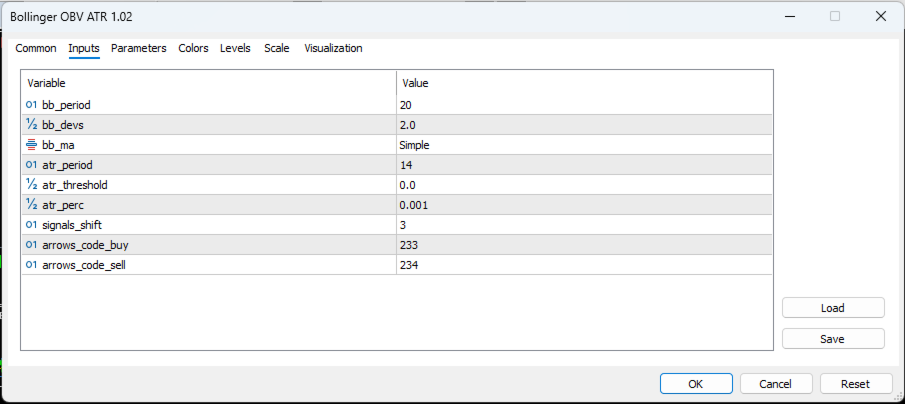
1. Bollinger Band condition
-
The current candle must close at or above the Upper Bollinger Band.
-
This signals potential overbought conditions.
2. OBV confirmation (On Balance Volume)
-
OBV must be falling → OBV_now < OBV_prev .
-
Stronger confirmation: OBV decreasing for 2–3 consecutive bars.
-
This shows that buying pressure is weakening.
3. ATR filter (Average True Range)
-
Current ATR must be below its moving average (e.g., ATR_now < ATR_SMA(14) * 1.2 ).
-
Purpose: avoid entering sells when the market is too volatile (false breakouts).
4. Price action confirmation (optional but recommended)
-
A bearish candle forms after the Upper BB touch.
-
Example: candle closes lower than the middle of the previous bar or below the Bollinger middle line.
-
This adds price confirmation to the signal.
✅ If all the above are true → Sell signal is generated.
Stop Loss (SL) & Take Profit (TP)-
Stop Loss (SL):
-
Above the Upper Bollinger Band by + 0.5 * ATR
-
Or above the recent swing high (safer option).
-
-
Take Profit (TP):
-
TP1: Middle Bollinger Band (partial exit).
-
TP2: Lower Bollinger Band
-
Or use fixed Risk:Reward (e.g., 1:1.5 or 1:2).
-
-
Dynamic Exit Rule:
-
Exit early if price closes above Middle BB (invalidates sell).
-
Exit if OBV turns upward (OBV_now > OBV_prev → money flow back to buying).
-
-
Risk 1–2% max per trade.
-
Limit to 1 trade per timeframe per day to avoid overtrading.
-
Avoid trading during major economic news.
-
ATR is above filter level ( ATR_now > ATR_SMA * 1.2 ).
-
OBV not declining.
-
Candle closes above Upper BB again (breakout continuation).
-
Best timeframes: H1, H4, Daily (stronger signals).
-
Scalping (M1–M15) works but has more noise.
-
Always backtest & demo test before real money use.