Horizontal Grid
- Indicatori
- Versione: 2.0
- Aggiornato: 26 settembre 2025
- Attivazioni: 5

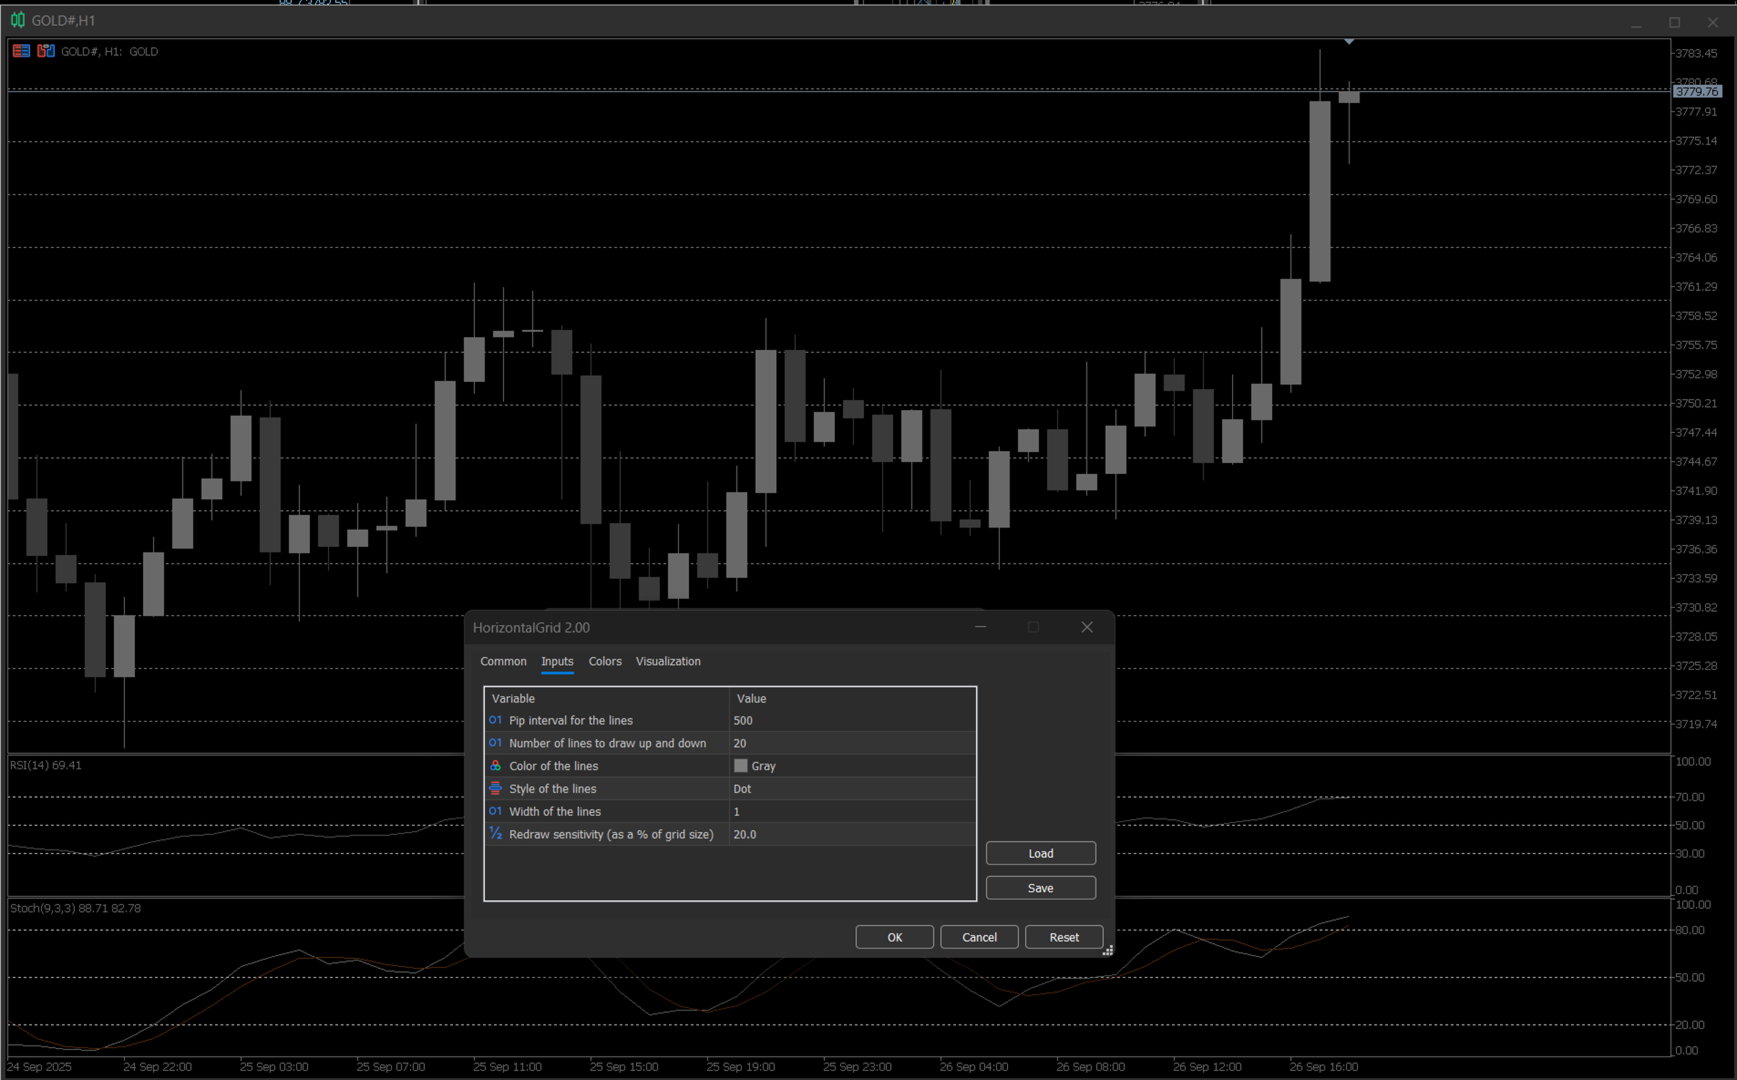
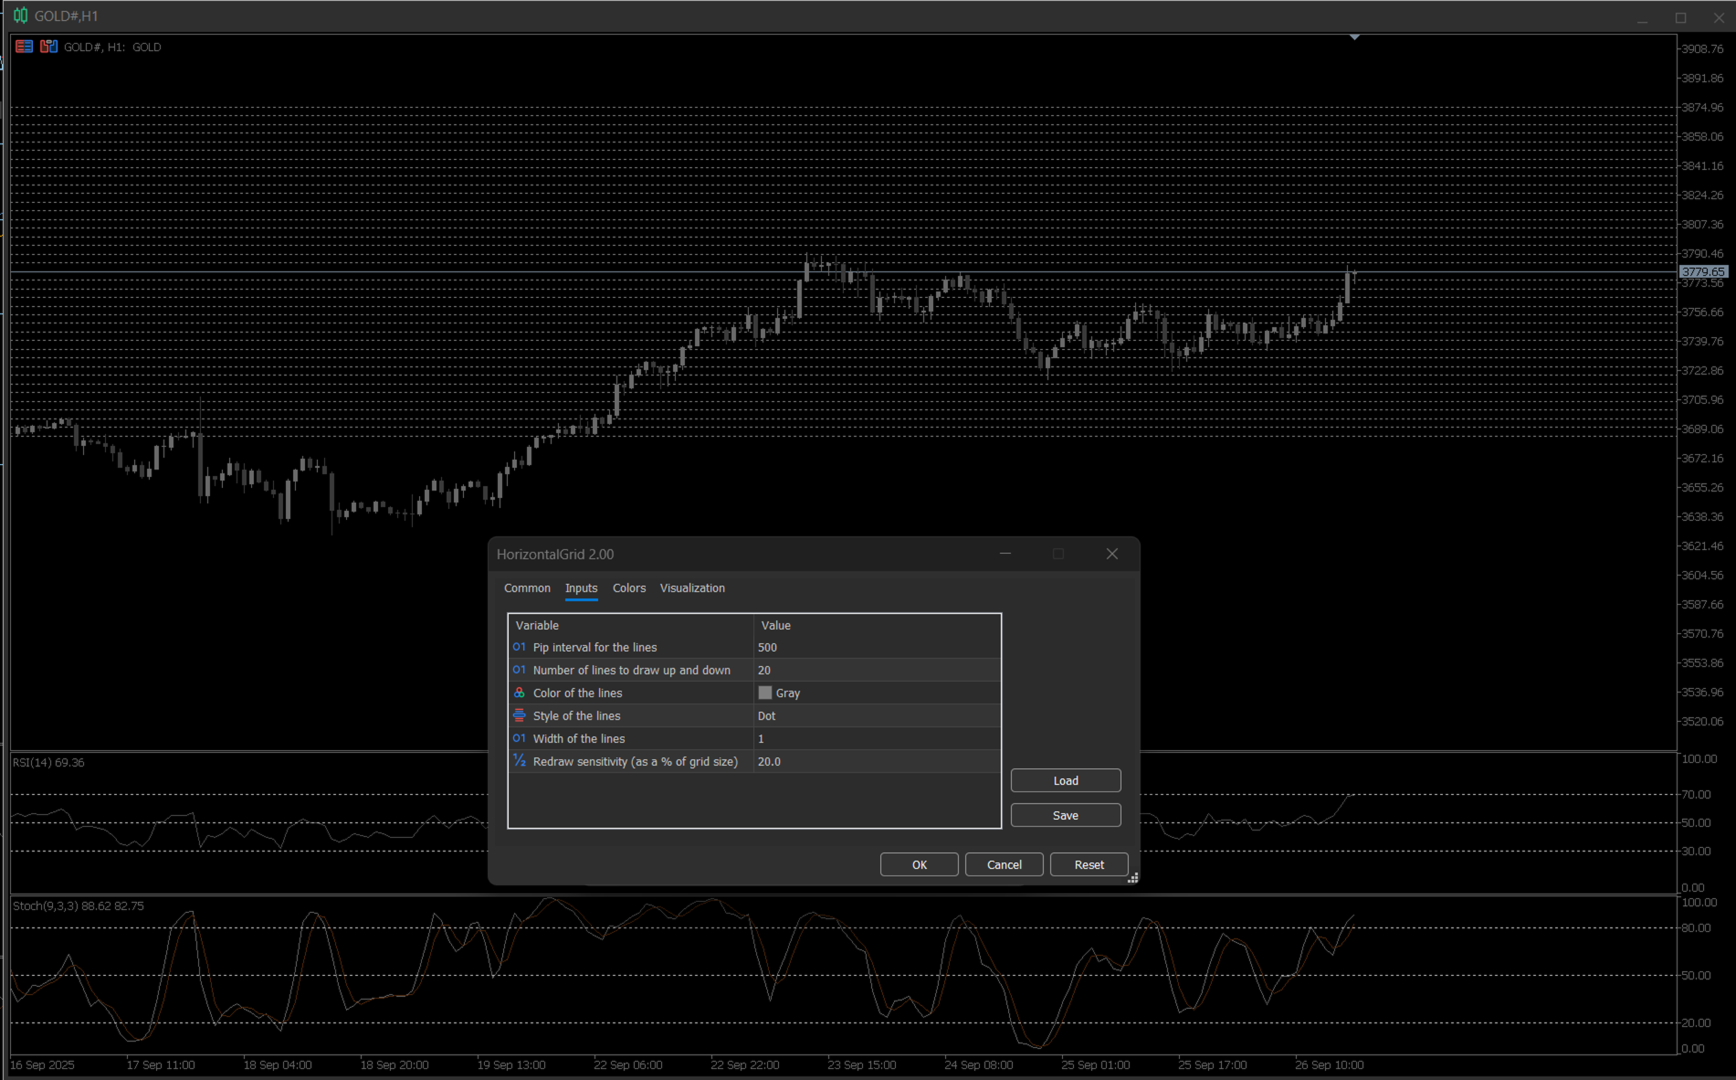
Horizontal Grid Indicator
This is a simple utility indicator for MetaTrader 5 that draws a customizable horizontal grid directly on your chart. Its primary goal is to help traders visualize price levels, support/resistance zones, and potential profit targets at fixed pip intervals.
Key Features
-
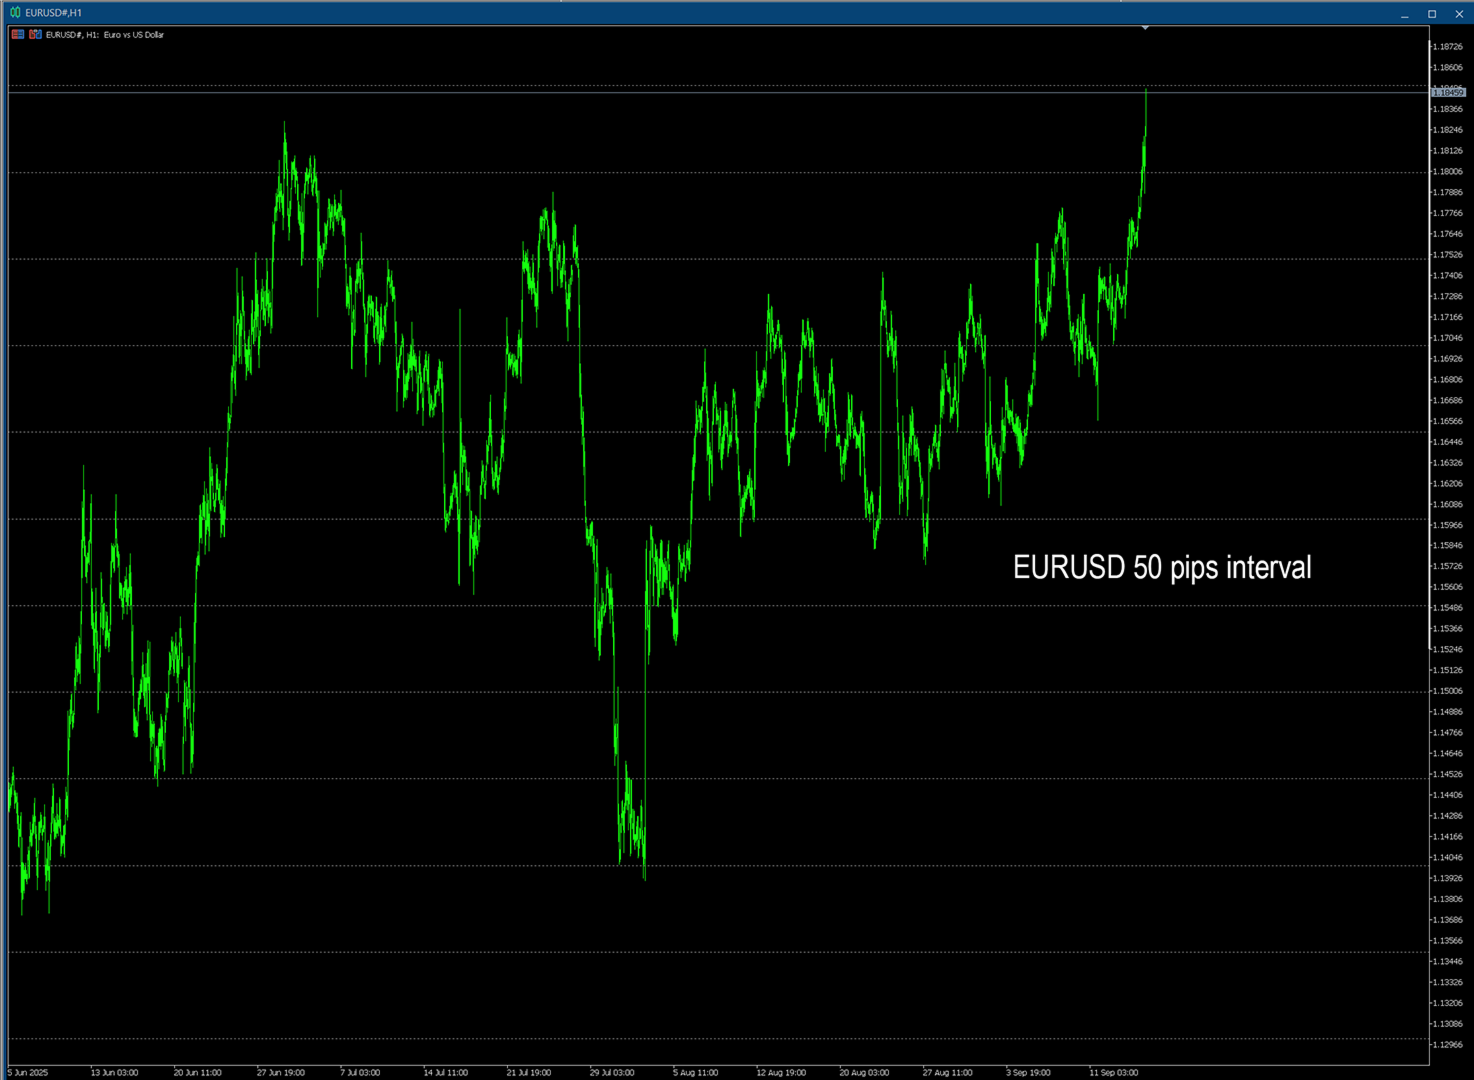
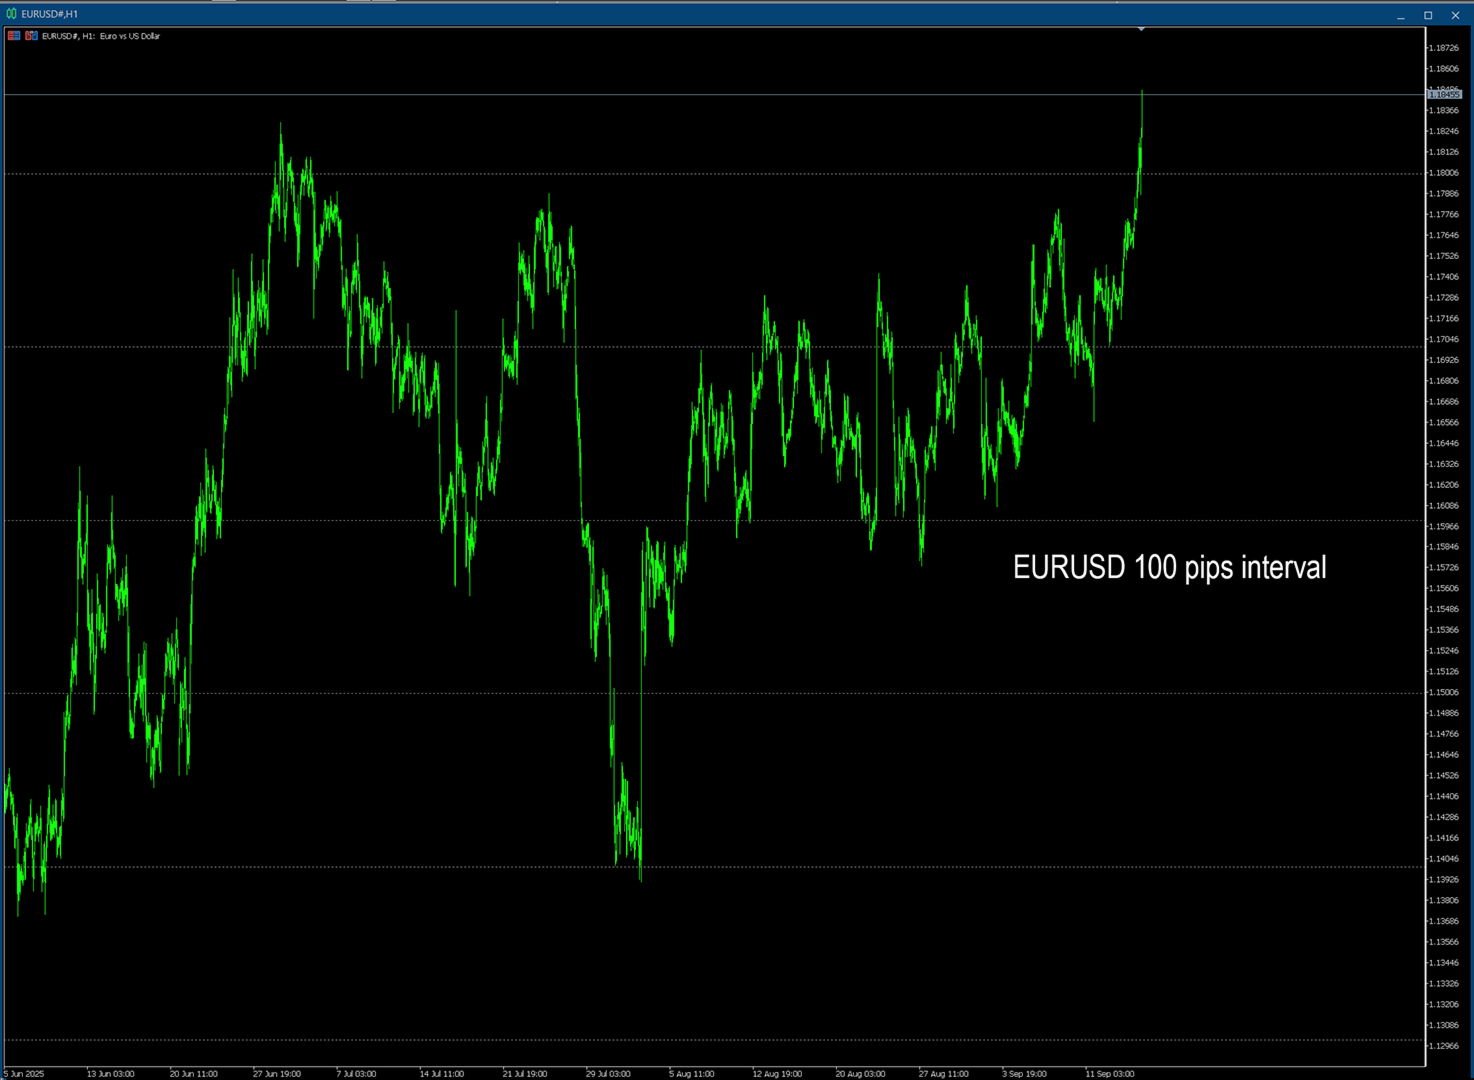
Customizable Spacing: You can set the distance between the lines in pips (e.g., every 50 pips or X pips).
-
Dynamic and Adaptive: The grid automatically adjusts to what you see on the screen, drawing lines only in the visible price range as you scroll and zoom.
-
Visual Customization: You can change the color, style (dotted, solid, etc.), and thickness of the grid lines to match your chart's theme.
-
The indicator draws horizontal line above and below from the current price( round to the closet price which has last digit is zero.)