Selected Range Volume

Selected Range Volume — Buyers and Sellers Balance + Volume Levels

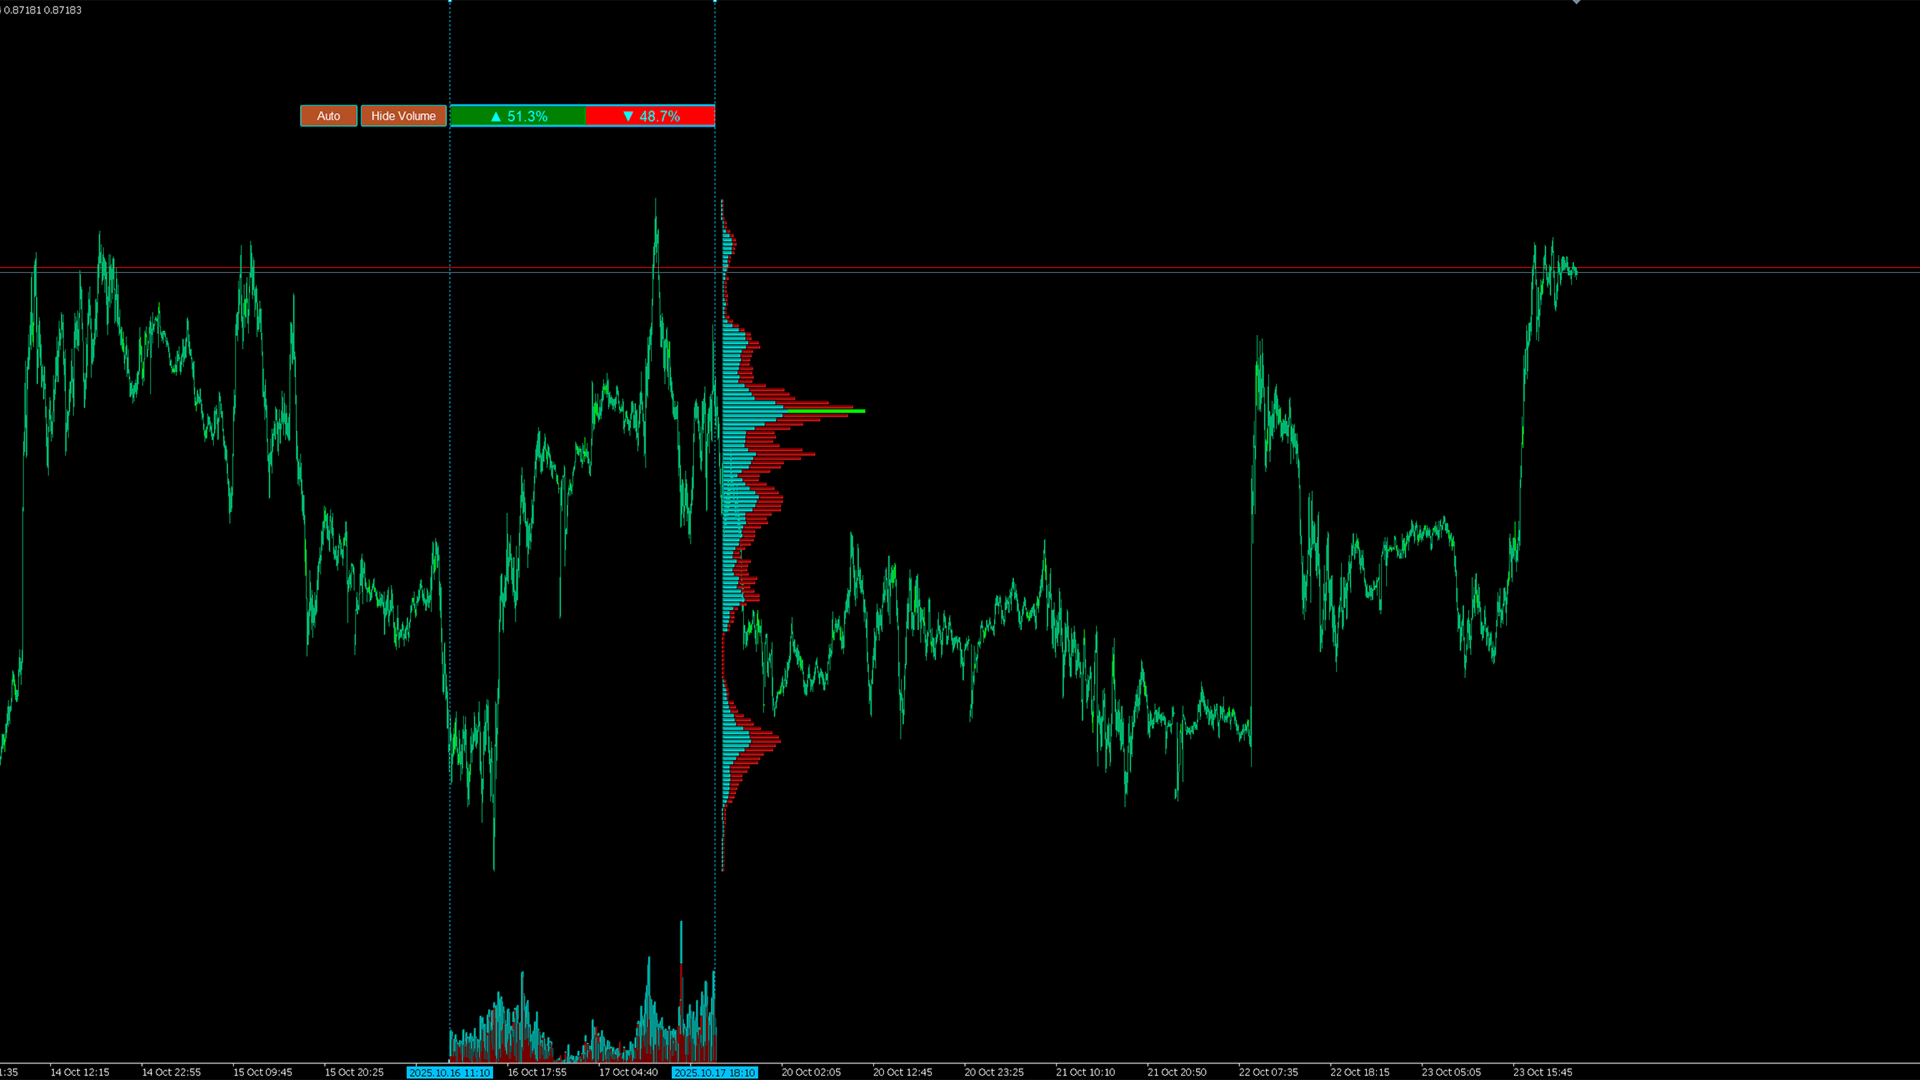
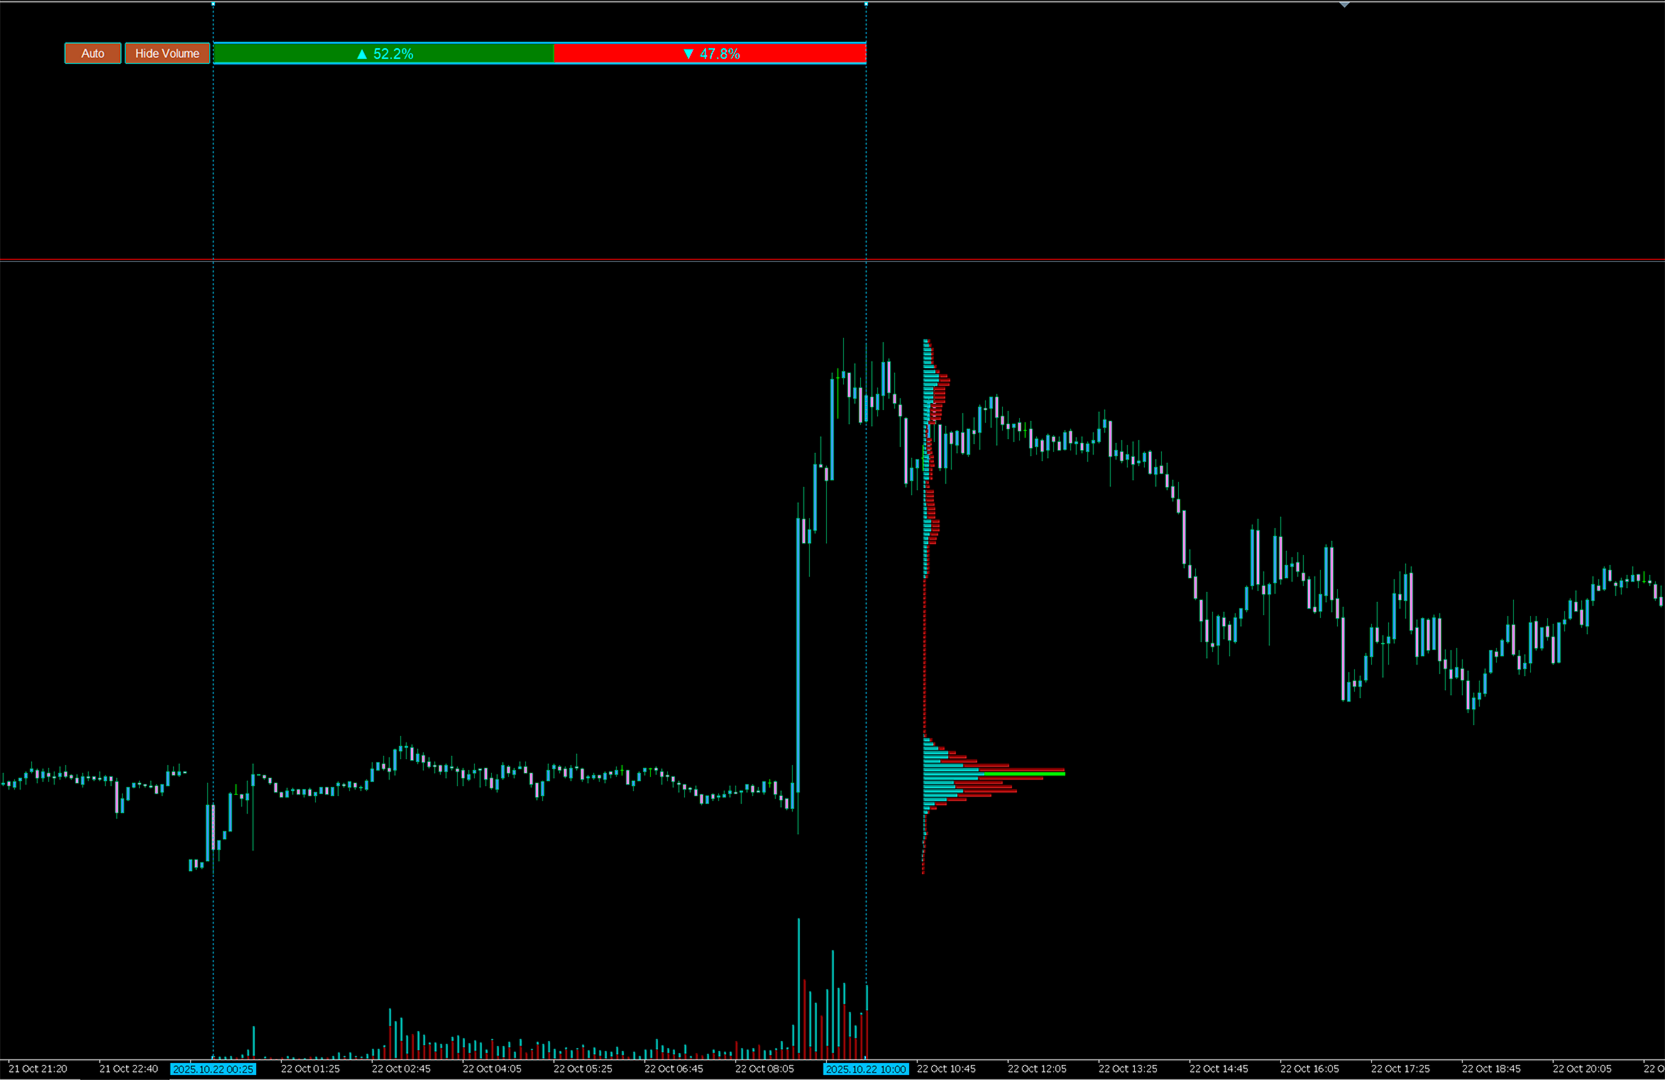
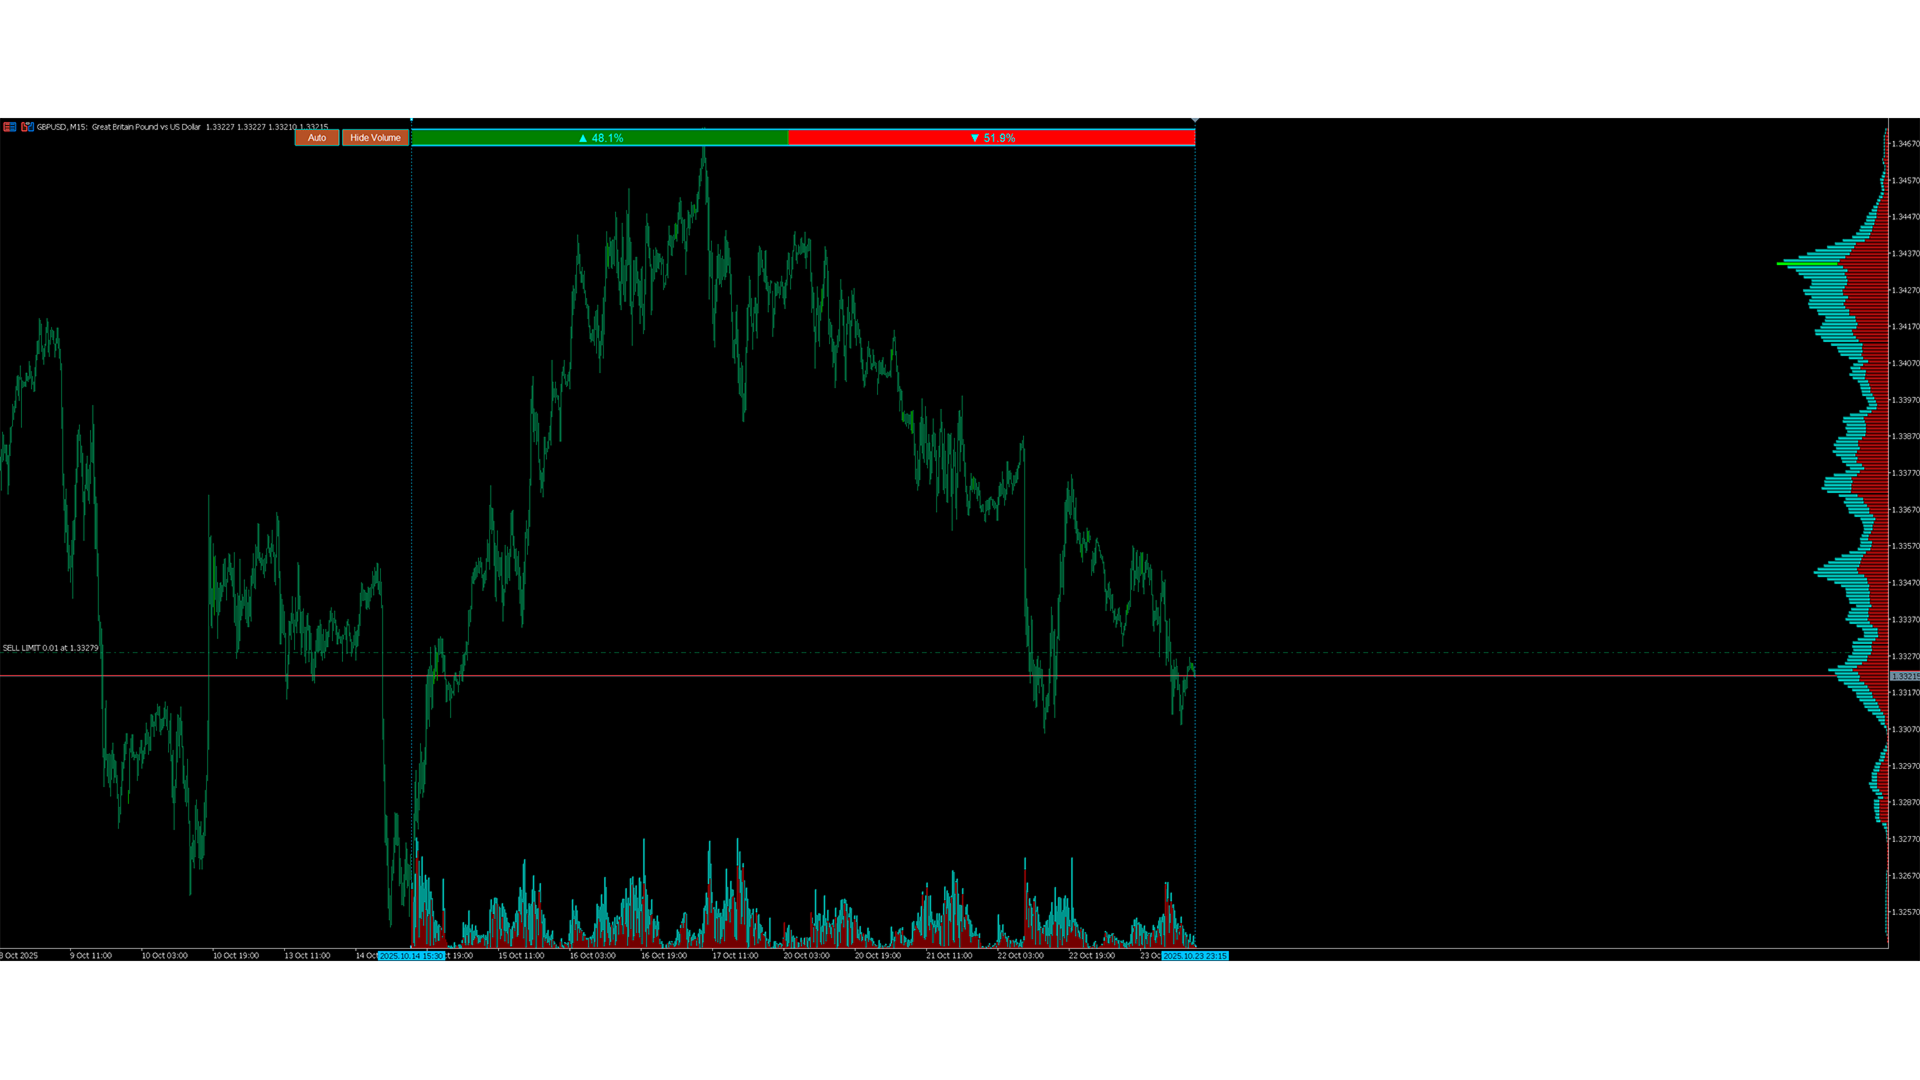
Selected Range Volume is an advanced indicator for analyzing volumes and the imbalance between buyers and sellers. It doesn't just show where the volume was—it highlights who exactly dominated: buyers or sellers, and where the market might stop in the future.

You select any section of the chart, and the indicator instantly calculates the volume activity within the range, builds a volume profile by prices, and displays the balance of power between the sides (Buy/Sell) in percentages and color visualization.

Key features:

  • Interactive range: Move the Start and End lines directly on the chart to analyze any price section.

  • Buyers and sellers balance: The indicator accurately calculates the share of buys and sells in the selected range and displays their ratio in percentages.

  • Horizontal volume profile: Shows where the volume is concentrated on the price scale—from activity zones to voids.

  • Edges of horizontal volume valleys—these are potential levels where the price is highly likely to stop or react in the future. These zones often become support or resistance.

  • Vertical volume bars: Visualize the volume structure by bars, helping to see the dynamics within the range.

  • Auto / Fixed modes:

    • Auto — the range automatically rebuilds based on the latest market swings;
    • Fixed — the range is fixed for detailed analysis of the selected section.
  • Show/Hide Volume button: Enable or hide the profile with one click.

  • Full interactivity: Lines, range, and buttons can be freely moved directly on the chart.

  • Tooltips: Hover to display precise data on buy volume, sell volume, and the percentage advantage of the side.

  • Automatic saving: All settings and positions are restored upon terminal restart.
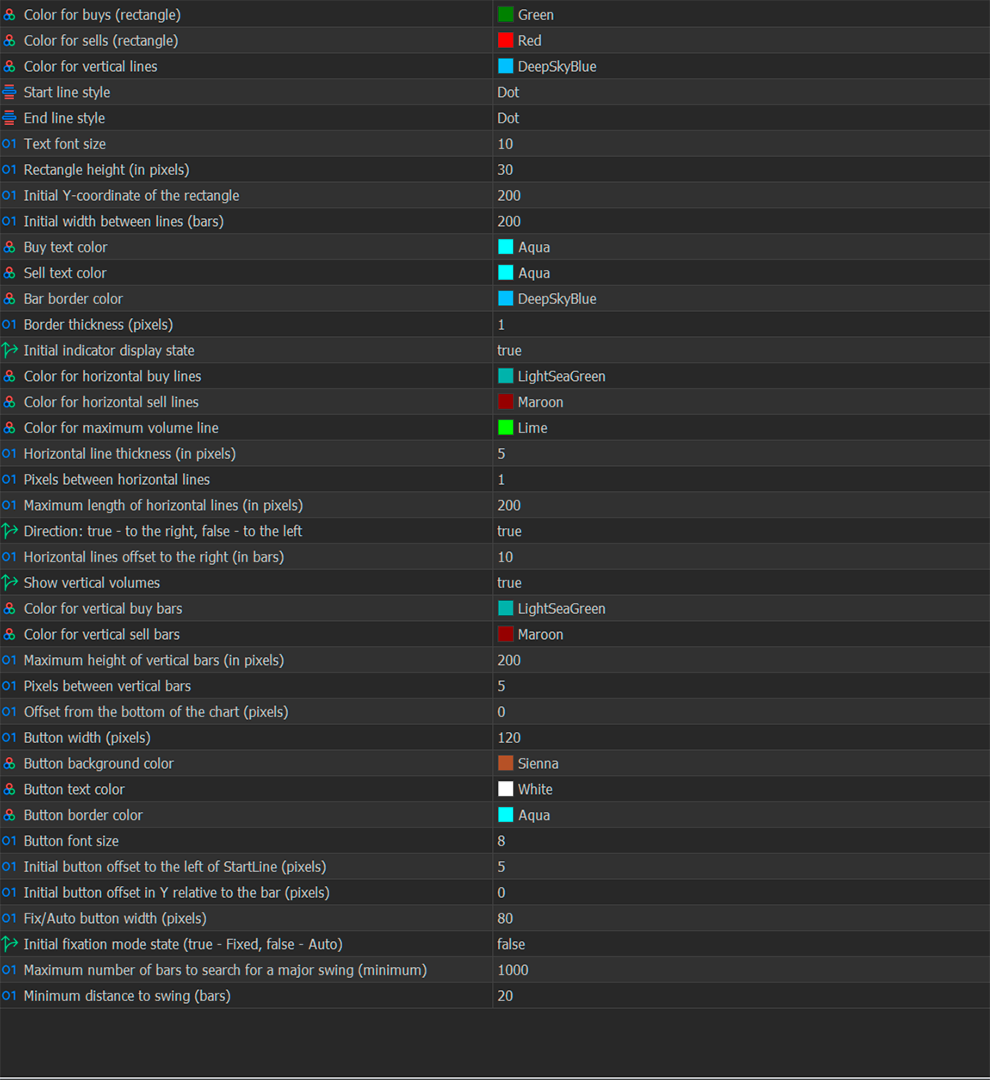
Settings:

  • Colors, sizes, and styles for all elements (bars, lines, text, buttons);
  • Profile thickness, direction (right/left), height, and offsets;
  • Swing search depth and range width settings;
  • Option to enable or disable horizontal and vertical volumes.

Who will find it useful:

  • Traders using volume analysis (VSA, Volume Profile, Market Balance);
  • Those who want to see not just volumes, but the ratio of buyers and sellers within the range;
  • Scalpers, intraday, and swing traders looking for imbalance points, liquidity levels, and price stop zones.

Advantages:

  • Shows the real Buy/Sell volume ratio within the range;
  • Combines horizontal and vertical volume analysis in one tool;
  • Identifies potential support and resistance levels based on volume structure;
  • Simple to use and doesn't require third-party data;
  • Works on all instruments and timeframes in MetaTrader 5;
  • Helps find accumulation zones, reactions, and reversals with high accuracy.

Prodotti consigliati
Price Volume Trend (PVT) Oscillator Description:  The PVT Oscillator is a volume indicator that serves as an alternative to the standard On-Balance Volume (OBV). While ordinary volume indicators can be noisy and hard to read, this tool converts volume flow into a clear Histogram Oscillator, similar to a MACD, but for Volume. It is designed to detect first  Trend Reversals and Divergences by analyzing the difference between a Fast and Slow PVT moving average. Why is this better than standard OBV?
FREE
Horizontal Volumes Indicator - using a histogram, displays the volume of transactions at a certain price without reference to time. At the same time, the histogram appears directly in the terminal window, and each column of the volume is easily correlated with the quote value of the currency pair. The indicator practically does not require changing the settings, and if desired, any trader can figure them out. The volume of transactions is of great importance in exchange trading, usually an inc
Forex Volume MT5
KEENBASE SOFTWARE SOLUTIONS
KT Forex Volume mostra il volume di acquisto e vendita di una coppia di valute sotto forma di istogramma colorato. Il volume è composto dalle transazioni di acquisto e vendita su un asset. Nel mercato Forex: Se il volume di acquisto supera quello di vendita, il prezzo della coppia di valute tende a salire. Se il volume di vendita supera quello di acquisto, il prezzo della coppia di valute tende a scendere. Caratteristiche Evita operazioni sbagliate confermandole con i dati di volume per tick. T
Smart FVG Stats
- Md Rashidul Hasan
5 (1)
The  Smart FVG Statistics Indicator  is a powerful MetaTrader 5 tool designed to automatically identify, track, and analyze Fair Value Gaps (FVGs) on your charts. Love it? Hate it? Let me know in a review! Feature requests and ideas for new tools are highly appreciated. :) Try "The AUDCAD Trader": https://www.mql5.com/en/market/product/151841 Key Features Advanced  Fair Value Gap  Detection Automatic Identification : Automatically scans for both bullish and bearish FVGs across specified histo
FREE
True TrendLines MT5 - Smart Trend Detection & Alerts Overview True TrendLines MT5 is a professional-grade technical analysis tool that automatically identifies and plots high-probability trend lines on your MetaTrader 5 charts. Using a sophisticated swing point detection algorithm, it helps traders visualize key market structure and potential reversal points with precision. Key Features Automatic Trend Line Detection Identifies valid swing highs and lows based on your chosen strength paramet
FREE
Daily & Composite Volume Profile   This is a professional-grade market profile tool designed for MetaTrader 5. It utilizes a   Dual-Profile System   to visualize supply, demand, and liquidity concentrations. Key Features Left Side: Daily Session Profiles Automatically identifies the start and end of every trading day. Generates a unique Volume Profile for each individual day. Allows you to see how value migrated from yesterday to today (e.g., Is today's volume higher or lower than yesterday?).
The Supply and Demand Zone Indicator is a powerful and easy-to-use tool designed to help traders identify critical supply and demand zones on the chart. These zones can provide valuable insight into potential market reversals, breakouts, and important price levels where buyers or sellers are likely to take control. The best   FREE Trade Manager . If you want to create your own Hedging or Grid strategies without any coding make sure to check out the   ManHedger Key Features: Automatic Zone Detect
FREE
PivotWave
Jeffrey Quiatchon
Introducing PivotWave – your ultimate trading companion that redefines precision and market analysis. Designed with traders in mind, PivotWave is more than just an indicator; it’s a powerful tool that captures the pulse of the market, identifying key turning points and trends with pinpoint accuracy. PivotWave leverages advanced algorithms to provide clear visual signals for optimal entry and exit points, making it easier for traders to navigate volatile market conditions. Whether you are a begin
Anchored VWAP (with no Volume) A unique development of one of the most useful VWAP indicators. This product allows you to get away from using the basics of VWAP, namely the volume. Everything is calculated without it. In addition, a convenient system for selecting starting points has been developed - by moving the "starting field" you indicate to the script the area, in which the extremum, from which the calculation will start, should be searched for. The main advantages of this development: con
(Special New Year promotion - free price!) The indicator displays the actual 'Scale in points per bar' (identical to the manual setting in the Terminal, see screenshot) in the upper right corner of the chart. The displayed value changes INSTANTLY whenever the chart scale is changed! (This is very convenient when planning screenshots). In Settings: Change language (Russian/English), font size of the displayed text, text label offset coefficient from the graph corner, equally in X and Y directi
FREE
• Please test the product in the Strategy Tester before purchasing to understand how it works. • If you face any issues, contact me via private message—I’m always available to help. • After purchase, send me a screenshot of your order to receive a   FREE EA   as a gift. Range Directional Force Indicator – Designed for You to Optimize! The Range Directional Force Indicator is a cutting-edge tool designed to empower traders by visualizing market dynamics and directional strength. Built to offer i
MTForge Volume AI
Hyumilkumar Suryakantbhai Patel
MTForge Volume AI — User Guide This indicator gives you a real-time dashboard on your chart that breaks down volume into buying and selling pressure, so you can see who's in control — buyers or sellers — at both the daily session level and the individual bar level. SESSION Row — This always shows the full day's picture. It tells you what percentage of today's total volume is buying vs selling, the actual buy and sell volume numbers, the delta (difference between buy and sell), and how imbalance
Clarity Pulse Detector
Camila Bernardez Camero
Clarity Pulse Detector Clarity Pulse Detector analizza le barre chiuse e le barre di volume associate per identificare vere inversioni di tendenza senza fare affidamento sui dati futuri. L’indicatore calcola la forza dell’impulso basandosi sui parametri SSP (Signal Strength Parameter) configurabili e confronta massimi e minimi recenti per individuare i punti di rottura. Quando viene rilevata un’inversione valida, l’indicatore mostra un cerchio verde sotto una barra rialzista come segnale di a
**Indicatore Strumento Rettangolo di Offerta e Domanda Intelligente: La tua guida definitiva per MT5** L'Indicatore Strumento Rettangolo di Offerta e Domanda Intelligente è il tuo compagno ideale per MT5, progettato per visualizzare istantaneamente i dati chiave di offerta e domanda, proprio dove ne hai bisogno: sulle tue zone, in tempo reale. Questo strumento sovrappone automaticamente dati ricchi e actionable sopra le tue zone, come la classificazione della zona, la distanza in pip, la forz
Title: Smart VP: Buy/Sell Bars + POC Description: Enhance your trading with the Right Anchored Volume Profile. Visualize buy and sell volumes per price level with near-bar numbers and identify the Point of Control (POC) instantly. Perfect for traders who want clear market structure at a glance. Features: Right Anchored Volume Profile Buy/Sell volume bars Near-bar volume numbers POC (Point of Control) line Customizable colors and display settings
L'indicatore Trend Speaker è uno strumento potente progettato per i trader che vogliono monitorare e analizzare facilmente le tendenze del mercato in tempo reale. Fornisce segnali di acquisto e vendita chiari e affidabili sul grafico, rendendo estremamente conveniente valutare l'attuale tendenza del mercato. Con la sua interfaccia intuitiva, Trend Speaker garantisce che non perderai mai una potenziale opportunità di trading, aiutandoti a prendere decisioni informate e migliorare la tua strategia
Sentimento de Mercado
OTAVIO AGUIAR CAMPOS Aguiar
Sentimento de Mercado é um indicador que usa os dados do nosso principal indicador: Market Strength Radar.:  https://www.mql5.com/pt/market/product/114568?source=Site +Profile+Seller Ele imprime um gráfico de linhas que deve ser comparado com o gráfico de preço para entendermos o sentimento do mercado. As divergencias são pontos importantes de inflexão. As convergências mostram força da tendência atual. 
FREE
Versione MT4: https://www.mql5.com/en/market/product/157433 Versione MT5: https://www.mql5.com/en/market/product/167286 Volume Imbalance è uno strumento di visualizzazione leggero con Profilo Volume + Squilibrio Delta, progettato per aiutarti a individuare zone di prezzo ad alta attività, pressione direzionale e aree di prezzo "vuote" all'interno di un intervallo di retrospettiva configurabile. A differenza del classico profilo volume che mostra solo il volume totale, questo indicatore suddiv
MVProfile
Patrick Omar Sanduyogan
Market Volume Profile Indicator Built on Auction Market Theory , this indicator shows where price is accepted (high volume) and rejected (low volume). It helps you identify: POC / Value Areas → where price returns (fair value) LVN (Low Volume Nodes) → where price moves fast LVNs are most effective when located near the edges of VAH/VAL Strategy 1: Trend Model (Momentum Setup) When to use: Trending market (not balanced) Strong moves Higher highs / lower lows Breakout continuation How it works:
Fixed Volume Profile
Carlos Pascual Perez Maturano
This indicator, titled "Fixed Volume Profile.mq5", is a custom tool for MetaTrader 5 (MQL5) designed to calculate and display a Volume Profile over a user-defined fixed time range. The Volume Profile shows the distribution of trading volume at different price levels during a specific period, helping to identify areas of high activity (such as Points of Control or POCs) and volume-based support/resistance areas. Main Functionality: Interactive Range: The indicator creates two vertical lines on
FREE
PriceDensity
Andriy Sydoruk
PriceDensity – Professional Price Density Indicator for Accurate Market Level Detection PriceDensity   is a smart, non-volume-based indicator that analyzes historical price action to determine   key price levels with the highest frequency of occurrence . It automatically detects where the market has spent the most time – revealing hidden areas of support and resistance based on actual market behavior, not subjective drawing. This tool is ideal for traders using price action, support/resistance c
Versione MT4: https://www.mql5.com/en/market/product/166784 Versione MT5: https://www.mql5.com/en/market/product/166785 PROFILO DI LIQUIDITÀ IL PROFILO DI LIQUIDITÀ è uno strumento visivo per la struttura del mercato che mappa le potenziali zone di liquidità sul grafico utilizzando un profilo dinamico in stile heatmap. Questo indicatore analizza l'andamento storico dei prezzi e il volume dei tick, evidenziando quindi le aree di prezzo in cui è probabile che la liquidità sia concentrata. Trac
Presentazione di Koala Supply Demand Benvenuto nell’indicatore Koala Supply Demand. Questo indicatore è progettato per identificare   zone di supply e demand non rotte   su differenti timeframe. Questo indicatore aiuta i trader a visualizzare il mercato come aree di zone. È possibile vedere come il prezzo rispetta alcune zone molto forti. L’indicatore può inoltre mostrare segnali di price action quando si formano all’interno delle zone. Fai trading automaticamente con Supply Demand Robot — EA av
FREE
Weis Waves è un indicatore tecnico sviluppato da David Weis, ispirato ai principi di Richard Wyckoff. A differenza del volume tradizionale, mostrato barra per barra, Weis Waves accumula il volume in “onde” rialziste o ribassiste, ricominciando il conteggio ogni volta che il prezzo cambia direzione. Questo metodo consente al trader di vedere chiaramente la vera forza del movimento di mercato, poiché ogni onda riflette l’intensità del volume che sostiene la sequenza di candele. Caratteristiche
FREE
Delta Profile Volume
Teresinha Moraes Correia
Technical Description of the Indicator – Delta Profile for MetaTrader 5 The Delta Profile is an indicator developed for MetaTrader 5 focused on detailed analysis of volume flow within a defined range of candles. It organizes and displays information about the imbalance of positive volumes (associated with upward movements) and negative volumes (associated with downward movements) at different price levels. The result is a clear view of the chart points where the highest concentration of trades o
First and foremost, the Insight Flow Indicator stands out as a Non-Repainting, Non-Redrawing, and Non-Lagging tool. This makes it a prime choice for both manual and algorithmic trading, ensuring reliable and consistent signals. User Manual: Settings, Inputs, and Strategy The Insight Flow Indicator leverages price action, strength, and momentum to provide a clear edge in the market. Equipped with advanced filters, it eliminates noise and false signals, enhancing trading potential. By using multip
DualSARScalper - Dual Parabolic SAR Konvergenz-Indikator DualSARScalper identifiziert hochwahrscheinliche Einstiegspunkte, indem er den exakten Moment erkennt, wenn ein schneller Parabolic SAR auf den langsamen Parabolic SAR trifft und beide auf dem gleichen Preisniveau liegen. FUNKTIONSWEISE Der Indikator berechnet zwei Parabolic SARs gleichzeitig: • Schneller SAR (Standard: Step 0.02, Max 0.2) – reagiert schnell auf Preisänderungen • Langsamer SAR (Standard: Step 0.003, Max 0.2) – gibt die
Do you use volume in your reading of the market? Certainly many traders use it, and do not imagine operating without it. The Color Histogram Volume Set indicator allows the user to choose the value that he considers interesting to monitor. When you pass this you will have visual confirmation and if you want you will also have the audible alert that is given by the indicator. Of course, there are other ways to try to find a high volume, such as assessing whether the volume is above av
VMS Oscillator
Vincent Jose Proenca
Volume & Move Strength (VMS) Indicator for MT5 The VMS Indicator displays the relationship between trading volume and price movement strength, helping traders assess how well market activity supports price action. How It Works: Measures tick volume as trading activity. Calculates move strength using a normalized True Range (%). Both values can be smoothed (default: 5) and optionally normalized (0–100) for consistency across markets. Plots two lines in a separate window: Blue (Volume) – trading a
FREE
The Effort and Result indicator is based on the work of Karthik Marar; a volume spread analysis trader. It compares a price change (Result) to the volume size (Effort) for a certain period.  By comparing the effort and result, we can get more information about the future price movement. Both values are normalized and converted to a scale of 0 - 100 % based on a selectable look-back period. This indicator is also known as the Effort Index. The law of effort and result The law of effort vs. res
Gli utenti di questo prodotto hanno anche acquistato
SuperScalp Pro
Van Minh Nguyen
4.63 (24)
SuperScalp Pro – Sistema avanzato di indicatore scalping multi-filtro SuperScalp Pro è un indicatore di scalping avanzato che combina il classico Supertrend con molteplici filtri intelligenti di conferma per aiutare a identificare opportunità di trading. Funziona in modo efficiente su diversi timeframe da M1 a H4, con prestazioni ottimizzate su XAUUSD, BTCUSD e principali coppie Forex. L’indicatore fornisce chiari segnali Buy e Sell, insieme a livelli di ingresso, stop loss e take profit calcola
Divergence Bomber
Ihor Otkydach
4.9 (89)
Ogni acquirente dell’indicatore riceverà inoltre gratuitamente: L’utilità esclusiva “Bomber Utility”, che gestisce automaticamente ogni operazione, imposta i livelli di Stop Loss e Take Profit e chiude le posizioni secondo le regole della strategia I file di configurazione (set file) per adattare l’indicatore a diversi asset I set file per configurare il Bomber Utility in tre modalità: “Rischio Minimo”, “Rischio Bilanciato” e “Strategia di Attesa” Una guida video passo-passo per installare, conf
SignalTech MT5 is an unique fully rule based trading system for EURUSD, USDCHF, USDJPY, AUDUSD, NZDUSD, EURJPY, AUDJPY, NZDJPY, CADJPY.  All the winning trades with chart setups are published on the comments page. 2026-05 3493 Pips (Until 05-21 NY Closed) 2026-04 2243 Pips 2026-03 2165 Pips 2026-02 2937 Pips 2026-01 2624 Pips 2025-12 1174 Pips It can generate signals with Buy/Sell Arrows and Pop-Up/Sound Alerts. Each signal has clear Entry and Stop Loss levels, which should be automatically flag
Entry In The Zone and SMC Multi Timeframe is a real-time 2-in-1 market analysis tool that combines market structure analysis and a No Repaint BUY / SELL signal system into a single indicator, built on Smart Money Concepts (SMC) — a widely adopted framework used by professional traders to understand market structure. This indicator helps you see the market more clearly, make decisions based on structure rather than guesswork, and focus on high-probability zones where price is more likely to react
Azimuth Pro
Ottaviano De Cicco
5 (7)
Azimuth Pro V2: Synthetic Fractal Structure and Confirmed Entries for MT5 Overview Azimuth Pro is a multi-level swing structure indicator by Merkava Labs . Four nested swing layers, swing-anchored VWAP, ABC pattern detection, three-timeframe structural filtering, and closed-bar confirmed entries — one chart, one workflow from micro-swings to macro-cycles. This is not a blind signal product. It is a structure-first workflow for traders who care about location, context, and timing. V2 Launch Offe
Cominciamo con la verità. Nessun indicatore da solo ti renderà profittevole. Se qualcuno ti dice il contrario, ti sta vendendo un sogno. Qualsiasi indicatore che mostra frecce perfette di acquisto/vendita può essere reso impeccabile — basta ingrandire la giusta sezione della storia e catturare solo i trade vincenti. Noi non lo facciamo.  SMC Intraday Formula è uno strumento. Legge la struttura del mercato per te, identifica le zone a più alta probabilità e ti mostra esattamente come appare la t
Power Candles MT5
Daniel Stein
5 (8)
Power Candles V3 - Indicatore di forza ad ottimizzazione automatica Power Candles V3 trasforma la forza delle valute e degli strumenti in un piano di trading attuabile su ogni grafico a cui è collegato. Invece di limitarsi a colorare le candele, esegue un'auto-ottimizzazione in tempo reale in background e ti fornisce i migliori valori di Stop Loss, Take Profit e soglia di segnale per il simbolo che hai davanti. Basta un clic per adottarlo nel trading live: i raggi di ingresso, Stop Loss e Take P
INDICATORE TREND CATCHER L'indicatore Trend Catcher analizza i movimenti dei prezzi di mercato, utilizzando una combinazione di indicatori di analisi del trend proprietari dell'autore e personalizzati. Identifica la vera direzione del mercato filtrando il rumore a breve termine e concentrandosi sulla forza del momentum sottostante, sull'espansione della volatilità e sul comportamento della struttura dei prezzi. Utilizza inoltre una combinazione di indicatori personalizzati di smoothing e filtr
Se acquisti questo indicatore, riceverai il mio Trade Manager Professionale + EA  GRATUITAMENTE. Innanzitutto è importante sottolineare che questo sistema di trading è un indicatore Non-Repainting, Non-Redrawing e Non-Lagging, il che lo rende ideale sia per il trading manuale che per quello automatico. Corso online, manuale e download di preset. Il "Sistema di Trading Smart Trend MT5" è una soluzione completa pensata sia per i trader principianti che per quelli esperti. Combina oltre 10 indicat
Gann Made Easy è un sistema di trading Forex professionale e facile da usare che si basa sui migliori principi del trading utilizzando la teoria di mr. WD Gann. L'indicatore fornisce segnali ACQUISTA e VENDI accurati, inclusi i livelli di Stop Loss e Take Profit. Puoi fare trading anche in movimento utilizzando le notifiche PUSH. CONTATTAMI DOPO L'ACQUISTO PER RICEVERE GRATUITAMENTE LE ISTRUZIONI DI TRADING E OTTIMI INDICATORI EXTRA! Probabilmente hai già sentito parlare molte volte dei metodi d
FX Trend MT5 NG
Daniel Stein
5 (6)
FX Trend NG: La Nuova Generazione di Intelligenza di Trend Multi-Mercato Panoramica FX Trend NG è uno strumento professionale di analisi del trend multi-timeframe e monitoraggio dei mercati. Ti consente di comprendere la struttura completa del mercato in pochi secondi. Invece di passare tra numerosi grafici, puoi identificare immediatamente quali strumenti sono in trend, dove il momentum sta diminuendo e dove esiste un forte allineamento tra i timeframe. Offerta di Lancio – Ottieni FX Trend NG
ARIPoint
Temirlan Kdyrkhan
1 (1)
ARIPoint is a powerful trading companion designed to generate high-probability entry signals with dynamic TP/SL/DP levels based on volatility. Built-in performance tracking shows win/loss stats, PP1/PP2 hits, and success rates all updated live. Key Features: Buy/Sell signals with adaptive volatility bands Real-time TP/SL/DP levels based on ATR Built-in MA Filter with optional ATR/StdDev volatility Performance stats panel (Success, Profit/Loss, PP1/PP2) Alerts via popup, sound, push, or email Cu
Innanzitutto, vale la pena sottolineare che questo Strumento di Trading è un Indicatore Non-Ridipingente, Non-Ridisegnante e Non-Laggante, il che lo rende ideale per il trading professionale. Corso online, manuale utente e demo. L'Indicatore Smart Price Action Concepts è uno strumento molto potente sia per i nuovi che per i trader esperti. Racchiude più di 20 utili indicatori in uno solo, combinando idee di trading avanzate come l'Analisi del Trader del Circolo Interno e le Strategie di Tradin
Trend Screener Pro MT5
STE S.S.COMPANY
4.85 (104)
Indicatore di tendenza, soluzione unica rivoluzionaria per il trading di tendenze e il filtraggio con tutte le importanti funzionalità di tendenza integrate in un unico strumento! È un indicatore multi-timeframe e multi-valuta al 100% non ridipingibile che può essere utilizzato su tutti i simboli/strumenti: forex, materie prime, criptovalute, indici e azioni. Trend Screener è un indicatore di tendenza che segue un indicatore efficiente che fornisce segnali di tendenza a freccia con punti nel gra
KT Alpha Hunter Arrows MT5
KEENBASE SOFTWARE SOLUTIONS
La maggior parte degli indicatori a frecce ti dà un segnale e poi ti lascia capire da solo tutto il resto. KT Alpha Hunter Arrows ti offre un piano di trading completo. Ogni freccia di segnale appare con un piano completo già disegnato: linea di ingresso, stop loss, quattro livelli di take profit e un verdetto live sull’edge, che ti indica se quel simbolo e quel timeframe meritano davvero di essere tradati in quel momento. Il Trade Manager EA incluso gestisce l’esecuzione dopo il tuo ingresso, c
Market Structure Order Block Dashboard MT5 è un indicatore MT5 progettato per i trader che vogliono leggere la struttura di mercato e le principali zone di reazione del prezzo direttamente sul grafico. Combina BOS, ChoCH, Order Blocks, Fair Value Gaps (FVG), Liquidità, Kill Zones, Volume Profile e un pannello compatto per un'analisi rapida. Questo indicatore è rivolto ai trader che utilizzano la struttura di mercato, i concetti ICT e Smart Money come quadro decisionale. Può aiutare a individuare
Presentazione       Quantum Breakout PRO   , l'innovativo indicatore MQL5 che sta trasformando il modo in cui scambi le zone di breakout! Sviluppato da un team di trader esperti con un'esperienza di trading di oltre 13 anni,       Quantum Breakout PRO       è progettato per spingere il tuo viaggio di trading a nuovi livelli con la sua strategia innovativa e dinamica della zona di breakout. Quantum Breakout Indicator ti fornirà frecce di segnalazione sulle zone di breakout con 5 zone target di
Gem SIGNAL
Shengzu Zhong
5 (1)
GEM Signal Pro GEM Signal Pro è un indicatore trend-following per MetaTrader 5, progettato per i trader che desiderano segnali più chiari, configurazioni operative più strutturate e una gestione del rischio più pratica direttamente sul grafico. Invece di mostrare solo una semplice freccia, GEM Signal Pro aiuta a presentare l’intera idea di trading in modo più chiaro e leggibile. Quando le condizioni sono confermate, l’indicatore può mostrare sul grafico il prezzo di ingresso, lo stop loss e gli
FX Power MT5 NG
Daniel Stein
5 (32)
FX Power: Analizza la Forza delle Valute per Decisioni di Trading Più Intelligenti Panoramica FX Power è lo strumento essenziale per comprendere la reale forza delle principali valute e dell'oro in qualsiasi condizione di mercato. Identificando le valute forti da comprare e quelle deboli da vendere, FX Power semplifica le decisioni di trading e rivela opportunità ad alta probabilità. Che tu segua le tendenze o anticipi inversioni utilizzando valori estremi di Delta, questo strumento si adatta
Btmm state engine pro
Garry James Goodchild
5 (4)
BTMM State Engine Pro is a MetaTrader 5 indicator for traders who use the Beat The Market Maker approach: Asian session context, kill zone timing, level progression, peak formation detection, and a multi-pair scanner from a single chart. It combines cycle state logic with a built-in scanner dashboard so you do not need the same tool on many charts at once. What it does Draws the Asian session range; session times can follow broker server offset or be set in inputs. Tracks level progression (L
OrderFlux | Footprint Orderflow per MetaTrader 5 Versione 2.0 – Visualizzazione Bid/Ask in tempo reale per Trader Attivi OrderFlux è un indicatore di footprint e orderflow per MT5. Non mostra solo dove si è mosso il prezzo, ma cosa succede all'interno del movimento: volume Bid/Ask per livello di prezzo, delta, imbalance e distribuzione del volume. Molti grafici ti mostrano solo il risultato finale di una candela. OrderFlux ti mostra il percorso per arrivarci. Questo è esattamente ciò che aiuta q
FX Levels MT5
Daniel Stein
5 (14)
FX Levels: Supporti e Resistenze di Precisione Eccezionale per Tutti i Mercati Panoramica Rapida Cercate un modo affidabile per individuare livelli di supporto e resistenza in ogni mercato—coppie di valute, indici, azioni o materie prime? FX Levels fonde il metodo tradizionale “Lighthouse” con un approccio dinamico all’avanguardia, offrendo una precisione quasi universale. Basato sulla nostra esperienza reale con i broker e su aggiornamenti automatici giornalieri più quelli in tempo reale, FX
Quantum TrendPulse
Bogdan Ion Puscasu
5 (25)
Ecco   Quantum TrendPulse   , lo strumento di trading definitivo che combina la potenza di   SuperTrend   ,   RSI   e   Stocastico   in un unico indicatore completo per massimizzare il tuo potenziale di trading. Progettato per i trader che cercano precisione ed efficienza, questo indicatore ti aiuta a identificare con sicurezza le tendenze di mercato, i cambiamenti di momentum e i punti di entrata e uscita ottimali. Caratteristiche principali: Integrazione SuperTrend:   segui facilmente l'andame
Atomic Analyst MT5
Issam Kassas
3.94 (31)
Innanzitutto, vale la pena sottolineare che questo indicatore di trading non è repaint, non è ridisegno e non presenta ritardi, il che lo rende ideale sia per il trading manuale che per quello automatico. Manuale utente: impostazioni, input e strategia. L'Analista Atomico è un indicatore di azione del prezzo PA che utilizza la forza e il momentum del prezzo per trovare un miglior vantaggio sul mercato. Dotato di filtri avanzati che aiutano a rimuovere rumori e segnali falsi, e aumentare il pote
RelicusRoad Pro MT5
Relicus LLC
4.96 (24)
RelicusRoad Pro: Sistema Operativo Quantitativo di Mercato 70% DI SCONTO ACCESSO A VITA (TEMPO LIMITATO) - UNISCITI A 2.000+ TRADER Perché la maggior parte dei trader fallisce anche con indicatori "perfetti"? Perché operano su Singoli Concetti isolati. Un segnale senza contesto è una scommessa. Per vincere serve CONFLUENZA . RelicusRoad Pro non è un semplice indicatore. È un Ecosistema Quantitativo completo . Mappa la "Fair Value Road", distinguendo tra rumore e rotture strutturali. Smetti di in
Trend Forecaster
Alexey Minkov
5 (7)
Trend Forecaster – Since 2023. The Trend Forecaster indicator utilizes a unique proprietary algorithm to determine entry points for a breakout trading strategy. The indicator identifies price clusters, analyzes price movement near levels, and provides a signal when the price breaks through a level. The Trend Forecaster indicator is suitable for all financial assets, including currencies (Forex), metals, stocks, indices, and cryptocurrencies. You can also adjust the indicator to work on any time
Meridian Pro
Ottaviano De Cicco
5 (2)
Meridian Pro 2.00: Professional Multi-Timeframe Trend Matrix for MT5 Meridian Pro 2.00 is a professional adaptive trend matrix for MetaTrader 5. It combines the original Meridian trend engine, a clean chart ribbon, closed-bar signal arrows, an 8-timeframe dashboard, Fuel momentum, weighted consensus, synthetic HTF processing and chart-native higher-timeframe context lines. The goal is simple: read current trend, multi-timeframe structure, strength, momentum and EA-ready state from one discipline
Reversal Master for MT5 Reversal Master for MT5 is a non‑repainting reversal indicator for MetaTrader 5. It helps you detect potential market reversal points and shows the maximum favourable price movement after each historical signal, so you can better understand how price behaved after similar situations in the past. The MT5 version keeps the familiar reversal‑signal logic of the original Reversal Master for MT4, but adds improved visualisation, historical statistics and a points summary panel
Questo cruscotto mostra gli ultimi   pattern armonici   disponibili per i simboli selezionati, in modo da risparmiare tempo ed essere più efficienti /   versione MT4 . Indicatore gratuito:   Basic Harmonic Pattern Colonne dell'indicatore Symbol :   vengono visualizzati i simboli selezionati Trend:   rialzista o ribassista Pattern:   tipo di pattern (gartley, butterfly, bat, crab, shark, cypher o ABCD) Entry:   prezzo di ingresso SL:   prezzo di stop loss TP1:   1 prezzo di take profit TP2:
Smart Structure Concepts MT5
Cristhian Alexander Gaibor Cuasquer
Smart Structure Concepts MT5 è il toolkit SMC istituzionale più completo per MetaTrader 5 — con tooltip educativi in 4 lingue e avvisi push in tempo reale nel momento in cui il prezzo entra in una zona. La maggior parte degli indicatori SMC disegna scatole e ti lascia indovinare. Questo spiega ogni segnale direttamente sul grafico. Passa il cursore su qualsiasi BOS, CHoCH, Order Block, FVG o livello di liquidità e vedi cosa significa e cosa fare dopo — in inglese, spagnolo, portoghese o france
Altri dall’autore
Buy/Sell Volume Indicator with Pair Divergence for MT5  version "1.1" Description The Enhanced Buy/Sell Volume Indicator is a custom technical indicator designed for MetaTrader 5 (MT5) to analyze and visualize buy and sell tick volumes in a separate window. It provides traders with insights into market dynamics by highlighting volume dominance, balance, and divergence patterns. The indicator uses tick volume data to estimate buying and selling pressure, offering a detailed view of market sentime
MFI Multi-Scanner Indicator for MT5  The MFI Multi-Scanner Indicator is designed for automatic scanning of multiple currency pairs and timeframes to detect overbought and oversold signals using the Money Flow Index (MFI). It displays MFI values, signal arrows, and an interactive on-chart table. Ideal for traders who want to see the full market picture without constantly switching between windows. Watch on YouTube: https://youtu.be/uUtBaXLTGuU Currency Pairs and Timeframes Symbols : List of c
Filtro:
Nessuna recensione
Rispondi alla recensione