Best Trend Change Zone MT5
- Indicatori
- Versione: 1.0
- Attivazioni: 5

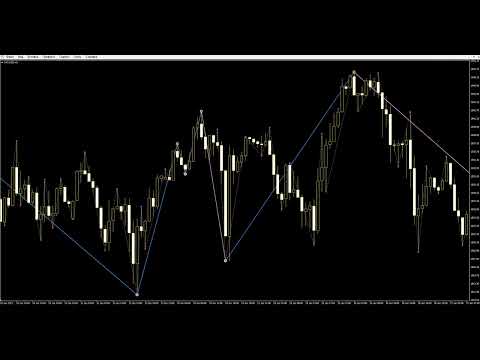
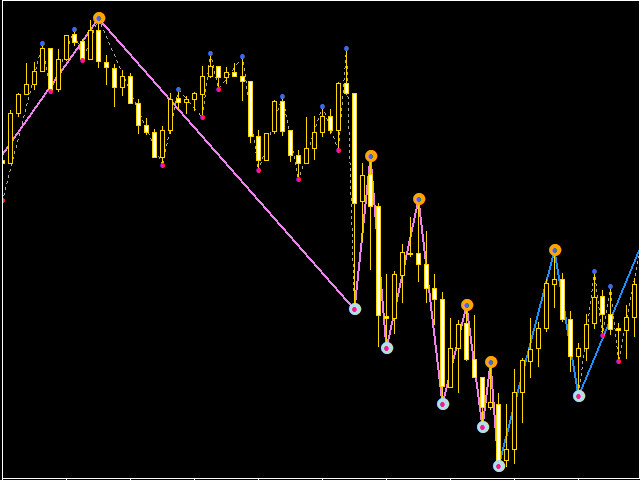
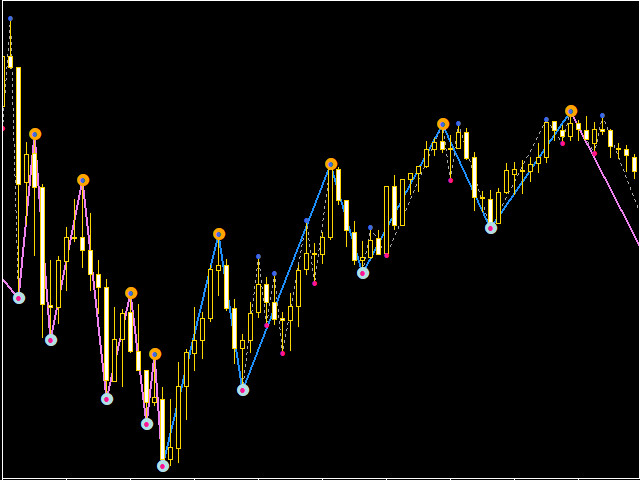
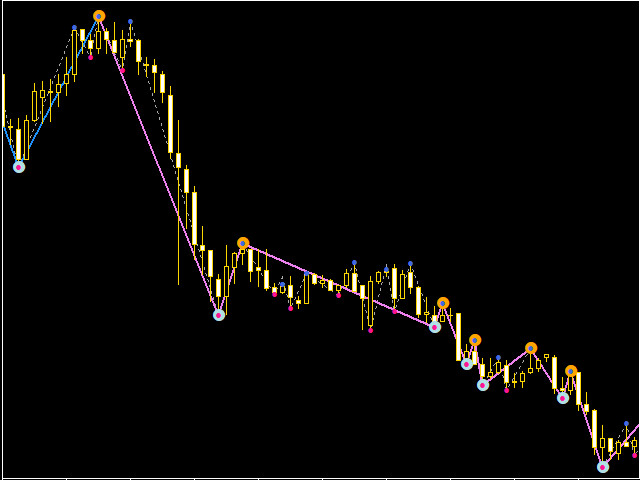
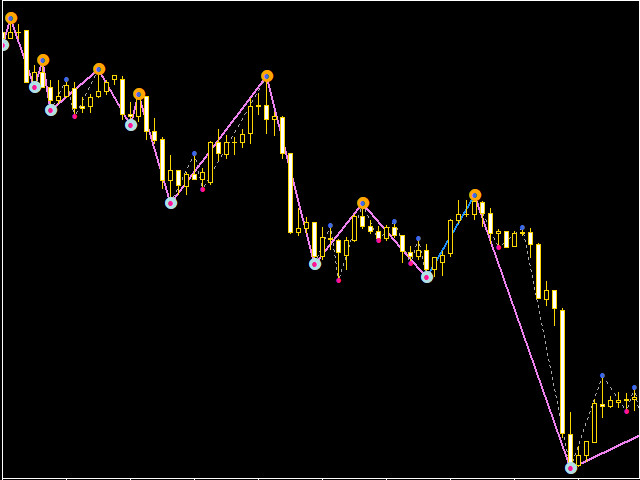
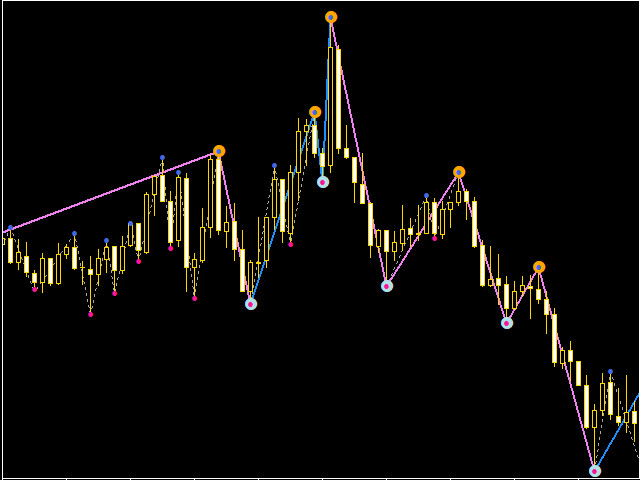
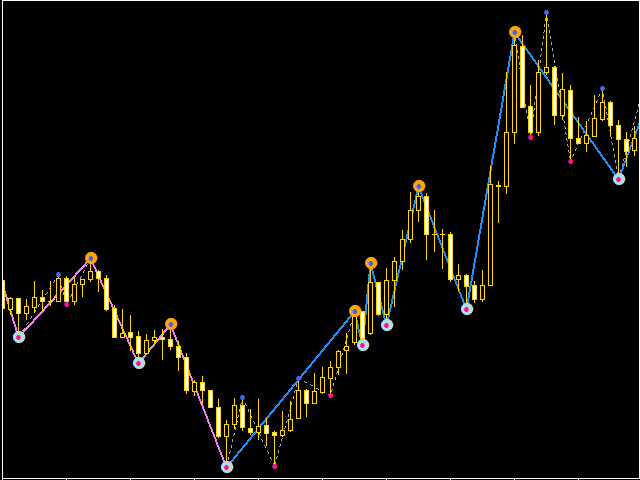
The TrendChangeZone indicator displays global and local price highs and lows on the chart. The indicator also shows the global trend on the chart and corrective waves. This indicator is designed to determine the direction and change the trend. Most importantly, the indicator shows trend continuation or reversal zones. An indispensable assistant in trading. The indicator does not redraw. The indicator can work on all trading instruments.
Important !!!
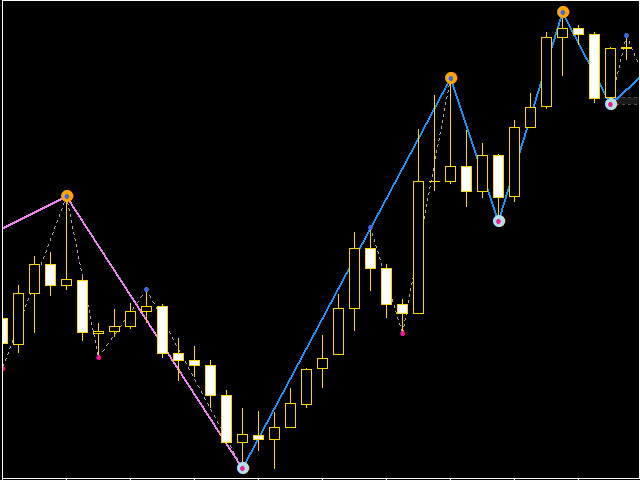
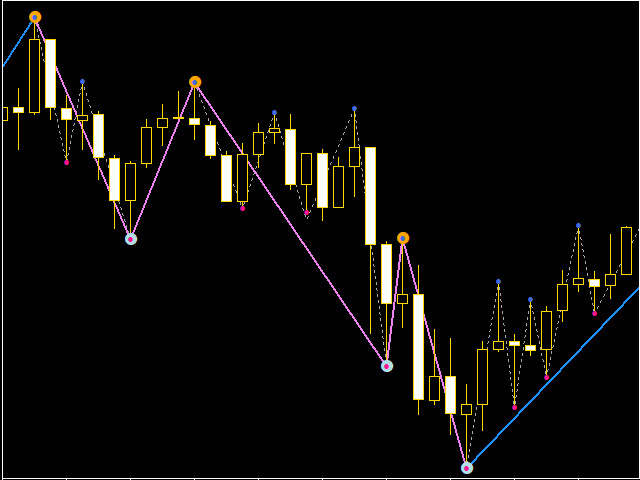
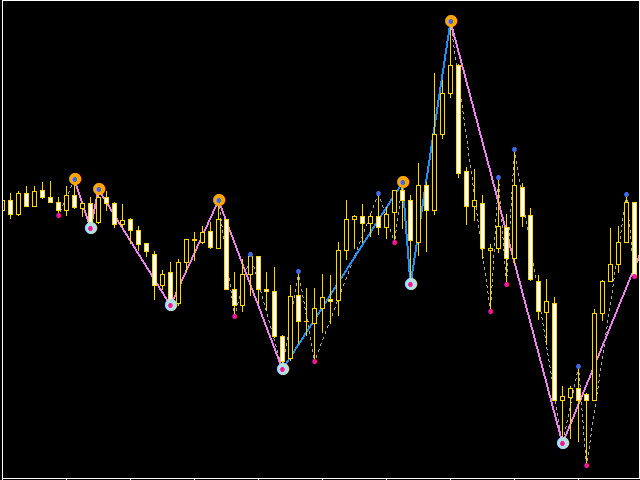
Top trend if 2 (two) or more blue segments in a row.
The trend is lower if there are 2 (two) or more red segments in a row.
If the color of the segments alternates, then the trend is predominantly the one that was before the alternation. If, for example, the trend was lower (there were 2 or more red segments in a row) and the first blue segment appeared, this indicates that the trend can change to an upper one, but still remains lower.
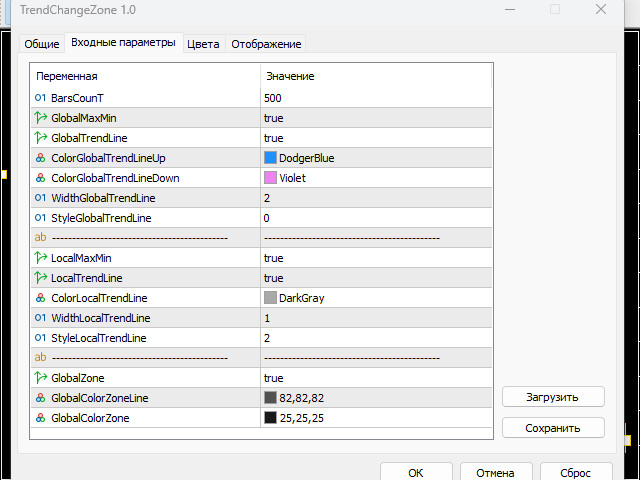
Input parameters of the indicator:
BarsCount - number of bars to draw
GlobalMaxMin - enables/disables drawing global lows and highs
GlobalTrendLine - enable/disable trend drawing
ColorGlobalTrenLineUp - line color when an uptrend is formed
ColorGlobalTrendLineDown - line color when a downtrend is formed
WidthGlobalTrendLine - thickness of the trend line
StyleGlobalTrendLine - trend line style
--------------------------------------------------------------------------------------------------
LocalMaxMin – enables/disables drawing corrective local lows and highs
LocalTrendLine – enables/disables drawing a line of corrective waves
ColorLocalTrendLine - color of the corrective wave line
WidthGlobalTrendLine - thickness of the corrective wave line
StyleGlobalTrendLine – line style of corrective waves
--------------------------------------------------------------------------------------------------
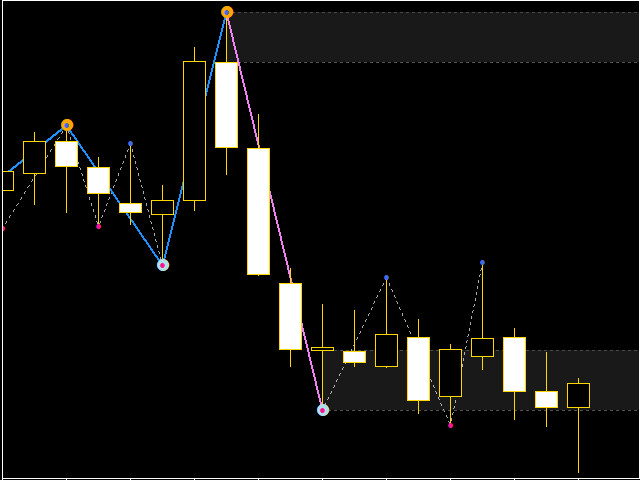
GlobalZone – enable/disable the trend continuation or reversal zone
GlobalColorZoneLine - border color of the trend continuation or reversal zone
GlobalColorZone - color of trend continuation or reversal zone
On the Colors tab, you can set the color of local and global highs and lows