Amazing Harmonic Pattern Mt5
- Indicatori
-
Davoud Moghaddam
 I am a professional MQL5 developer and software engineer with over 5 years of hands-on experience in the Forex market. My main expertise lies in designing, developing, and optimizing Expert Advisors (EAs), custom indicators, and automated trading tools based on various trading strategies.
 - Versione: 1.1
- Aggiornato: 21 dicembre 2023
- Attivazioni: 20
- This is the Full Version, to get the free version please contact me.
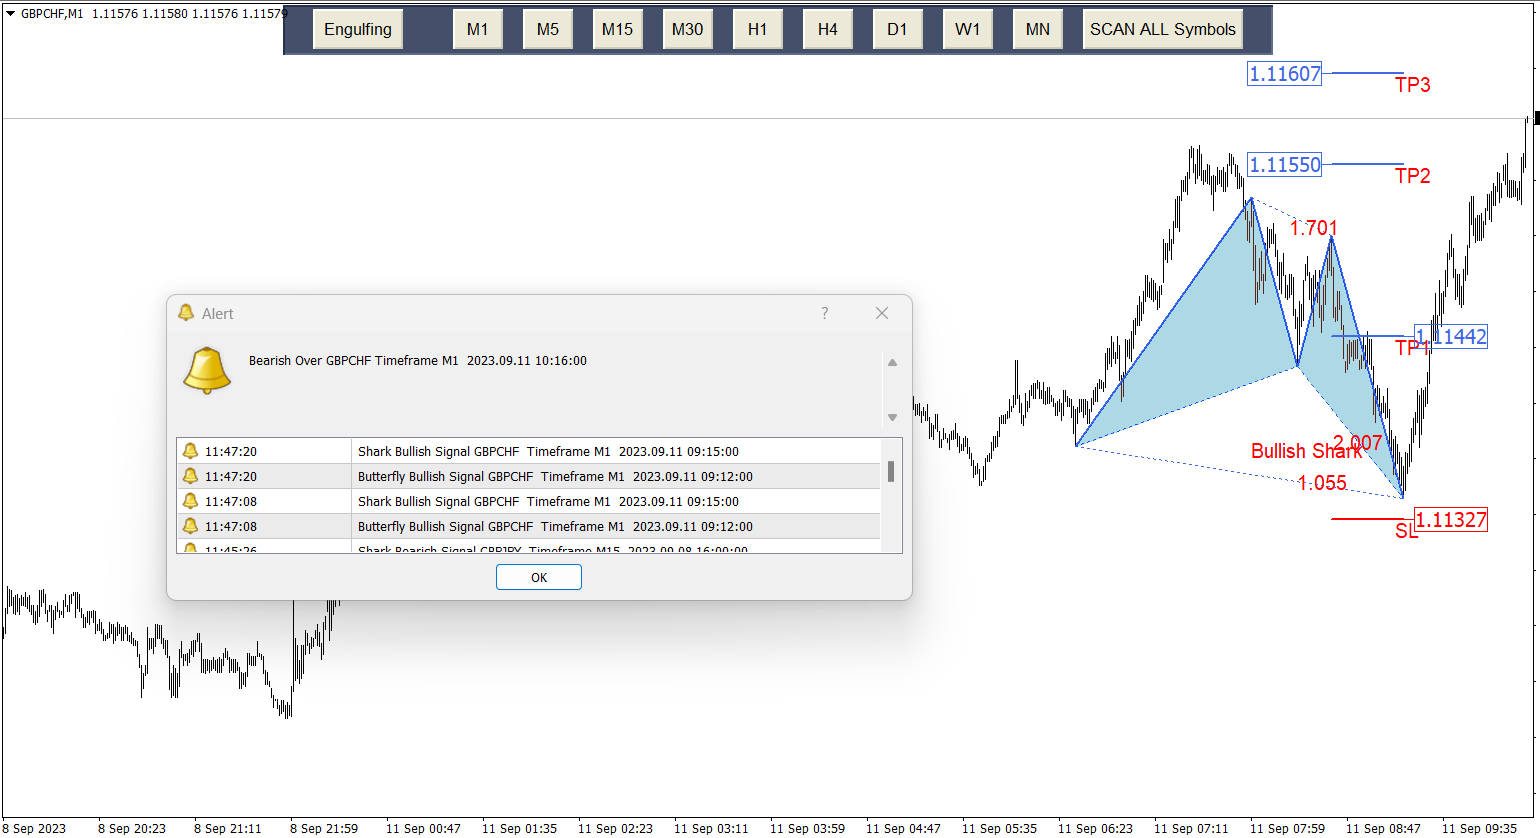
- The free version works on “GBPCHF” charts.
- All symbols and time frames scanner.
Harmonic Pattern
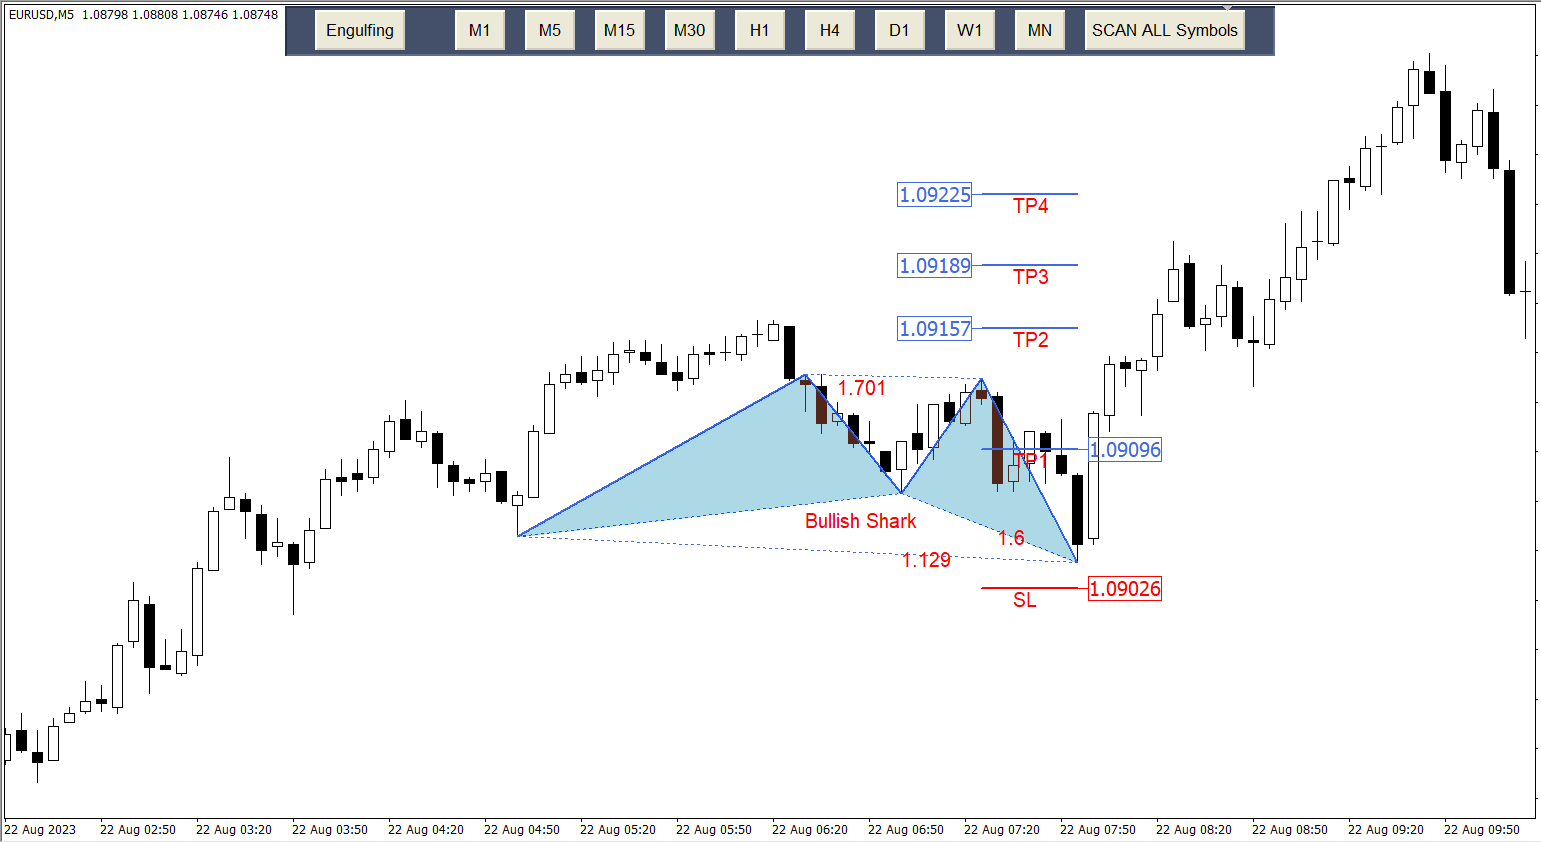
Harmonic patterns are used in technical analysis that traders use to find trend reversals. They are considered one of the most accurate technical analysis tools, as they allow traders to predict the future price movement direction and the potential trend targets. Also, unlike many other technical tools, the number of false signals generated by harmonic patterns is less. This is because harmonic patterns must develop in the correct proportions in addition to certain geometric features. Harmonic and graphic patterns can overlap each other to form composite harmonic patterns. They work for all types of markets and time frames.
By way of application, harmonic patterns are similar to classic chart patterns and Price Action patterns. This means harmonic patterns can be used in any strategy suggesting employment price chart patterns. Harmonic patterns are well combined with indicator analysis, so traders can look at the market from different angles.
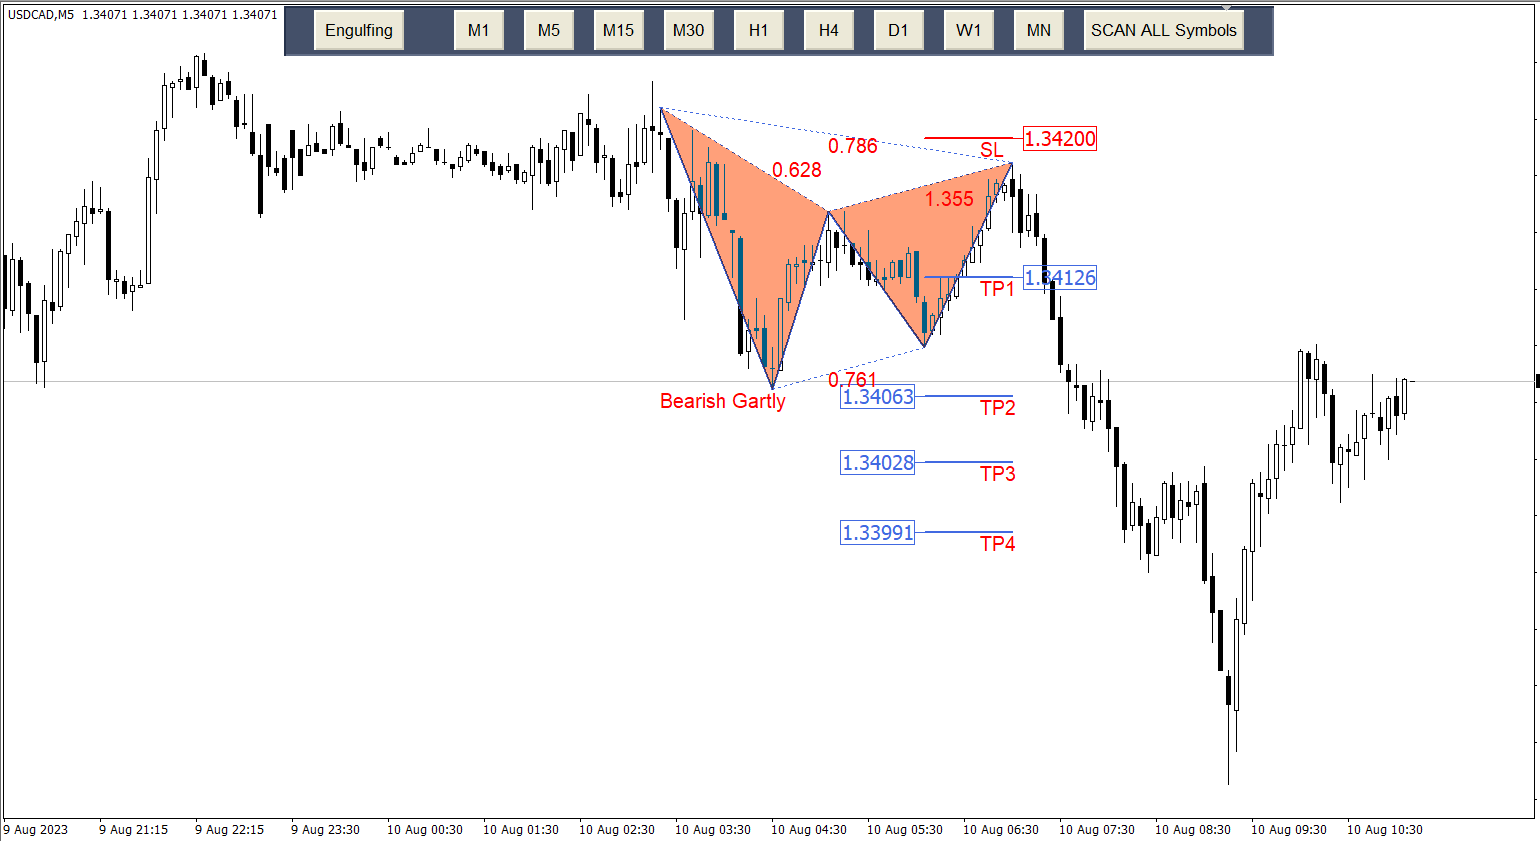
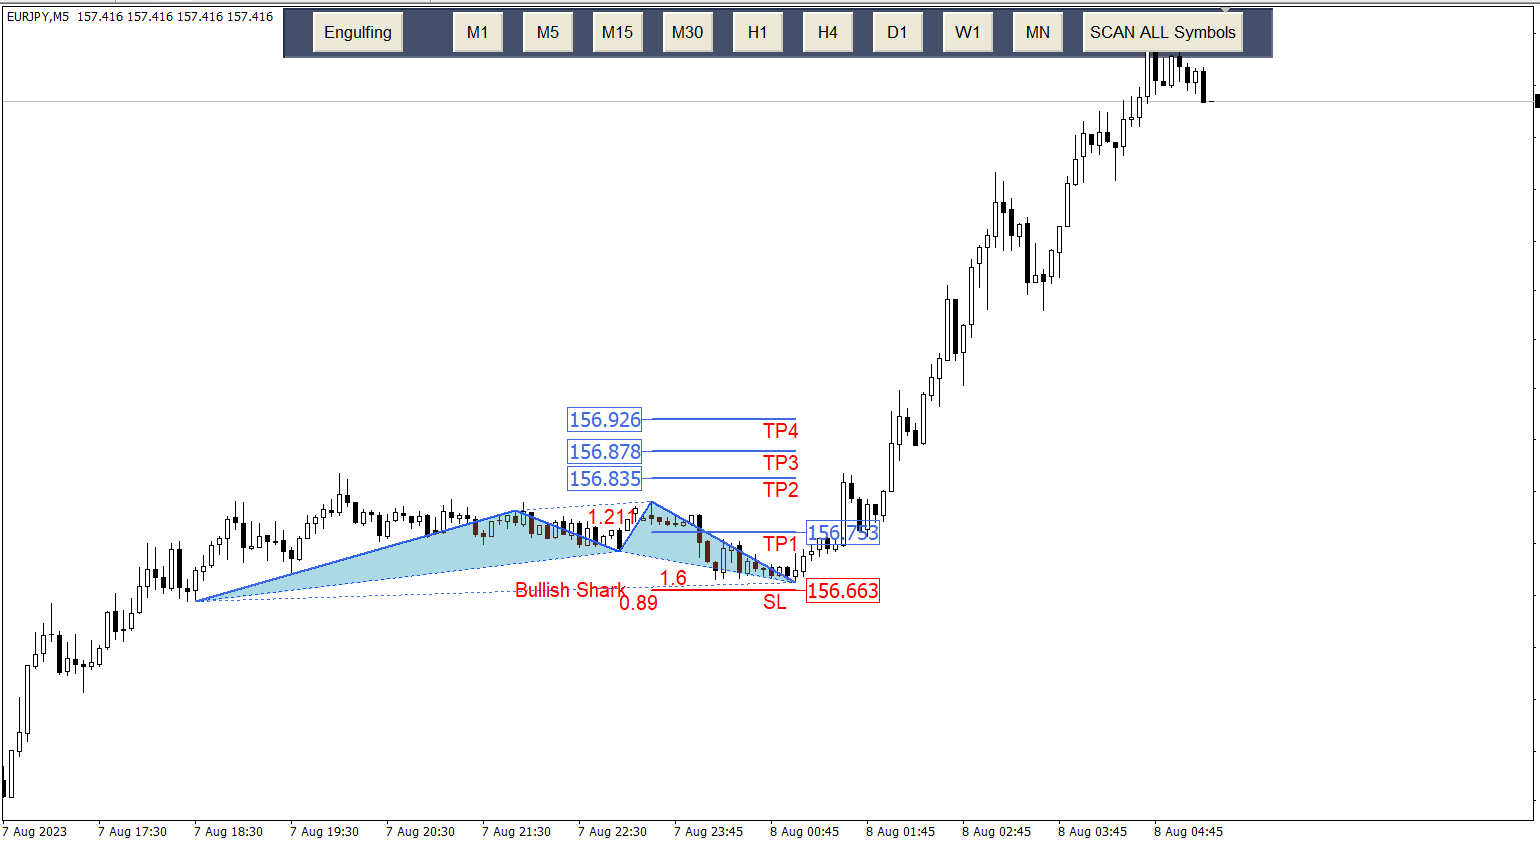
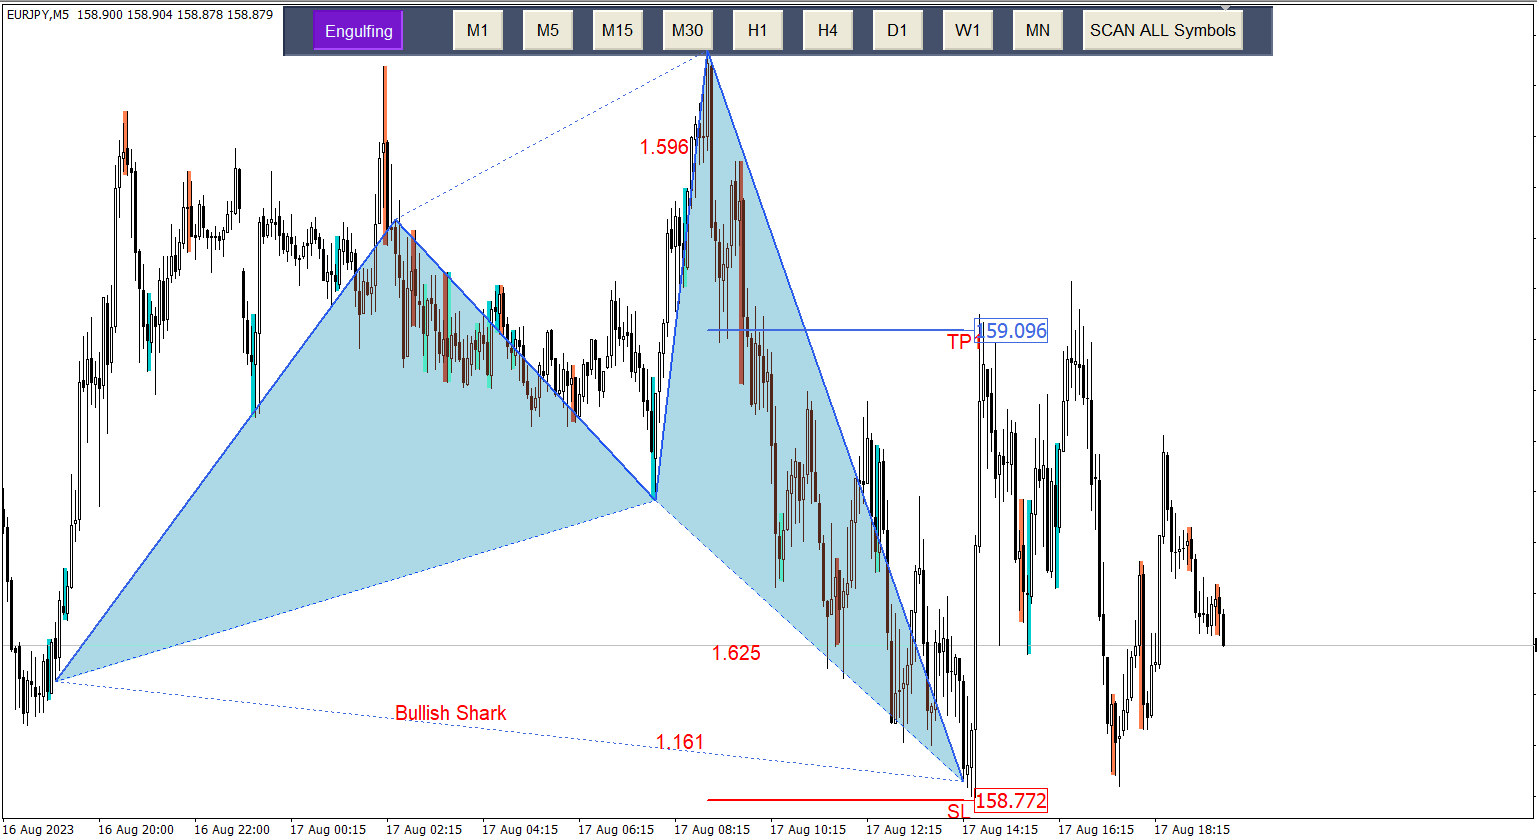
In this indicator you can scan the following patterns.
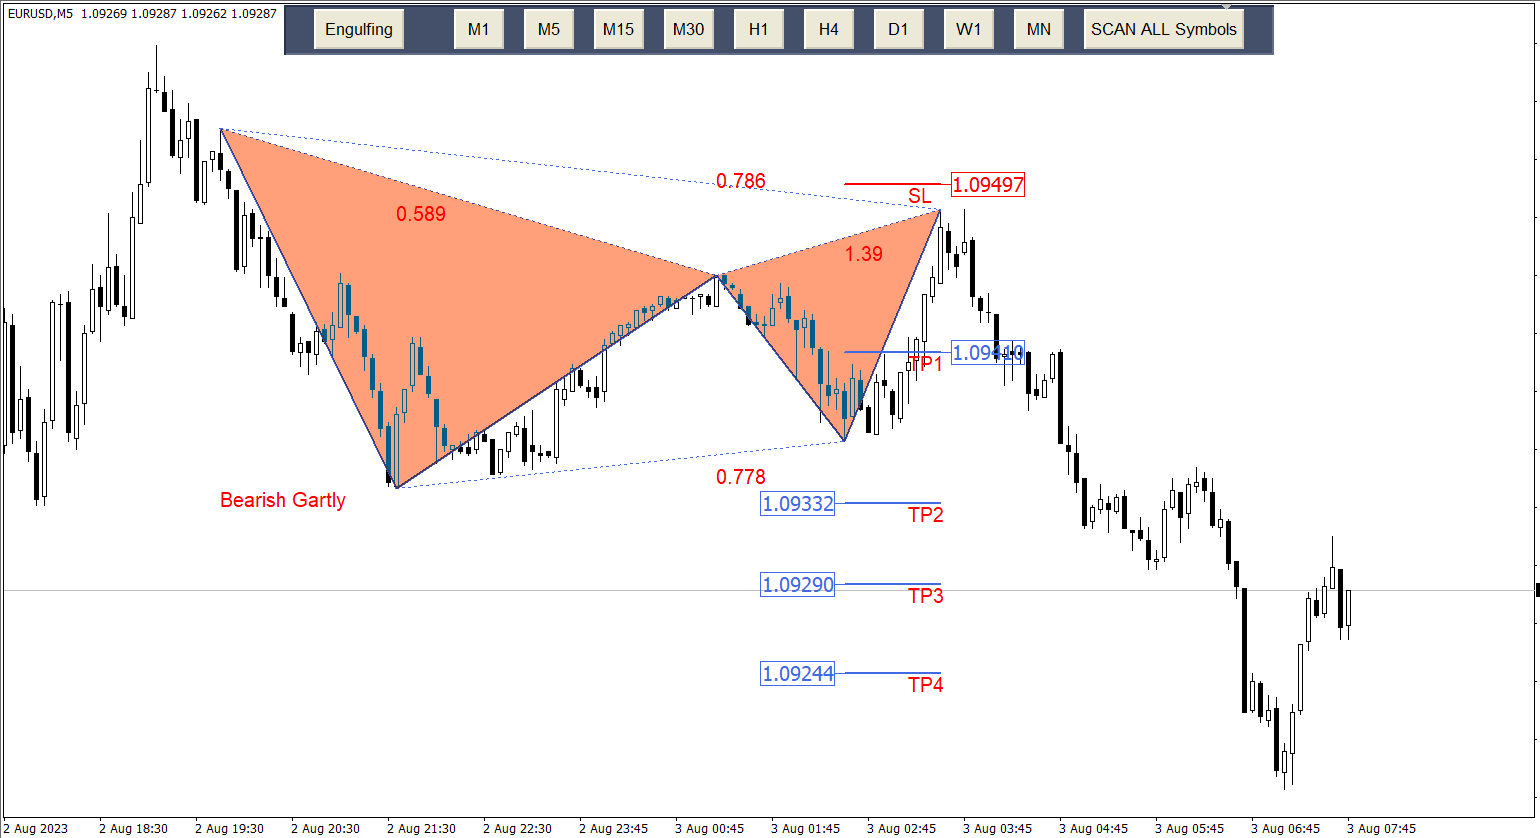
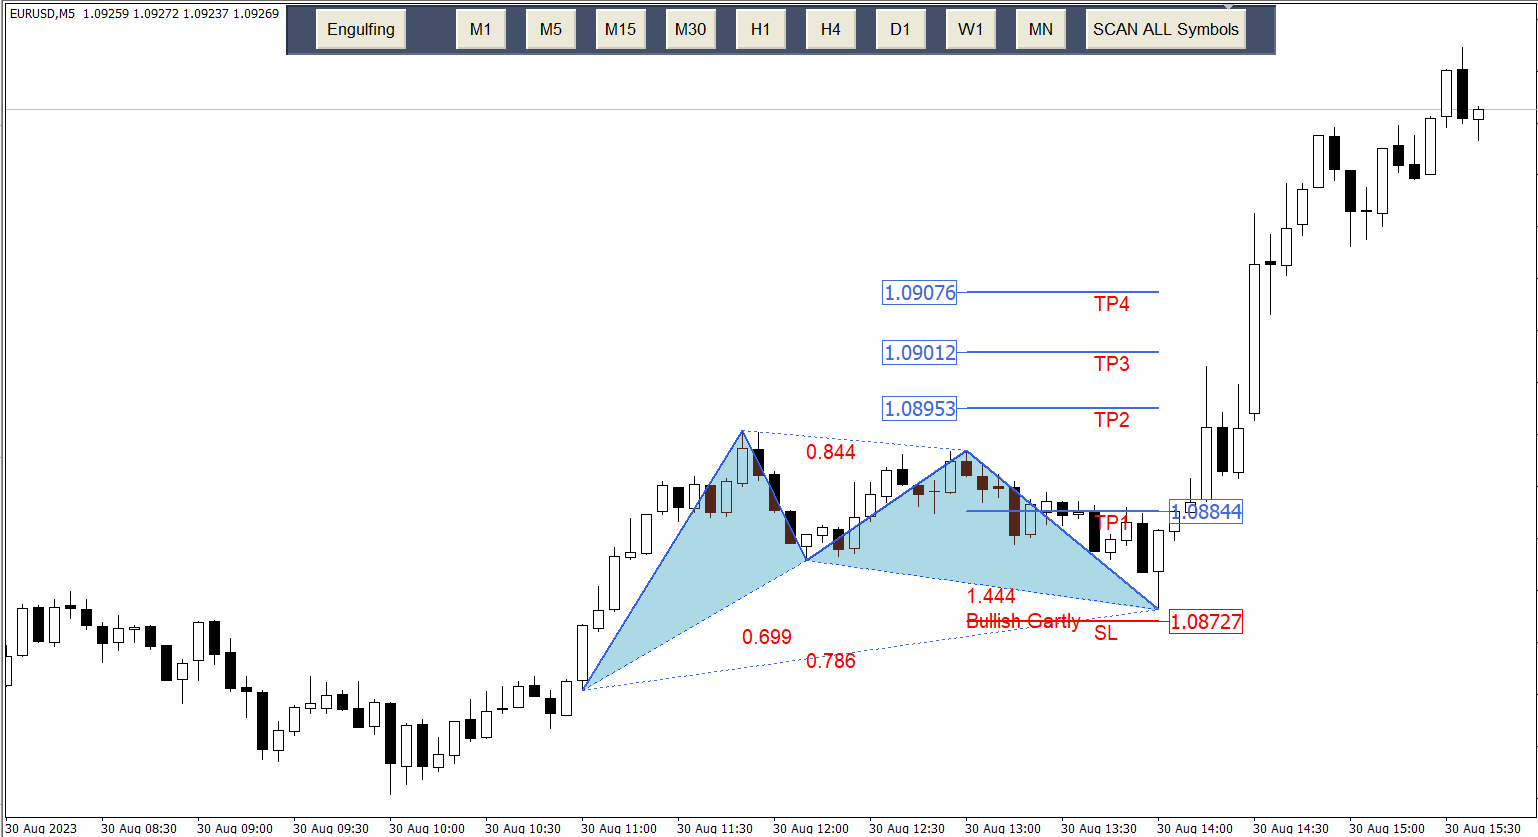
- Gartley
- Butterfly
- Crab
- Bat
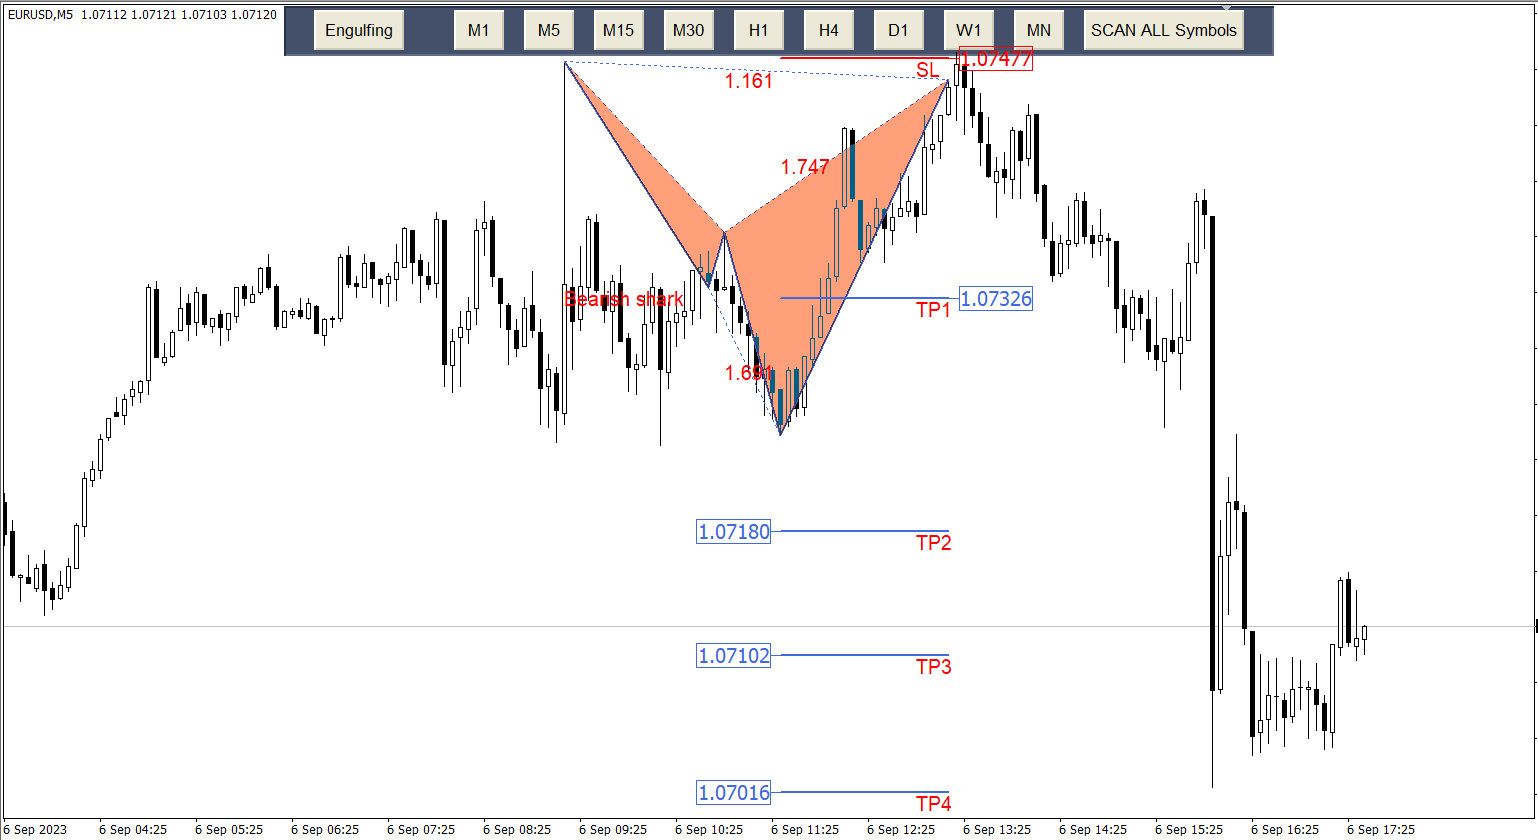
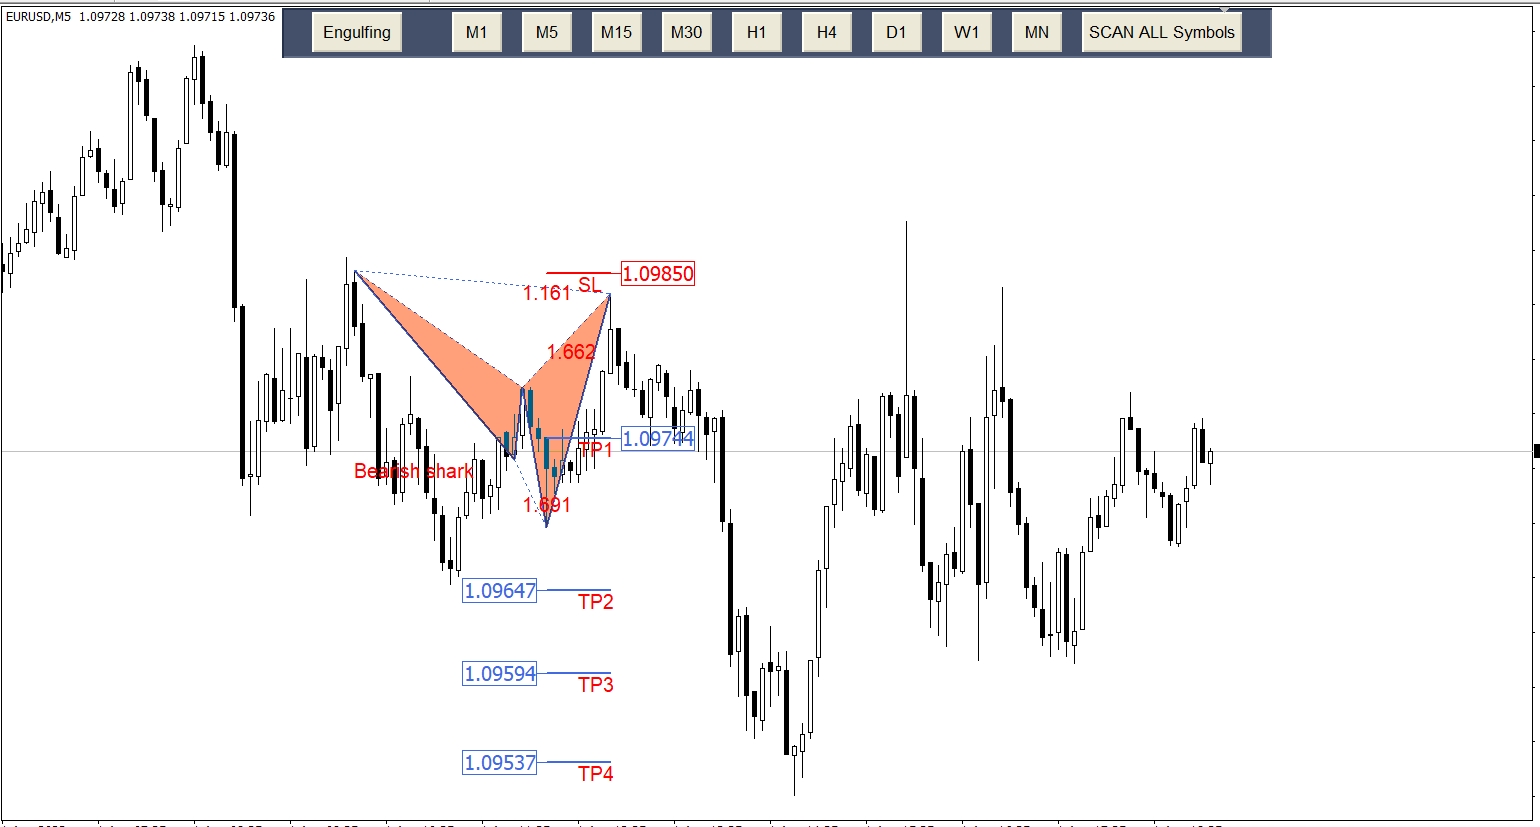
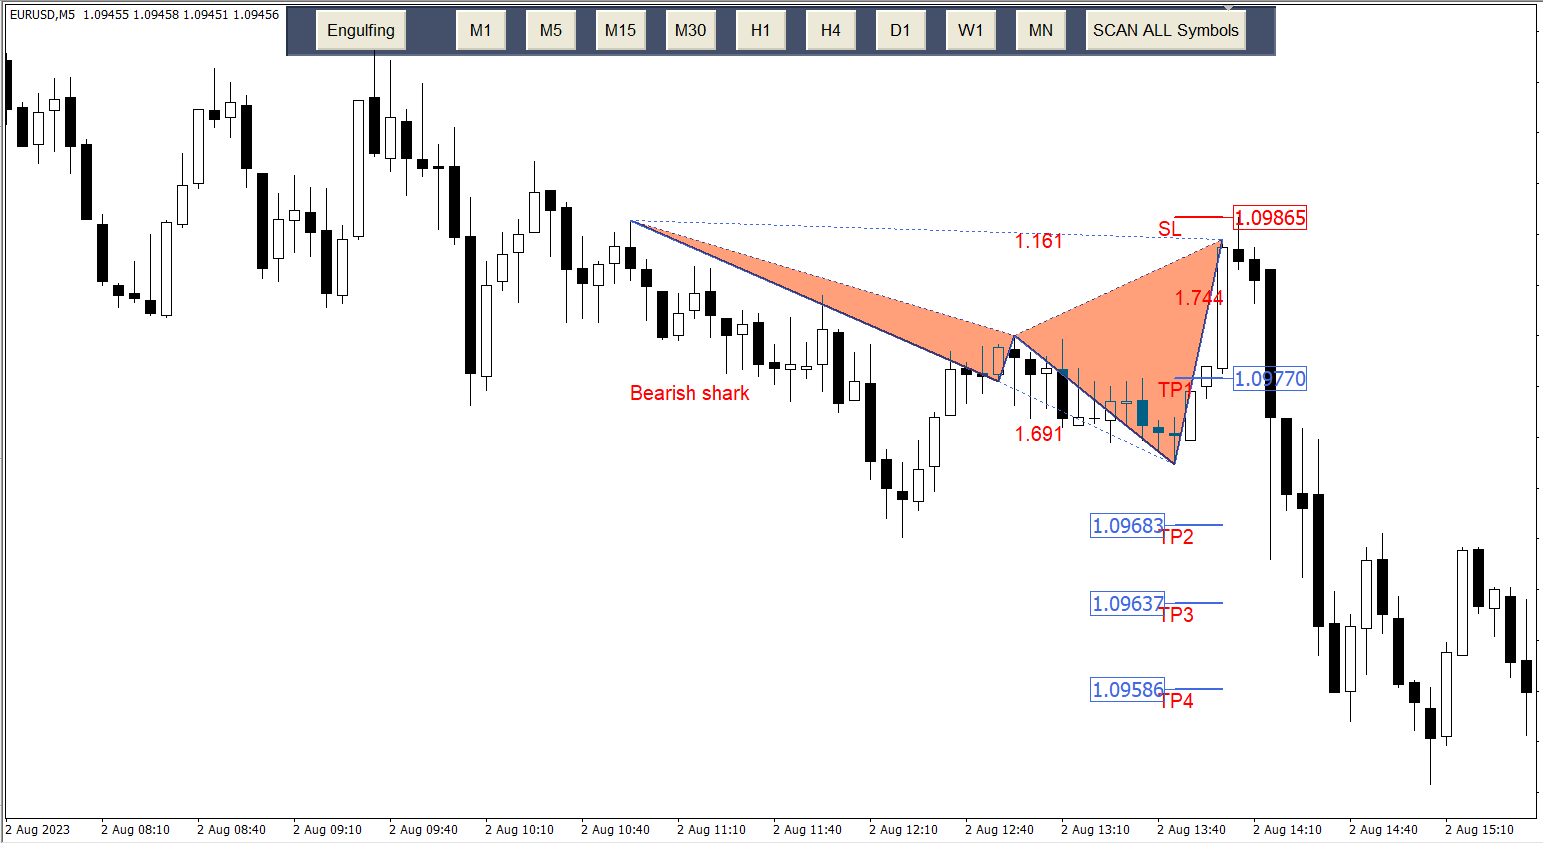
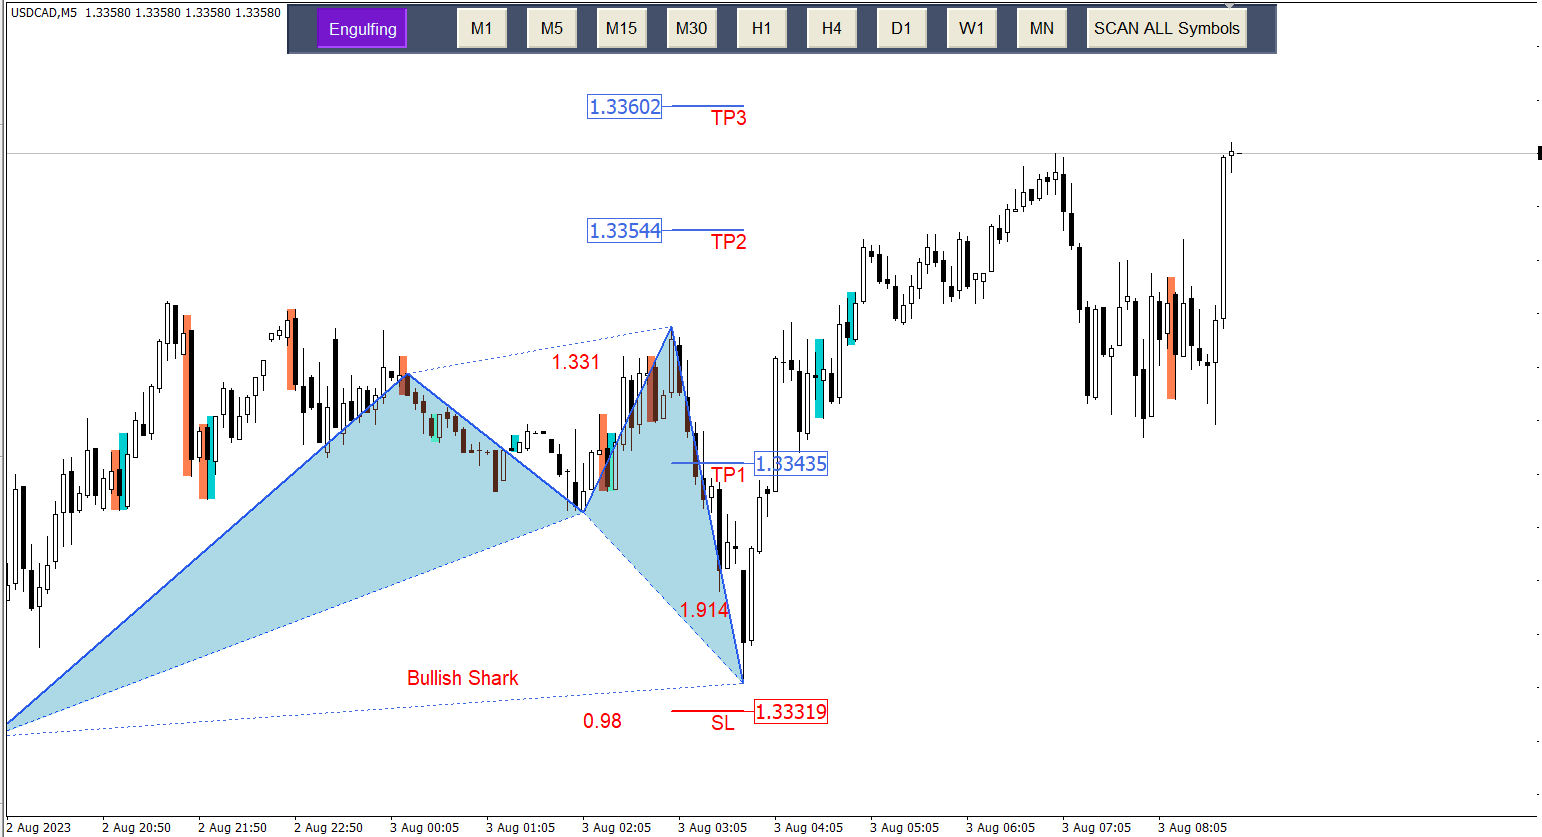
- Shark
- Cypher
Main Features |
Input Parameters |
Display / Style Option
- Changing the color of the bullish and bearish Harmonic Pattern,TP and SL
- Changing line thickness
Alert Settings
- Display Alert, Enable or disable Alert
- Display Notification, Enable or disable Notification
- Send Email, Enable or disable Email