ATR Info Display
- Indicatori
- Versione: 1.0
- Attivazioni: 5
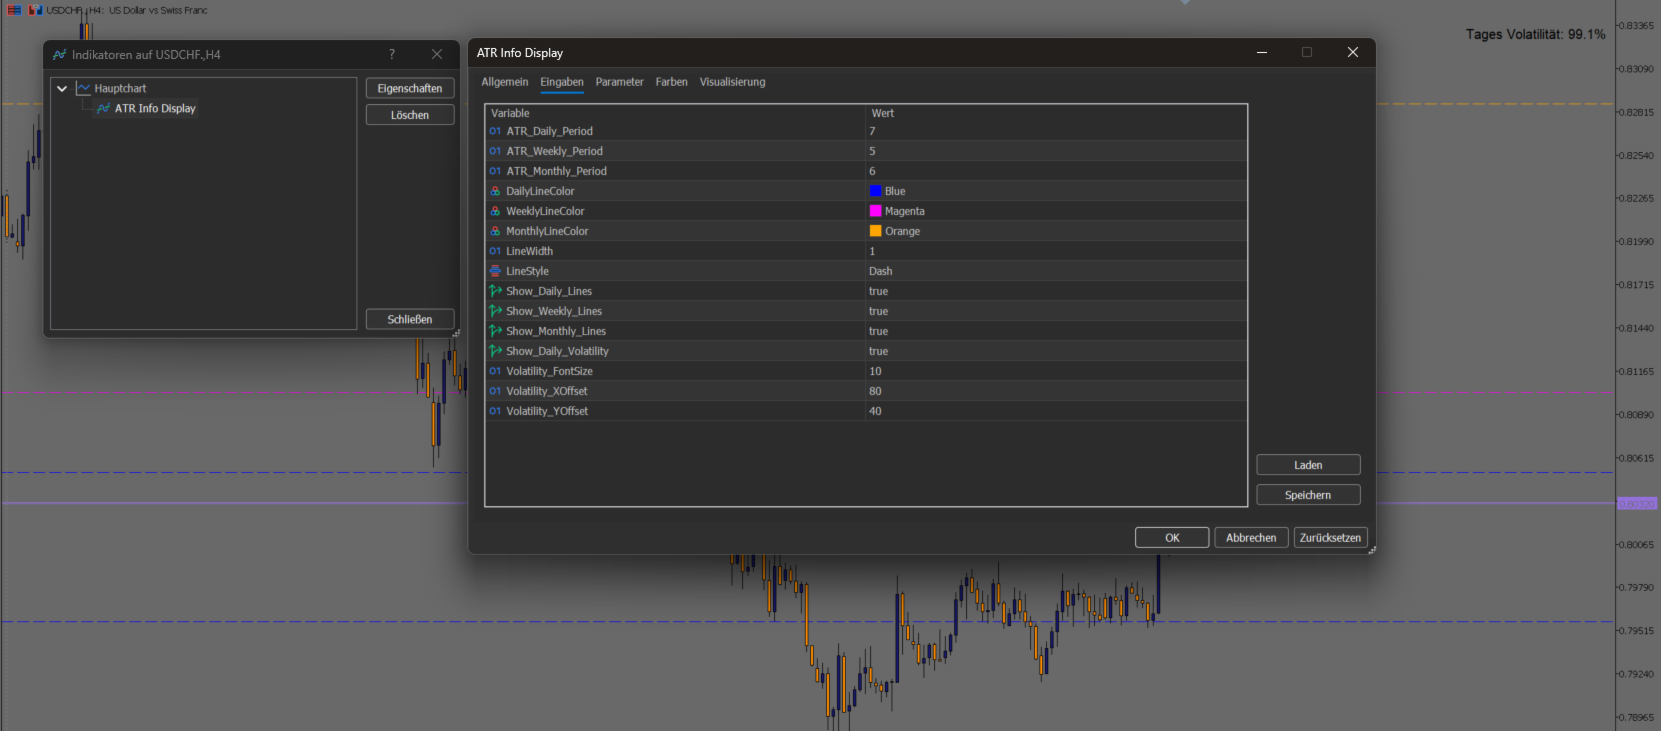
The ATR Info Display is a visual indicator that automatically calculates the Average True Range (ATR) on multiple timeframes and displays it directly on the chart.
It provides key market volatility information at a glance:
📌 Features:
-
Daily, Weekly, and Monthly ATR lines:
Upper and lower bounds are shown as horizontal lines based on the open price of each period.
Colors, line styles, and visibility are customizable.
The daily ATR provides a good estimate of how far the market is expected to move today.
The weekly ATR is especially useful for swing traders to gauge expected price movement over several days. -
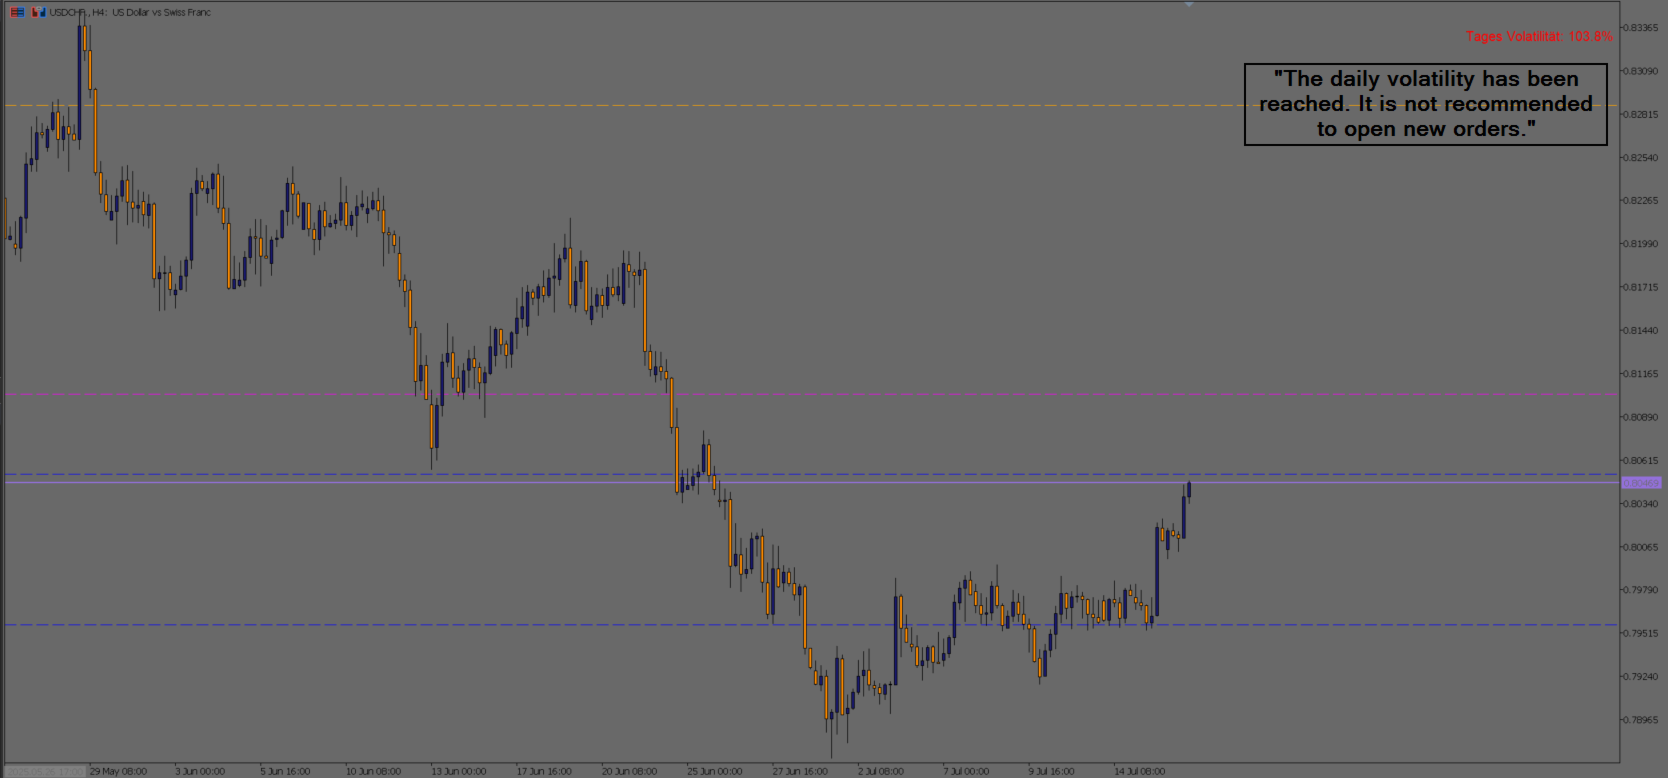
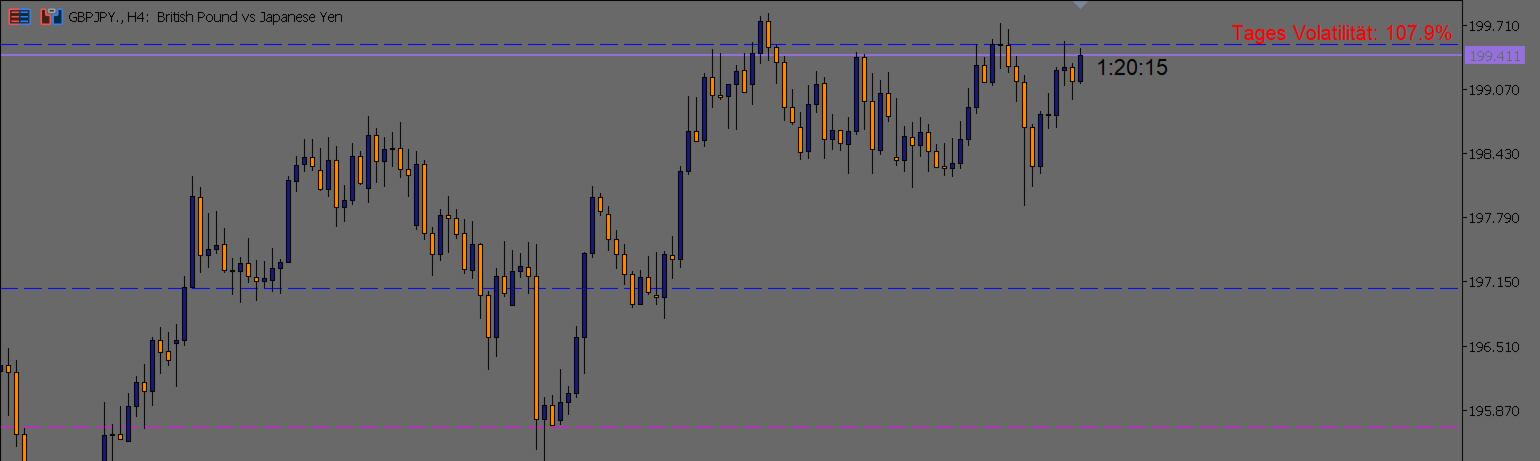
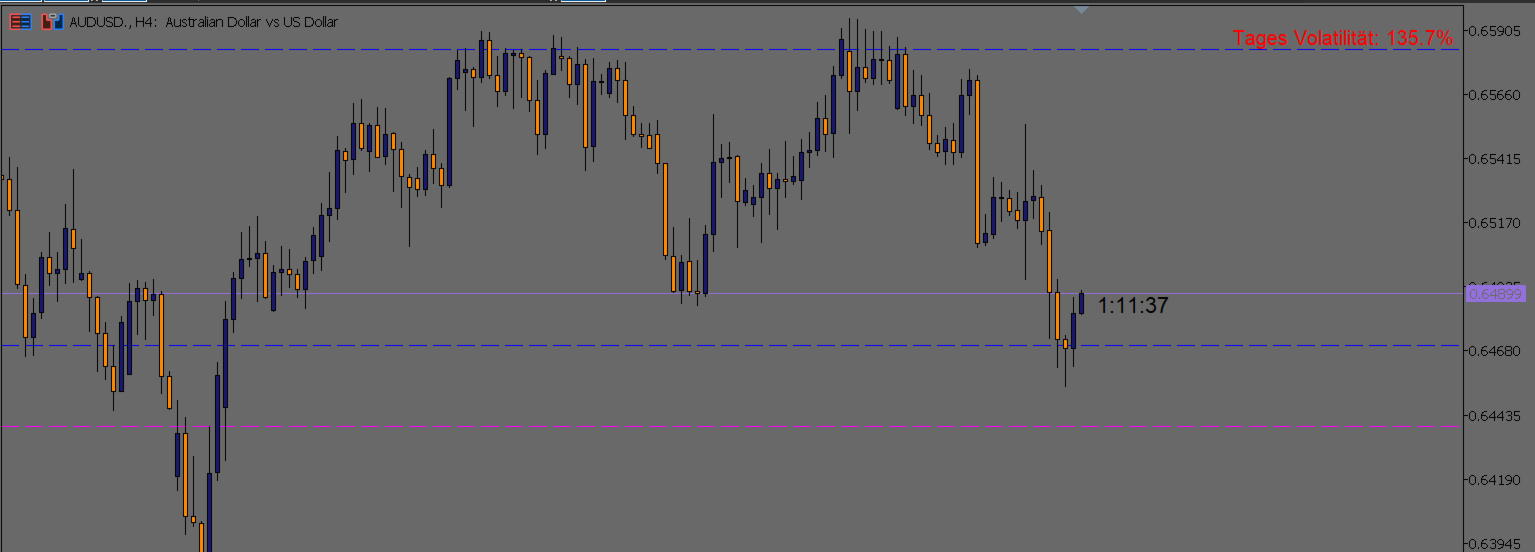
Daily Volatility Percentage (top right of the chart):
This display shows how much the market has moved today compared to its typical daily volatility.-
Color Highlighting:
-
Black: Volatility below 100% — the market typically has room to move.
-
Red: Volatility 100% or above — the expected daily volatility is exhausted or exceeded.
-
-
Meaning for Traders:
If volatility is above 100%, it indicates the market has already made its typical daily move.
In such cases, it is advisable to be cautious about opening new orders, as market momentum may be exhausted and a reversal or sideways movement is likely.
This helps avoid overtrading during volatile phases and manage risk better.
-
-
Adjustable display settings:
Font size and position of the volatility display can be customized (X/Y offsets).
⚙️ Use case:
This indicator is ideal for traders who want to quickly visualize market volatility — suitable for breakout strategies, range trading, or risk assessment.