AnyProfile MT4
- Indicatori
-
Evgeny Shevtsov
 Indicators for volume trading :
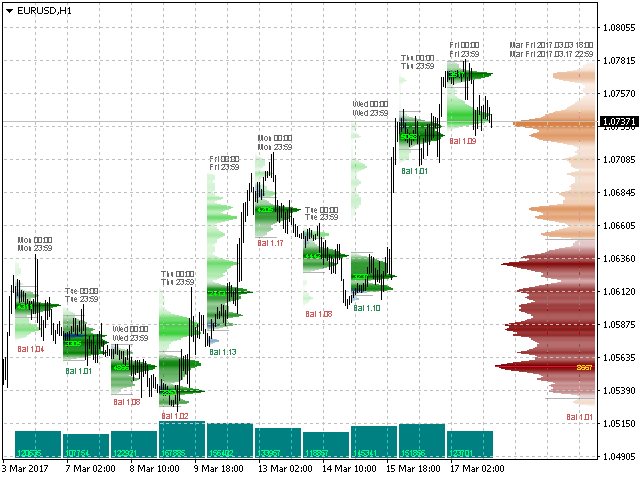
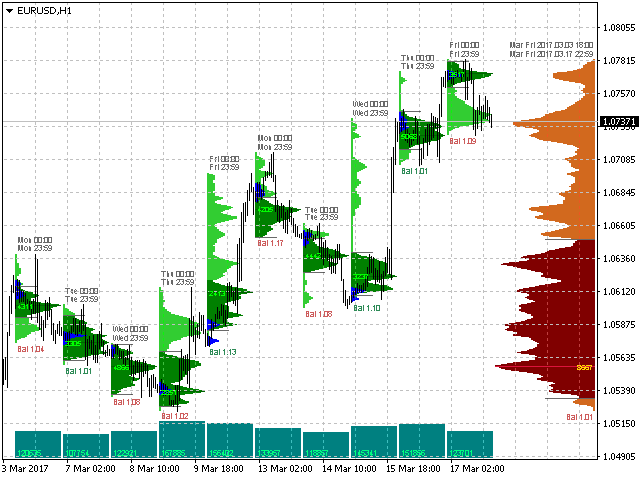
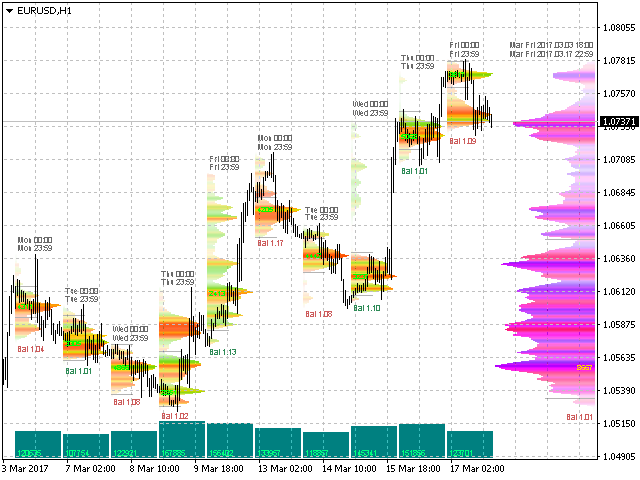
Volume profile,
Classic profile,
Clusters chart,
Demand and supply levels,
Demand and supply diagram,
Cumulative delta.
Indicators for probabilistic analysis :
Monte Carlo predictor,
Neural predictor. - Versione: 4.6
- Aggiornato: 30 aprile 2026
- Attivazioni: 10
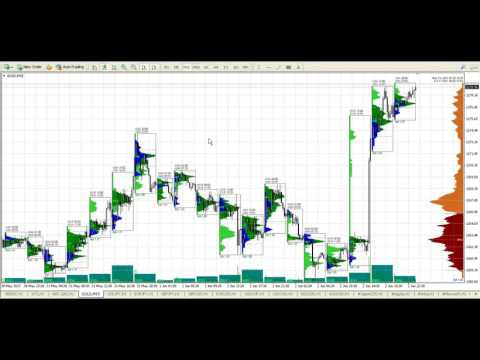
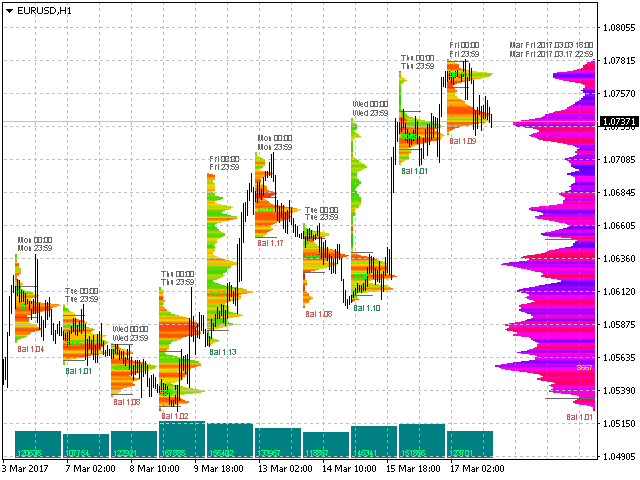
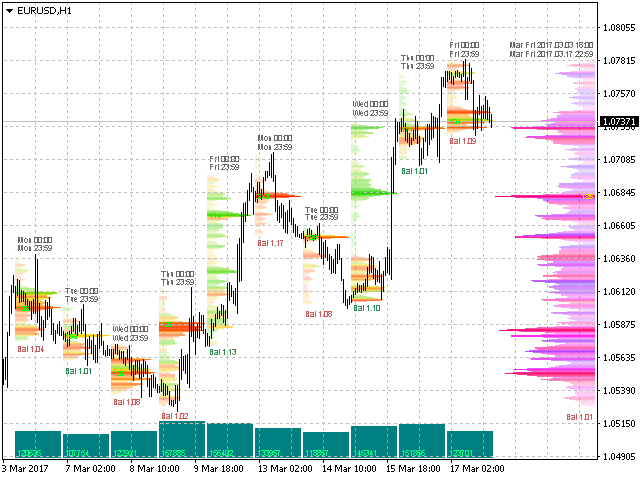
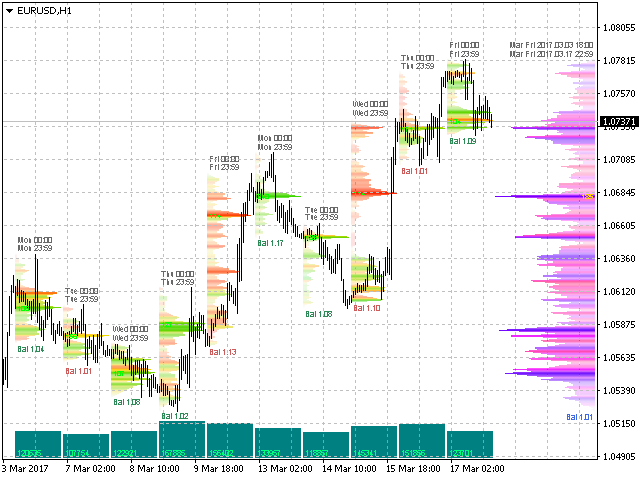
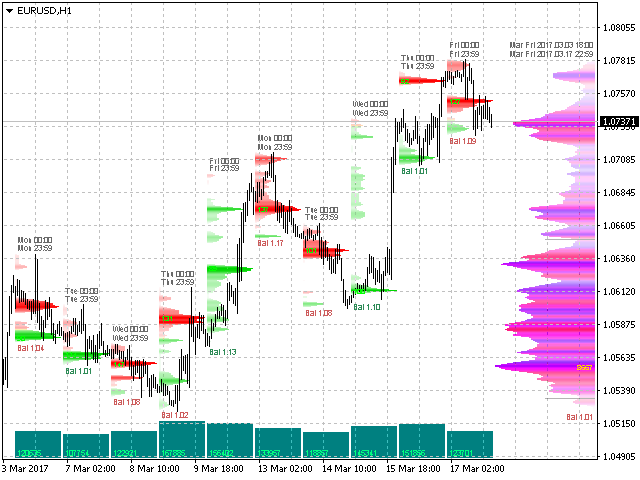
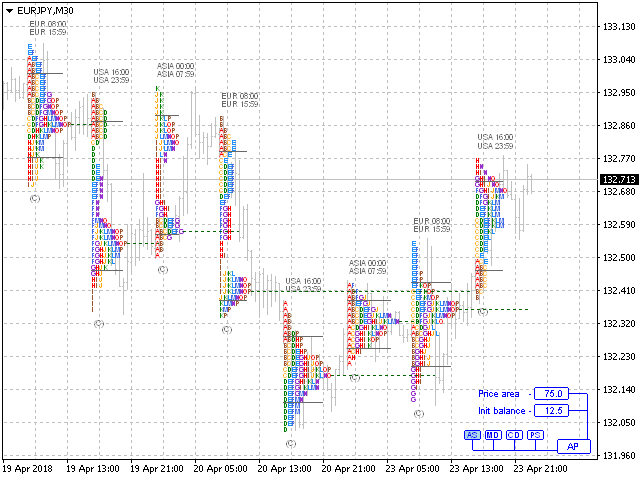
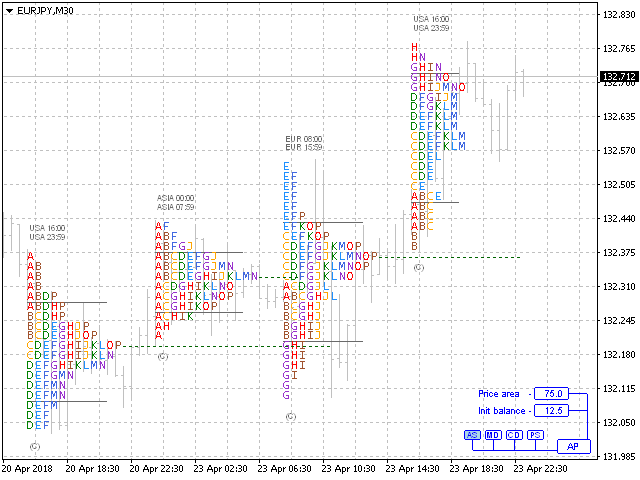
The indicator displays market profiles of any duration in any place on the chart.
Simply create a rectangle on the chart and this rectangle will be automatically filled by the profile. Change the size of the rectangle or move it - the profile will automatically follow the changes.
Operation features
The indicator is controlled directly from the chart window using the panel of buttons and fields for entering parameters.
In the lower right corner of the chart window there is a pop-up "AP" button of the main menu, which is conditionally divided into two halves - clicking on the left half switches groups of control buttons, clicking on the right half switches groups of fields for entering parameters.
The indicator properties window contains, basically, only input variables related to the settings of colors, fonts size, line thickness, and so on.
The indicator remembers the settings (button status and numeric field values) individually for each timeframe.
The description of the indicator controls is on the "Comments" tab in post 410 of 21/11/2021.


This is a powerful tool.