Thrust map real time
- Indicatori
- Versione: 2.0
- Attivazioni: 10

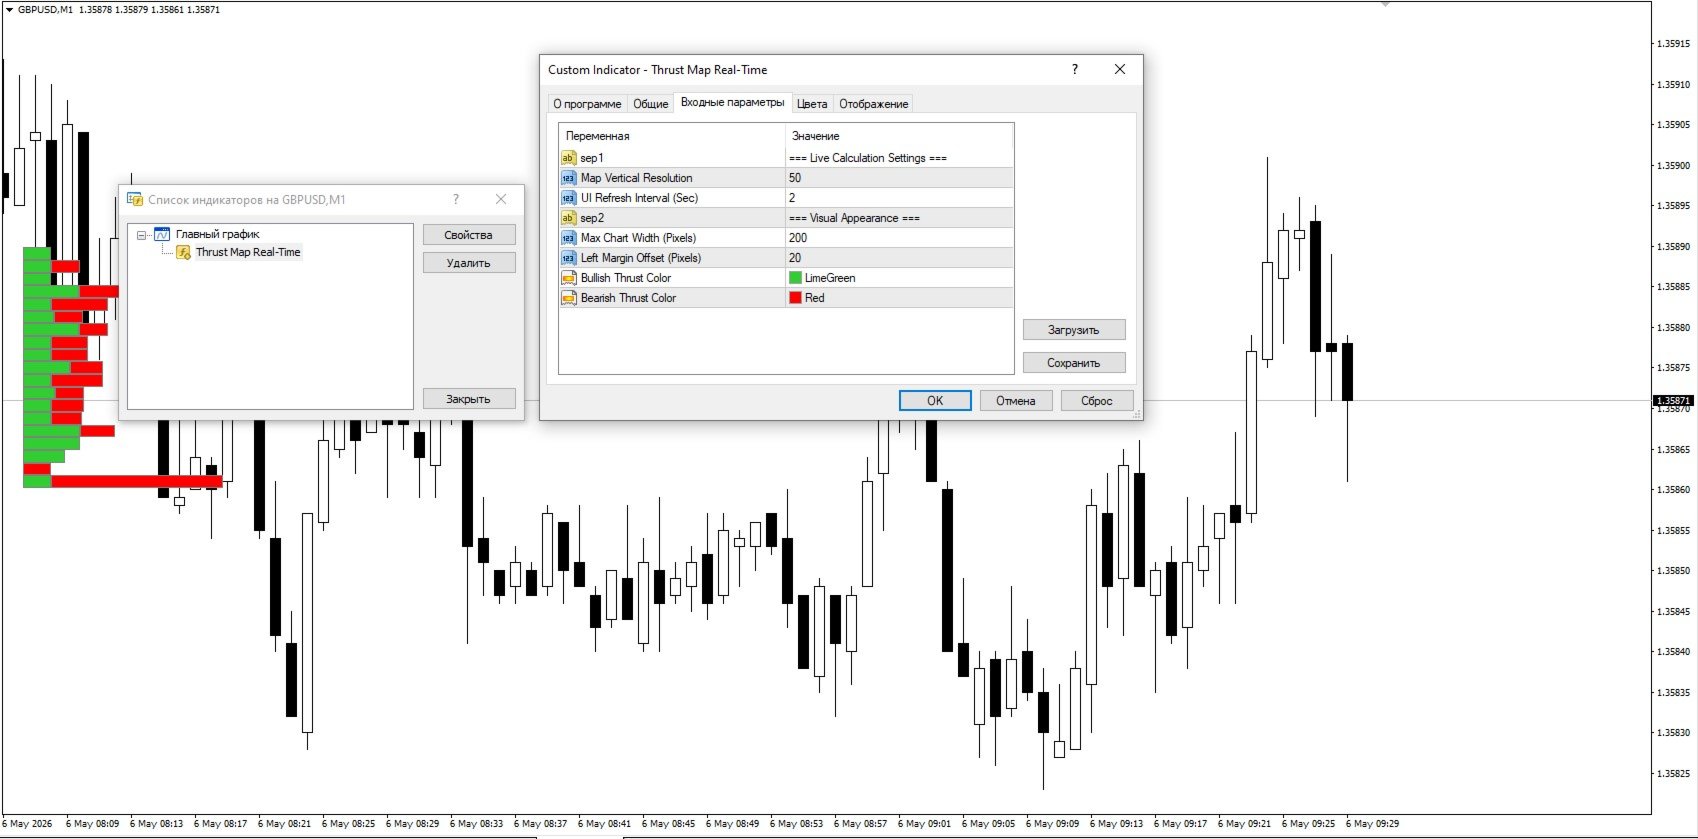
Unlike standard Volume Profiles that aggregate tick volume by price level, this indicator counts the number of candles that fall within each level's range. The profile accumulates data only from the moment of launch and categorizes it into Buy and Sell by analyzing the direction of every tick. It does not repaint.
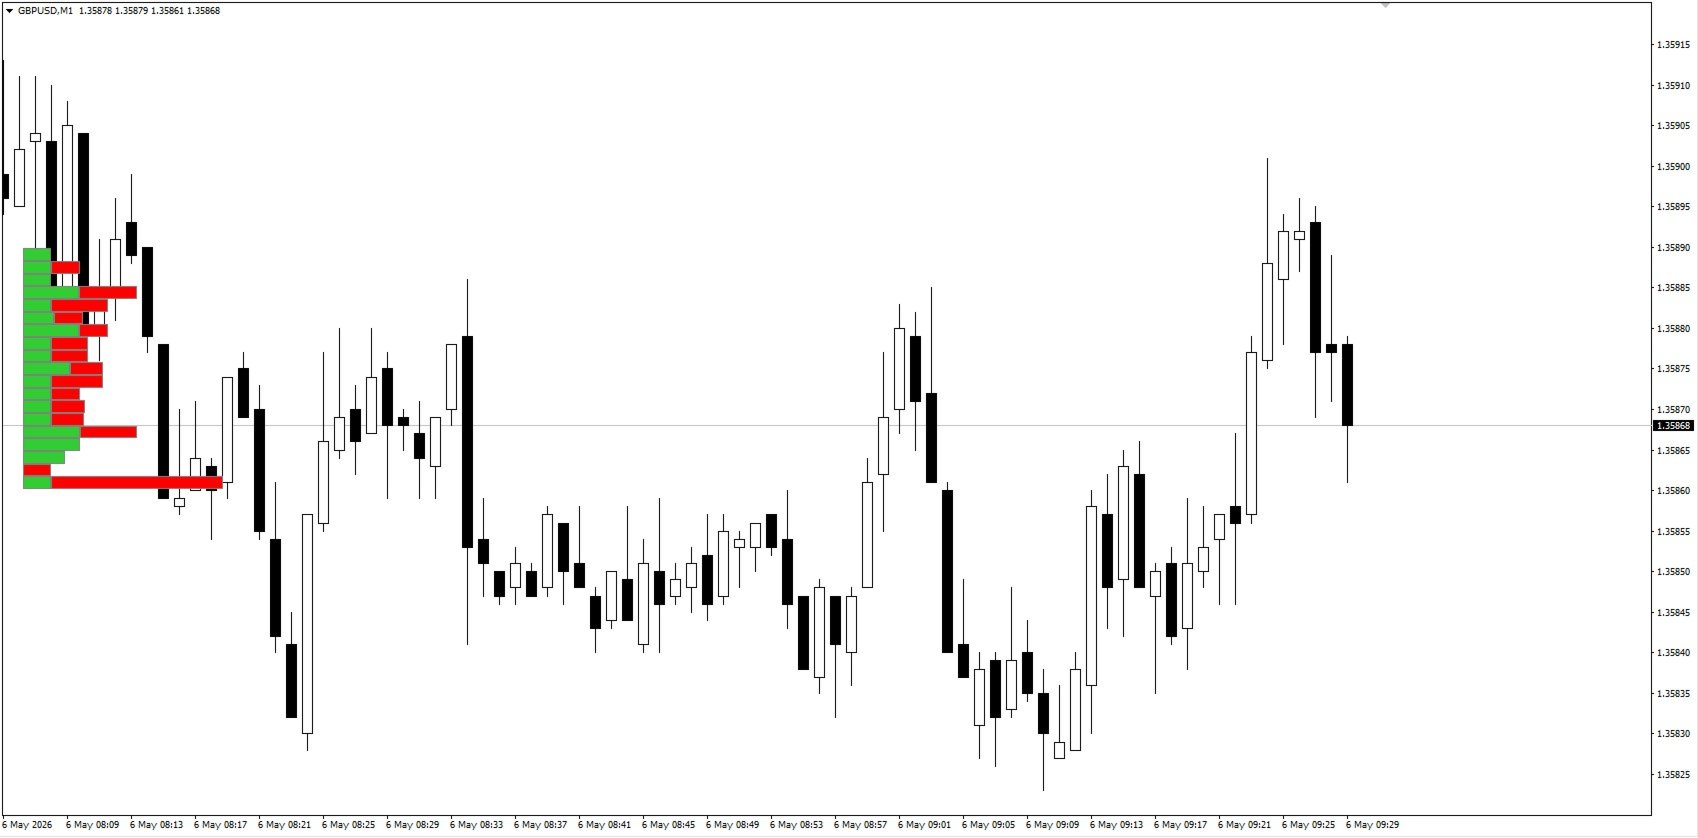
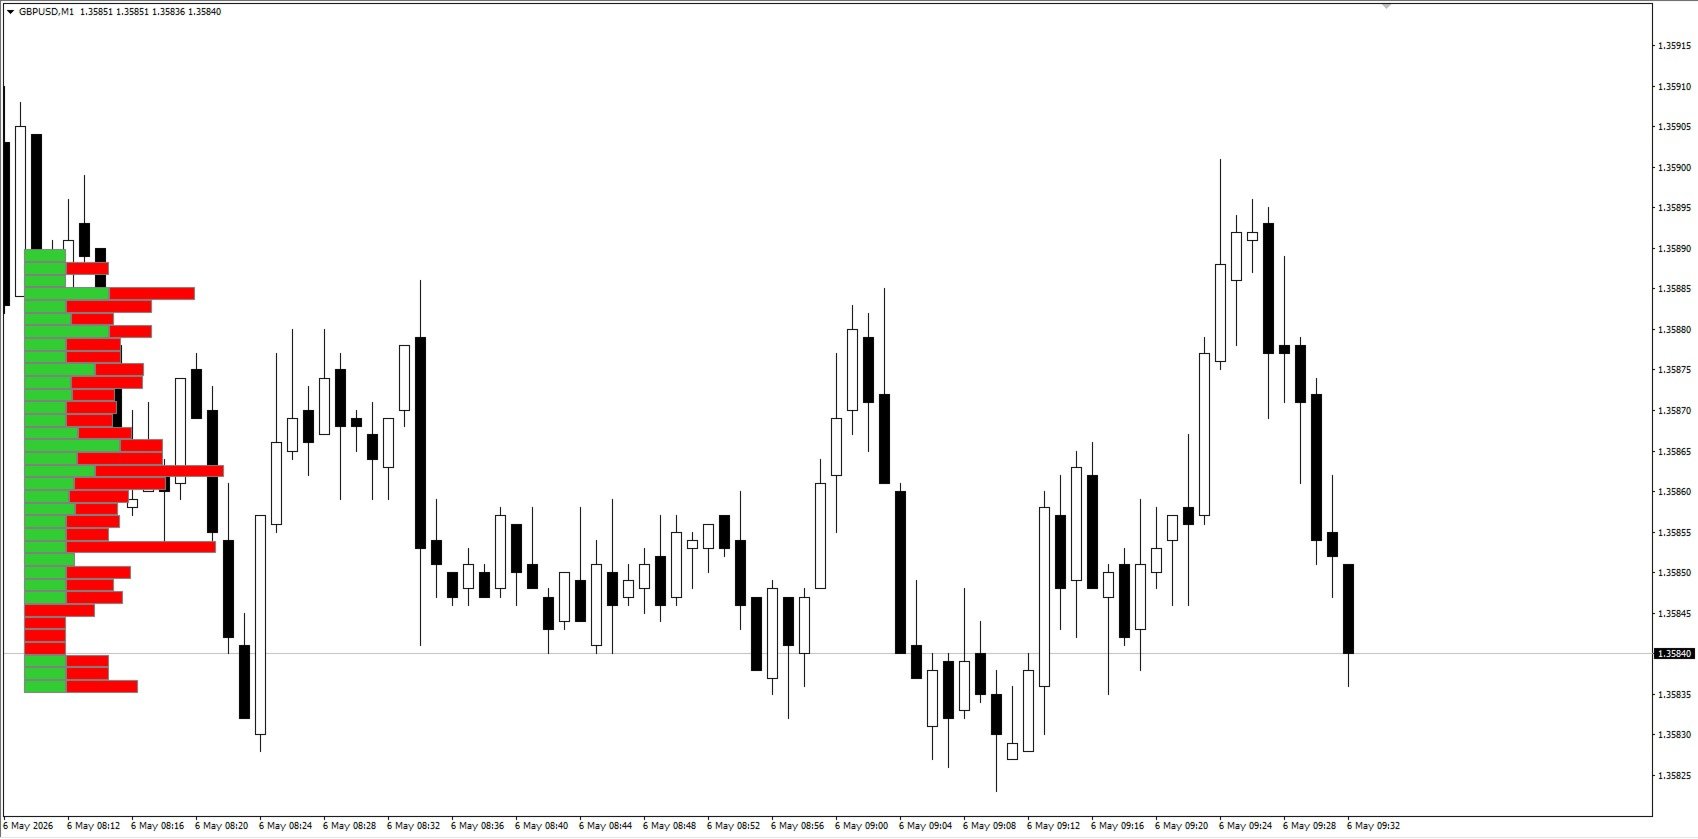
The indicator identifies horizontal levels where the price covers the "greatest distance with the fewest actions" (on average per candle). Initially, when first attached to the chart, nothing is displayed. As it gathers "live" tick history, it begins to plot a volume histogram.
The further evolution of this tool is the Dynamic Liquidity Profile , which includes the following features:
- Delta Filter: Highlights levels with a significant imbalance (e.g., where buy volume exceeds 70% of the total volume at that level).
- Vacuum Filter: Detects "price voids" (low-liquidity zones) where the price moved rapidly without lingering.