BoxProfile MT4
- Indicatori
-
Evgeny Shevtsov
 Indicators for volume trading :
Volume profile,
Classic profile,
Clusters chart,
Demand and supply levels,
Demand and supply diagram,
Cumulative delta.
Indicators for probabilistic analysis :
Monte Carlo predictor,
Neural predictor. - Versione: 2.5
- Aggiornato: 10 novembre 2024
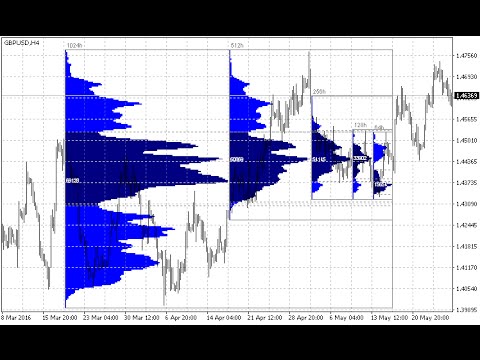
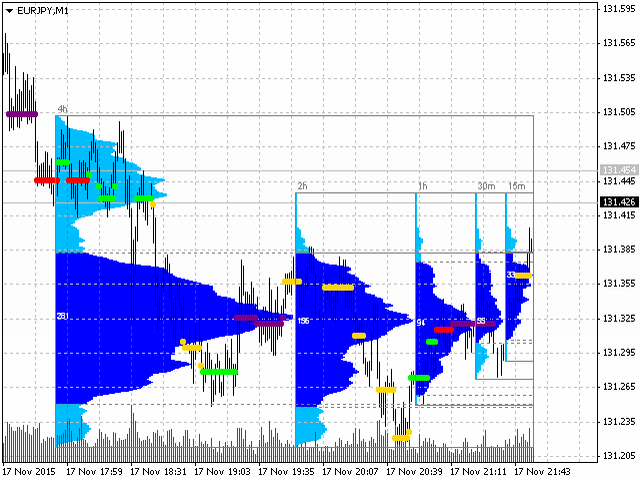
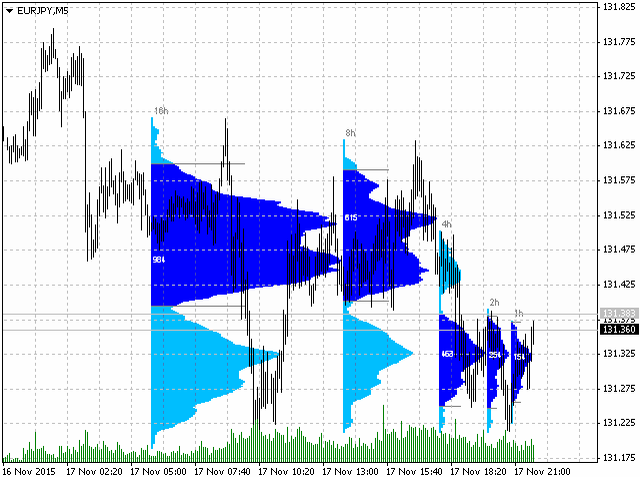
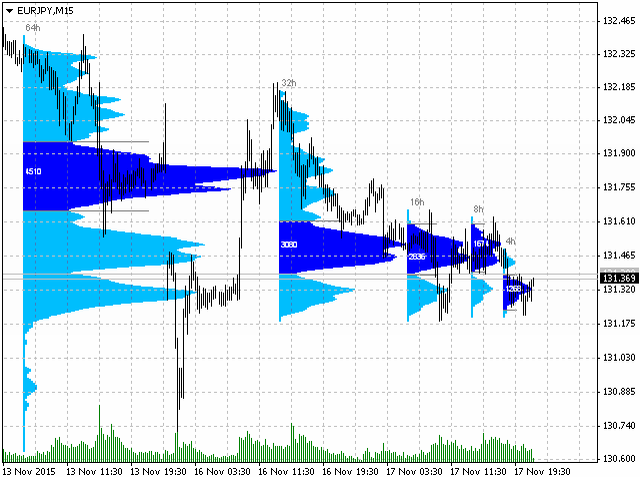
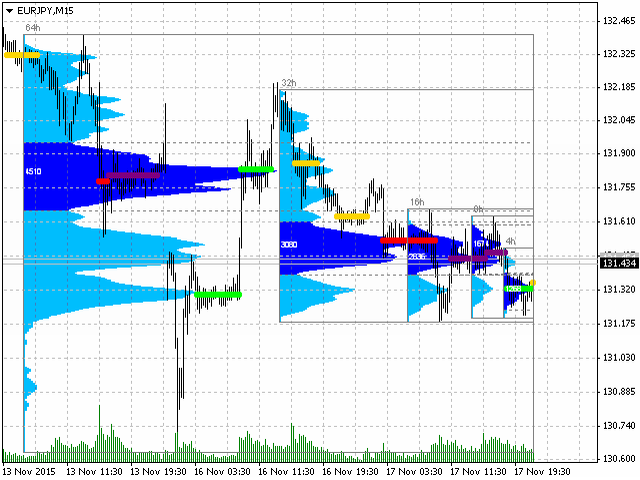
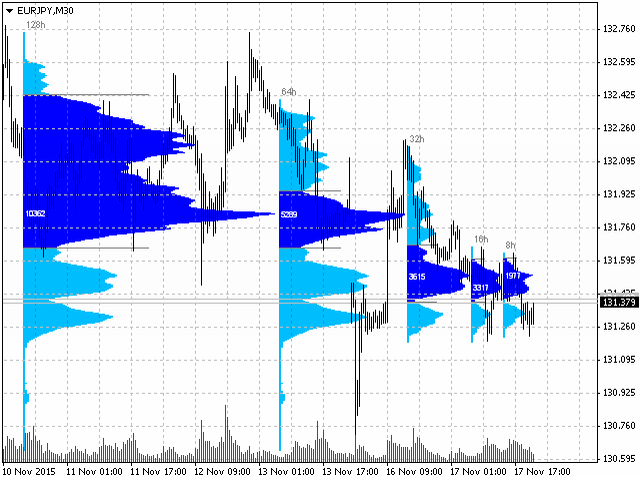
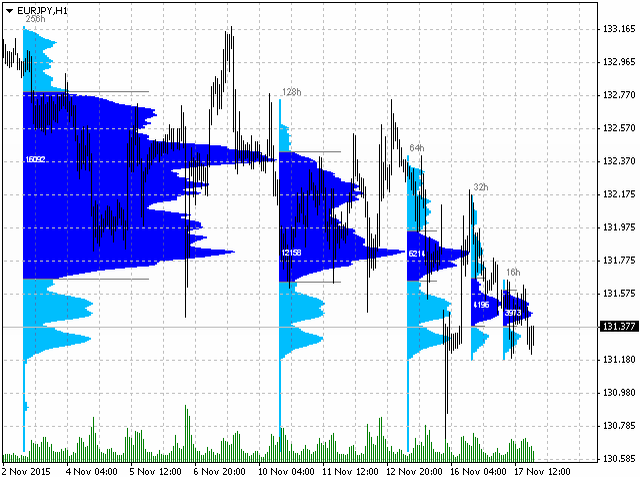
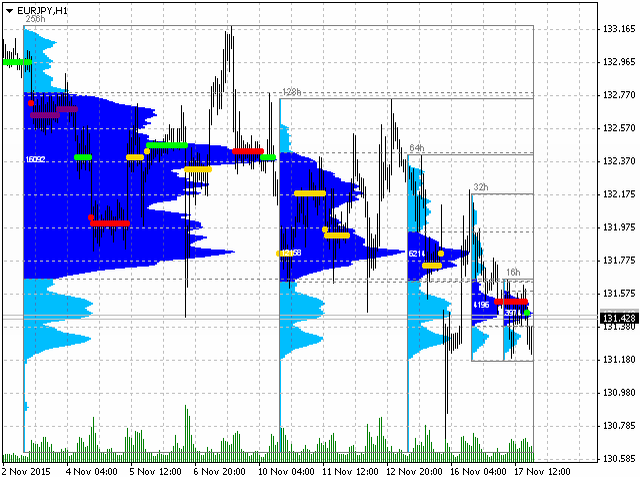
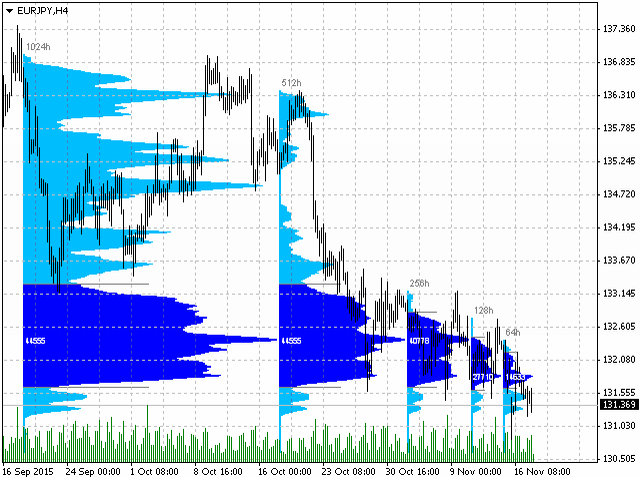
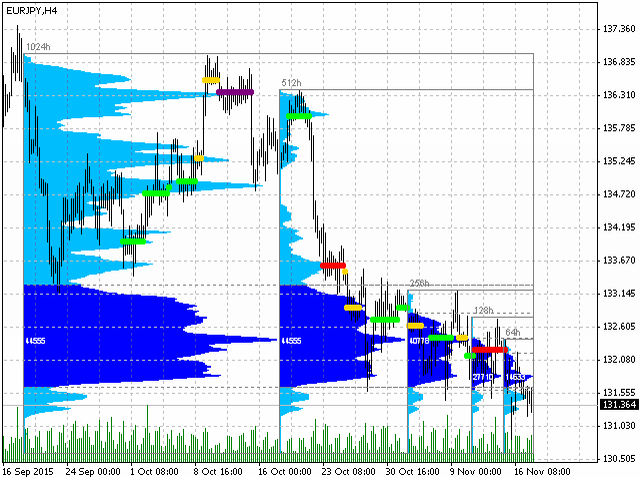
The indicator displays volume profiles based on the nesting principle.
Profiles periods are pre-set so that each subsequent profile has a length twice as long as the length of the previous profile.
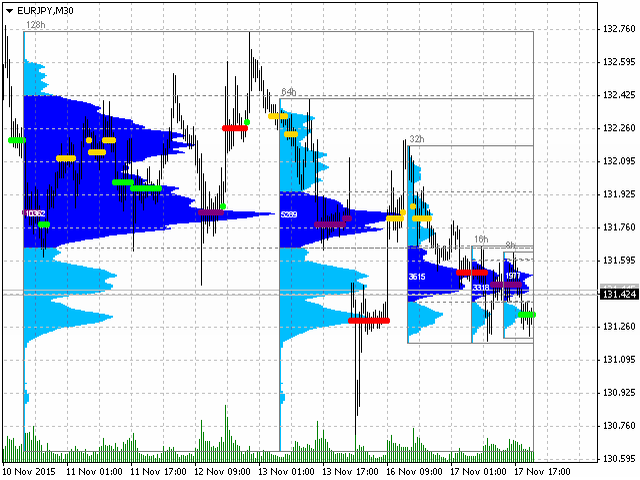
In addition to profiles, the indicator displays volume clusters sorted by color, depending on the volume they contain.
Indicator operation features
The indicator works on typical timeframes from M5 to MN, but for calculations uses historical data from smaller timeframes:
- M1 - for timeframes from M5 to H1,
- M5 - for timeframe H4,
- M30 - for timeframe D1,
- H4 - for timeframe W1,
- D1 - for timeframe MN.
A full recalculation the indicator performs: when the chart scale changes, when the chart scrolls, when the timeframe is switched, and when a new candle appears.
Input variables
- ProfileStepPoint - fixed clustering step along the price axis, set in "old" points, i.e. the value 0.1 corresponds to one "new" point.
- ProfileStepPointPix - dynamic clustering step along the price axis, set in pixels of the monitor.
- ProfilePriceArea - size of the value area.
- ProfileAreaMode - method for calculating the value area :
- OfPocND - distribution relative to the POC level.
- OfTotalVolume - distribution relative of the volume traded in the profile.
- BoxStepPoint - similar to ProfileStepPoint, but for volume clusters.
- BoxStepPointPix - similar to ProfileStepPointPix, but for volume clusters.
- BoxExcessRemove - function hides unnecessary clusters, leaving only the most important ones to be displayed.
- BoxDensity - function enables cluster calculation mode as volume concentration per unit of time.
- VolumesType - type of volumes used in calculations:
- Tick - tick volumes.
- Real - real volumes, if broadcast from the broker.
- Without - without volumes (volumes are emulated using the TPO principle).
- LowestBoxColor, LowBoxColor, MiddleBoxColor, MediumBoxColor, HighBoxColor, HighestBoxColor - group of variables that determine the color of clusters, depending on the volume value.
The other input variables are related to other settings, and their purpose is clear from their names.


Strategy testing this has to be the most entertaining motive. The volatility acquired looks like soundwaves of communications. I appreciated the timeframe overlay!