Gann Swing Structure MT5
- Indicatori
-
Kirill Borovskii
 My name is Kyril Borovsky and I provide professional services to teach methods of W.D.Ganna and give expert advice on trading in the forex market, which allow clients to achieve the planned financial goals. I also offer software based on years of experience and knowledge of the methods of the
 - Versione: 1.3
- Aggiornato: 14 giugno 2025
- Attivazioni: 5
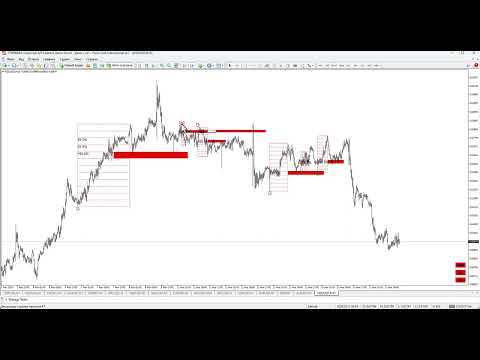
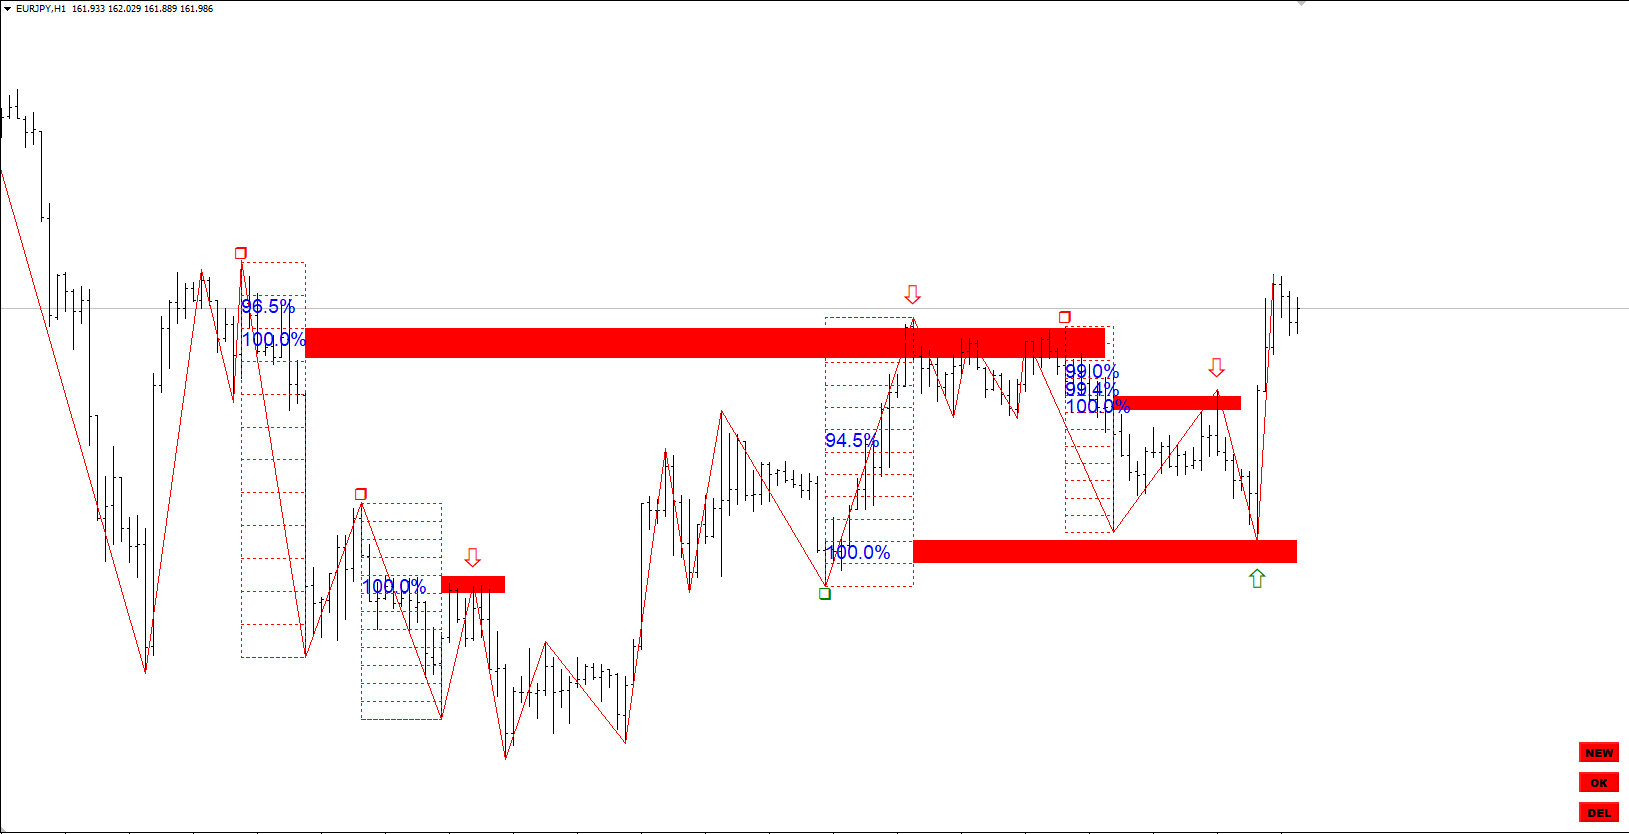
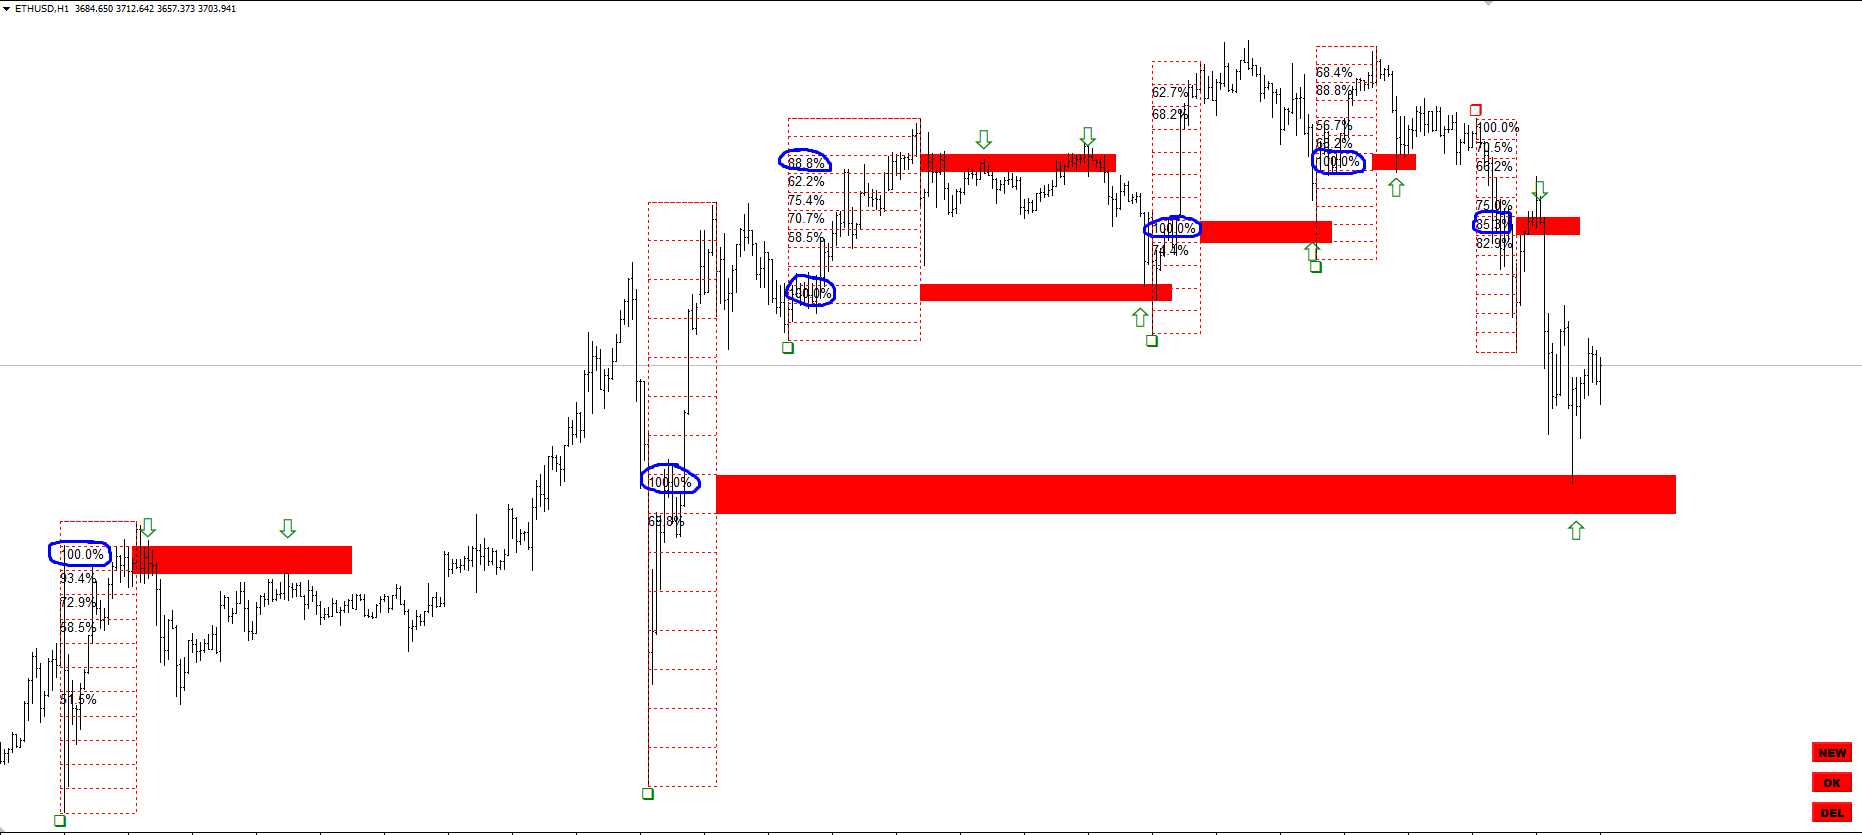
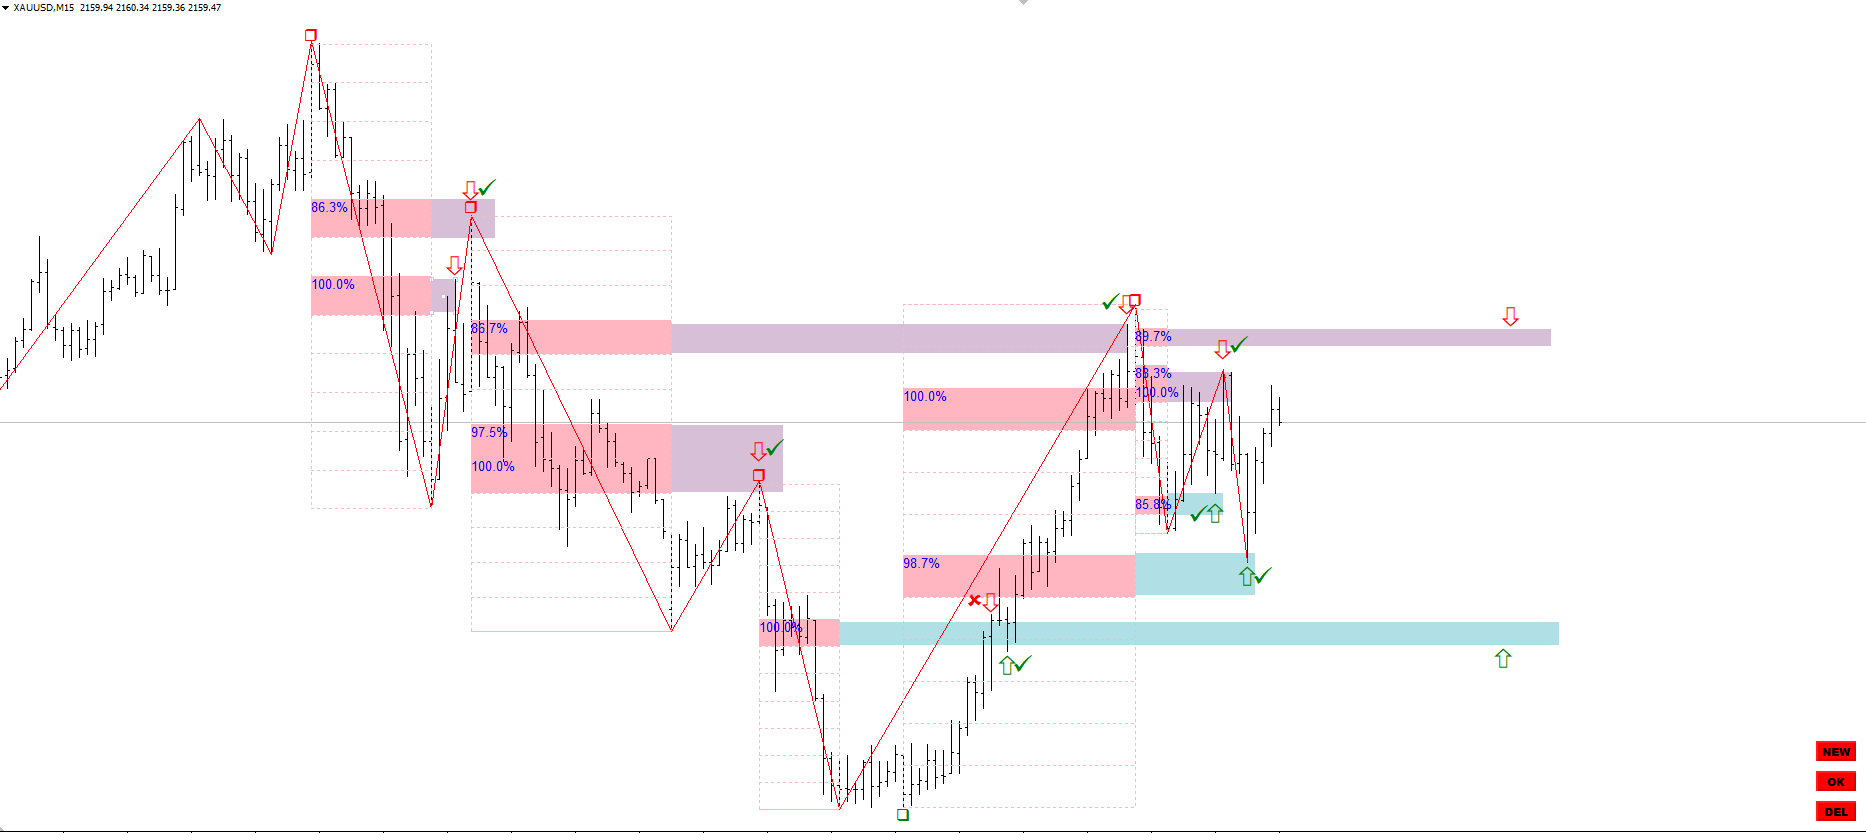
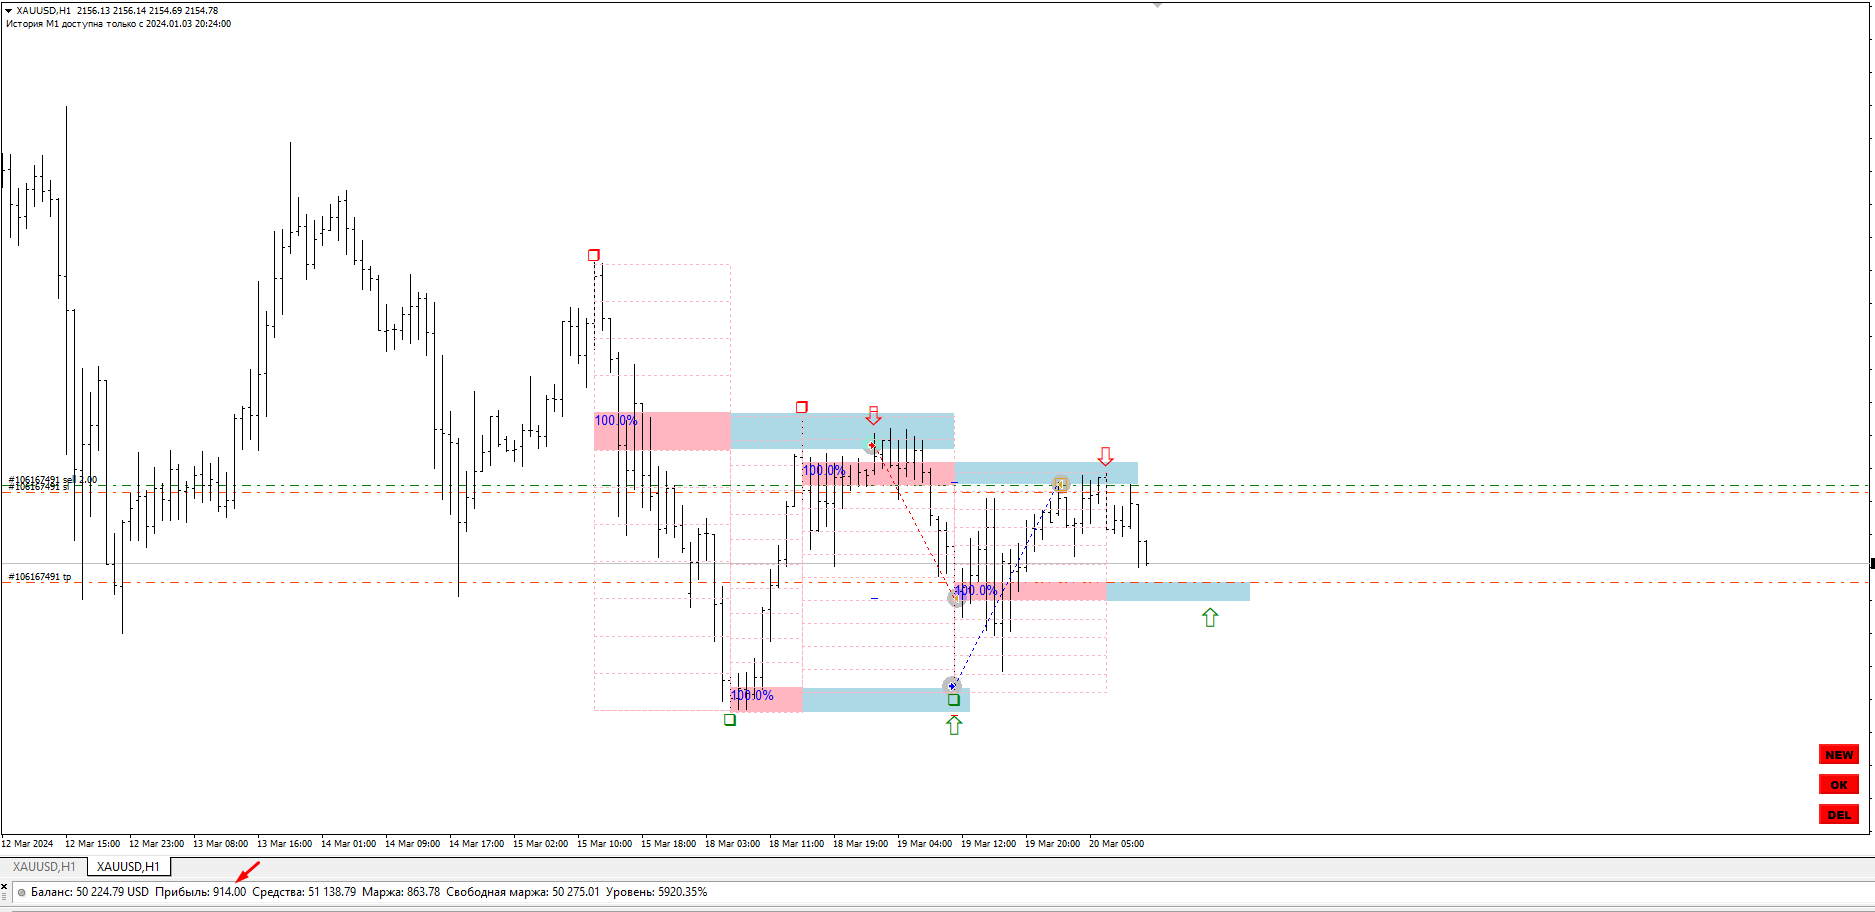
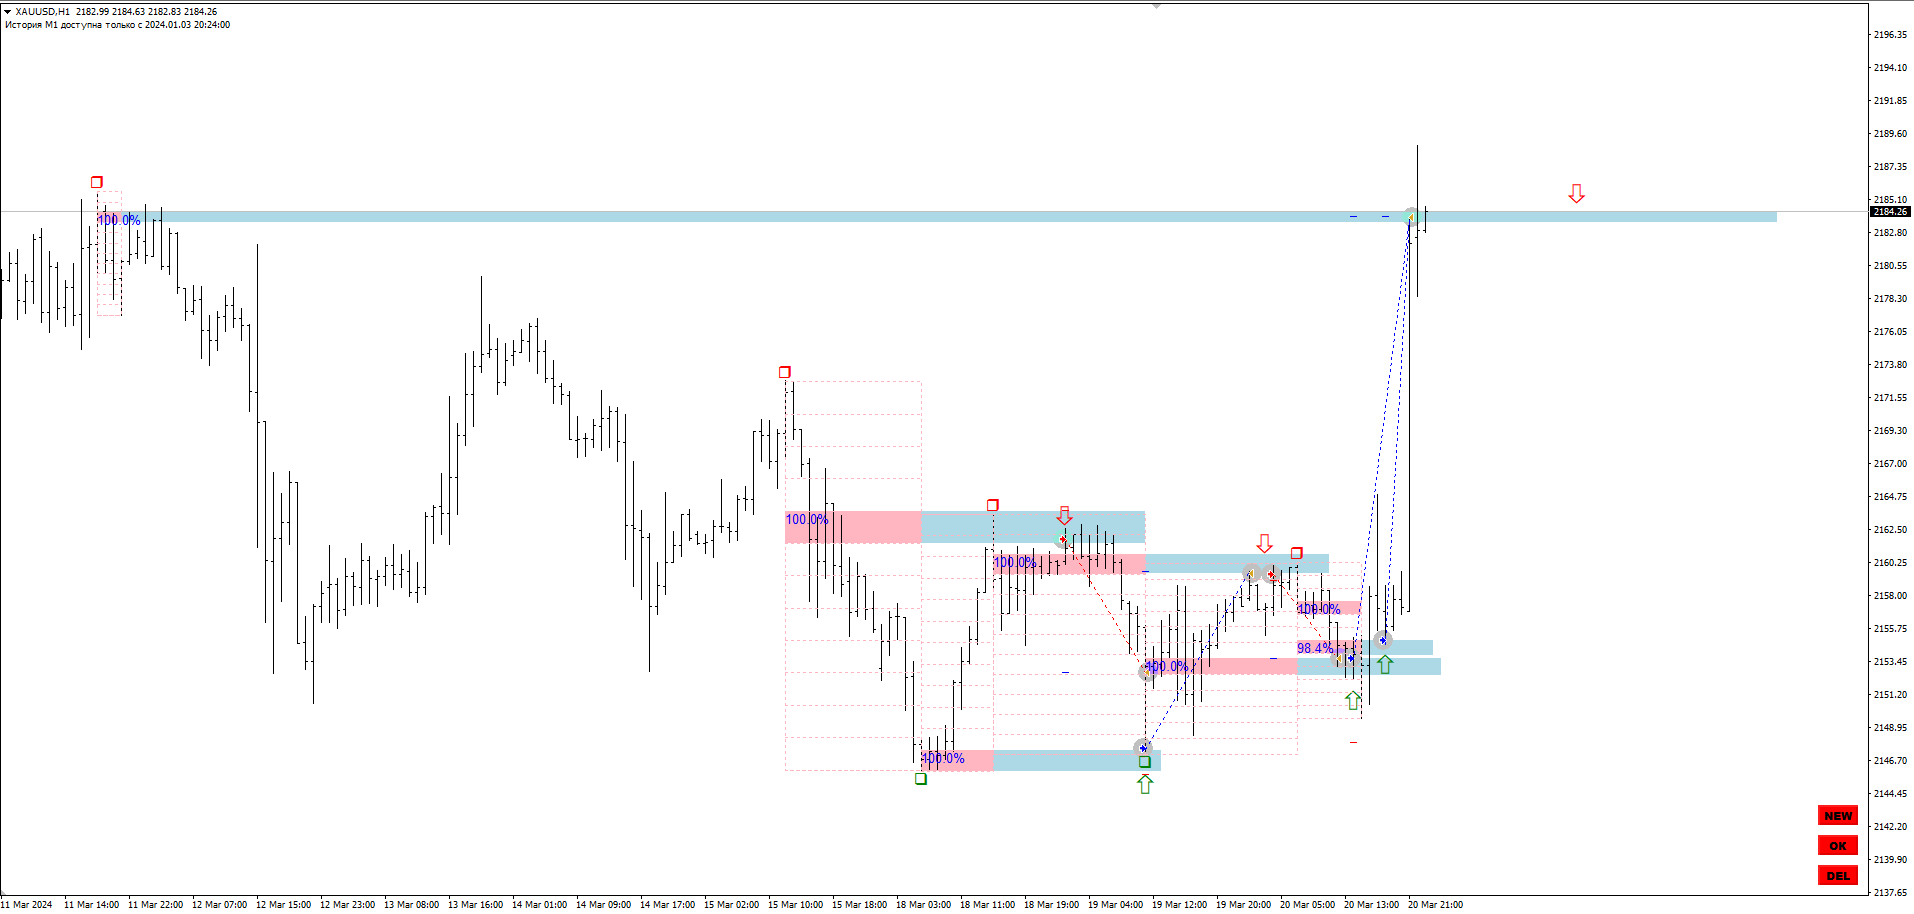
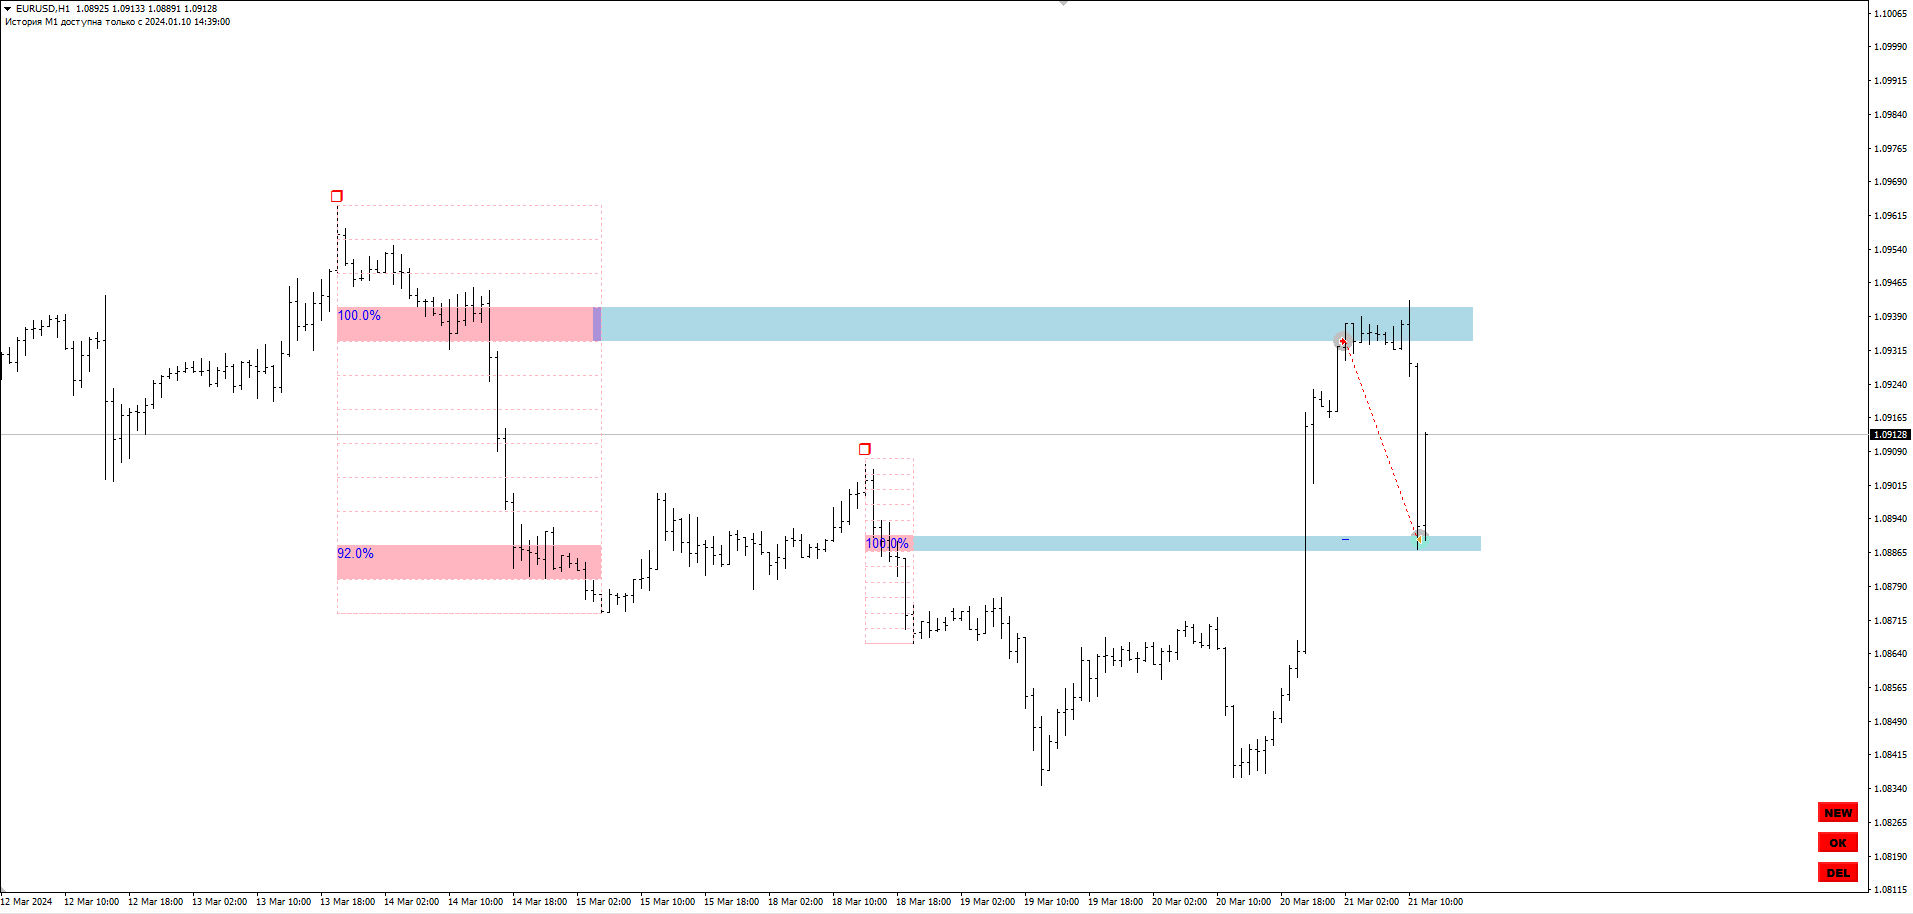
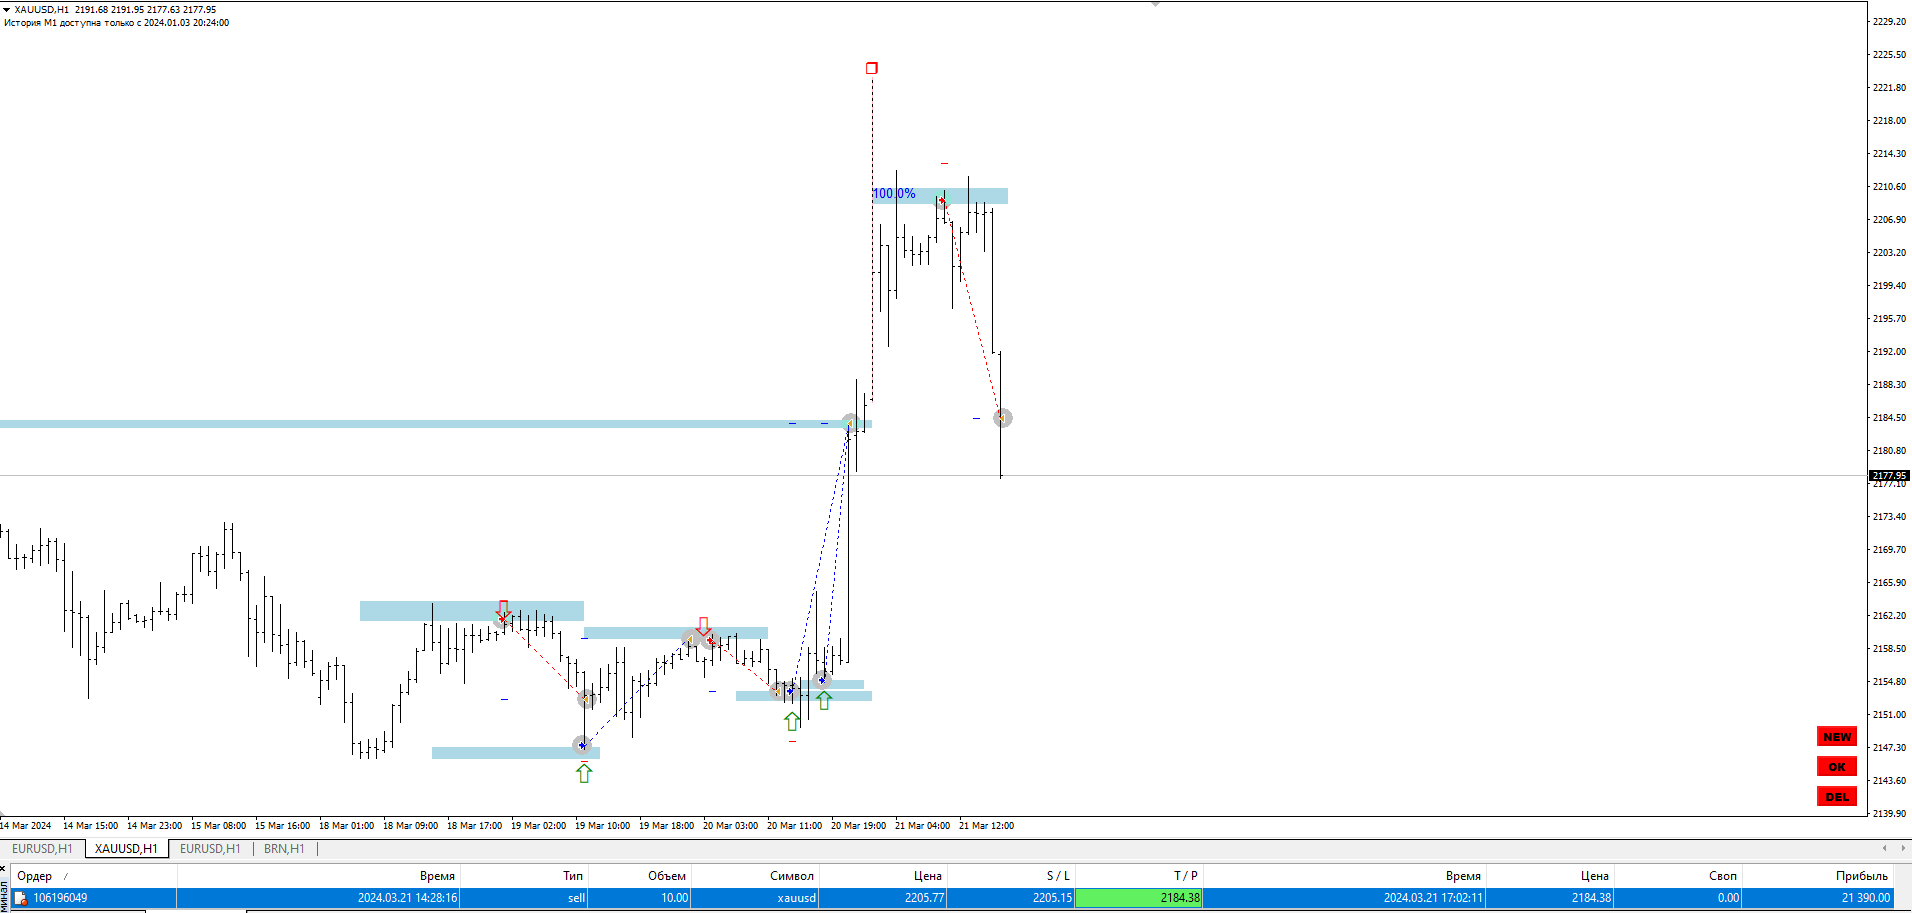
This indicator is based on the mathematics of the great trader W.D. Ganna. With its help, you can easily find strong levels by analyzing swings to find the optimal entry point. The indicator works on all instruments and all timeframes. The indicator is fully manual and has control buttons. All you need to do is press the NEW button, a segment will appear, which you can place on any movement, swing or even 1 candle that you want to analyze. By placing the segment, press the OK button. A grid (the parameters of which can be adjusted) will appear inside it, in which the percentage will be written (the parameters of which can also be adjusted). On what level the percentage is higher, there will be a greater likelihood of a reversal or correction. The work is based on working with levels.
Important note: Before using it, make sure to load the M1 history.
Important note: Due to the limitation of the strategy tester in the MT5 terminal, in which objects cannot be moved, this indicator cannot be tested in the strategy tester. To test this indicator, use the MT4 version. There are no such restrictions.