Gann Swing Structure
- Indicatori
-
Kirill Borovskii
 My name is Kyril Borovsky and I provide professional services to teach methods of W.D.Ganna and give expert advice on trading in the forex market, which allow clients to achieve the planned financial goals. I also offer software based on years of experience and knowledge of the methods of the
 - Versione: 1.2
- Aggiornato: 25 marzo 2024
- Attivazioni: 5
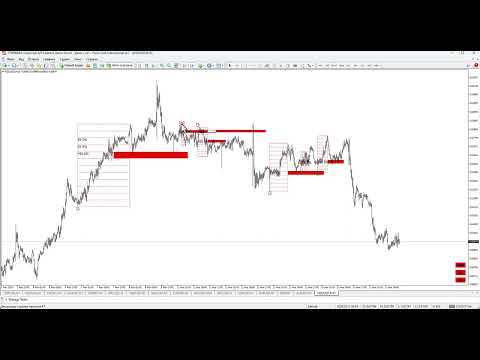
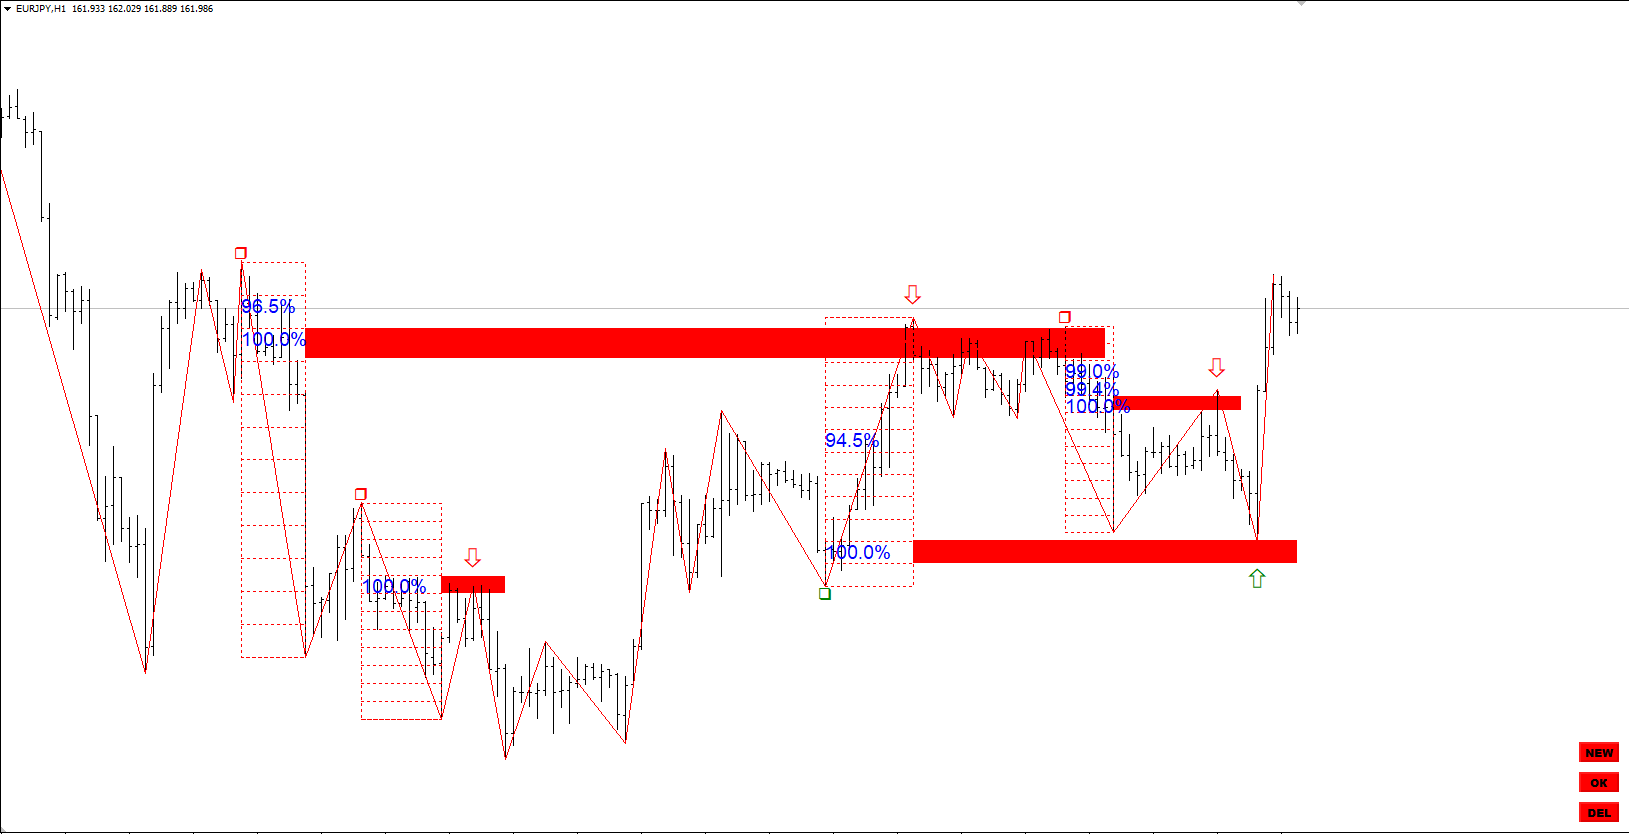
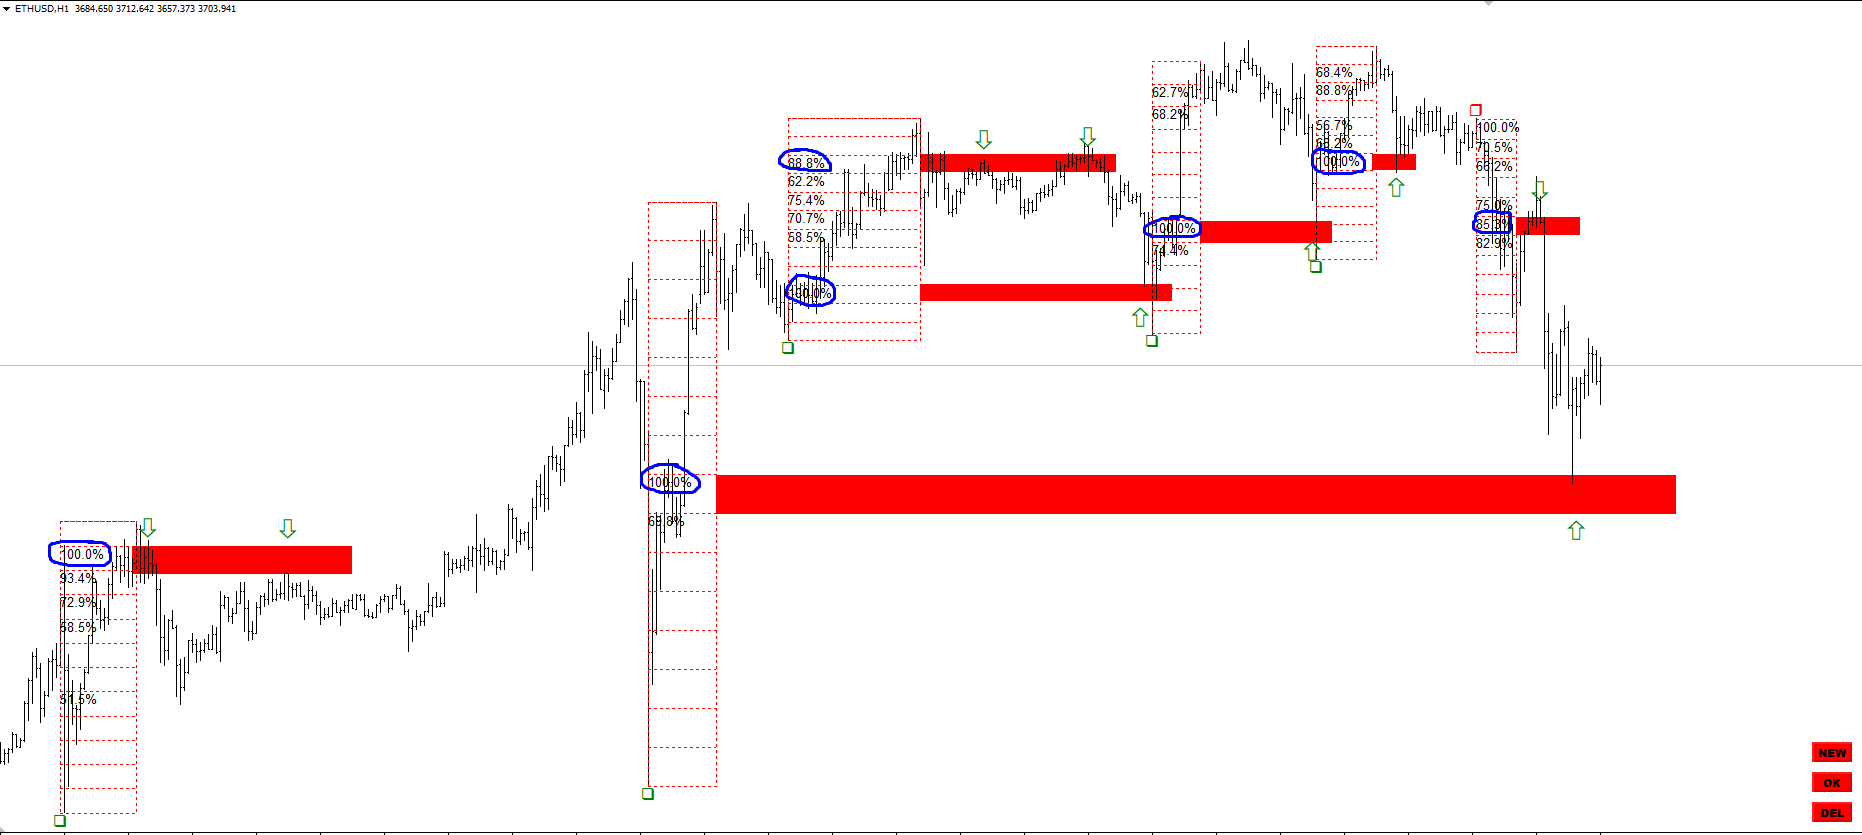
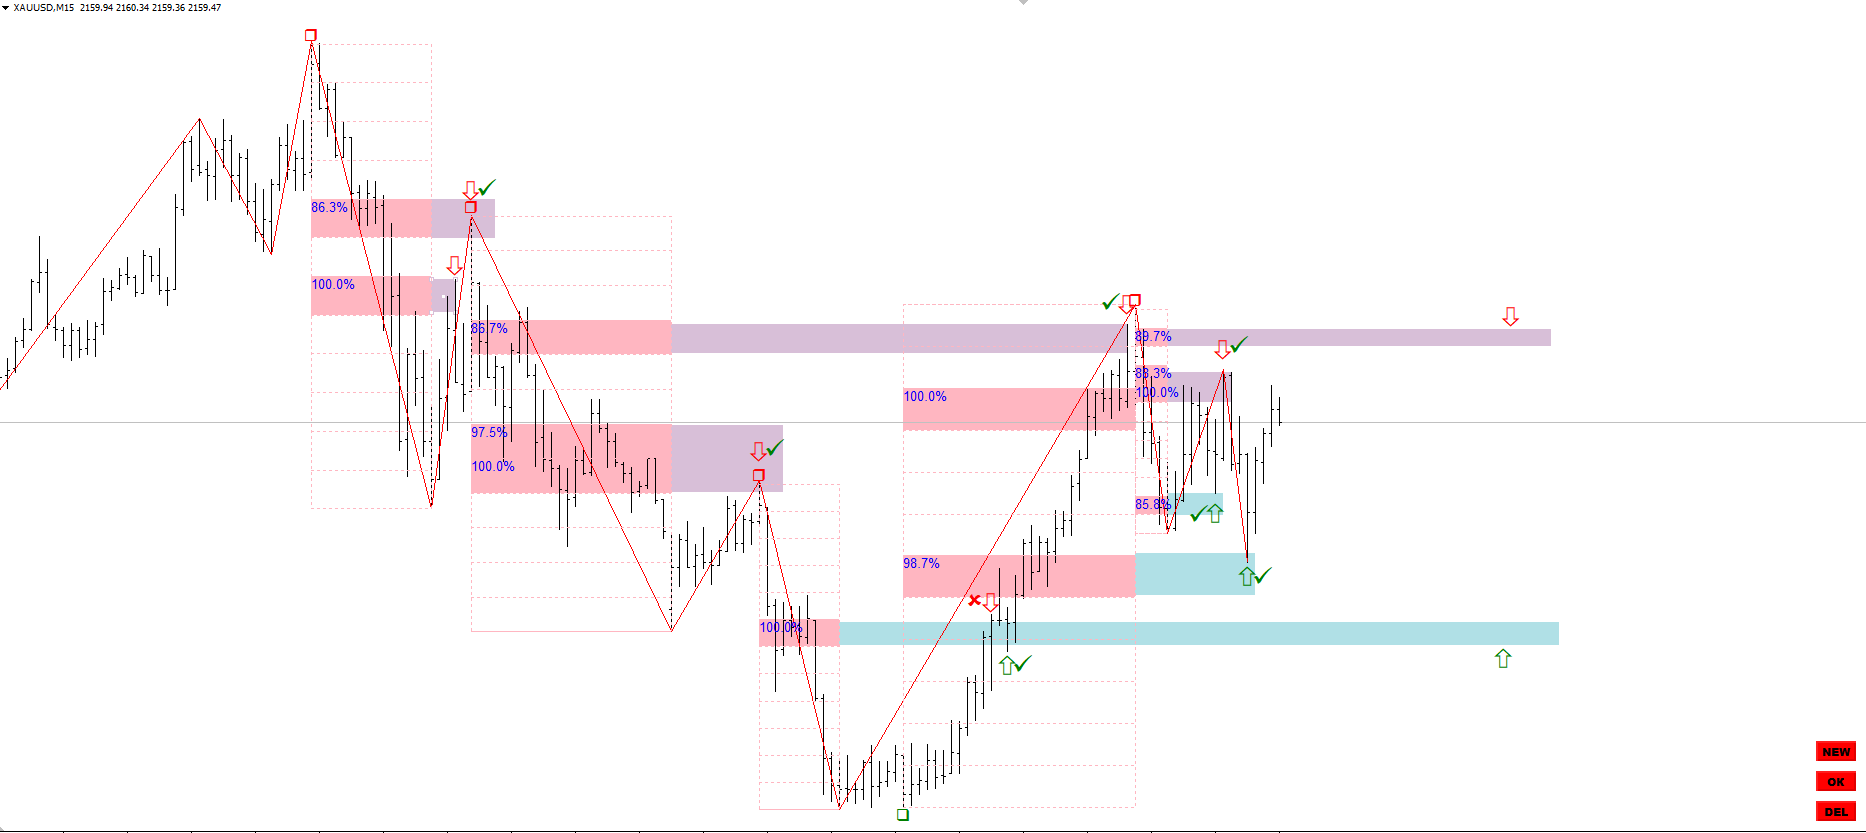
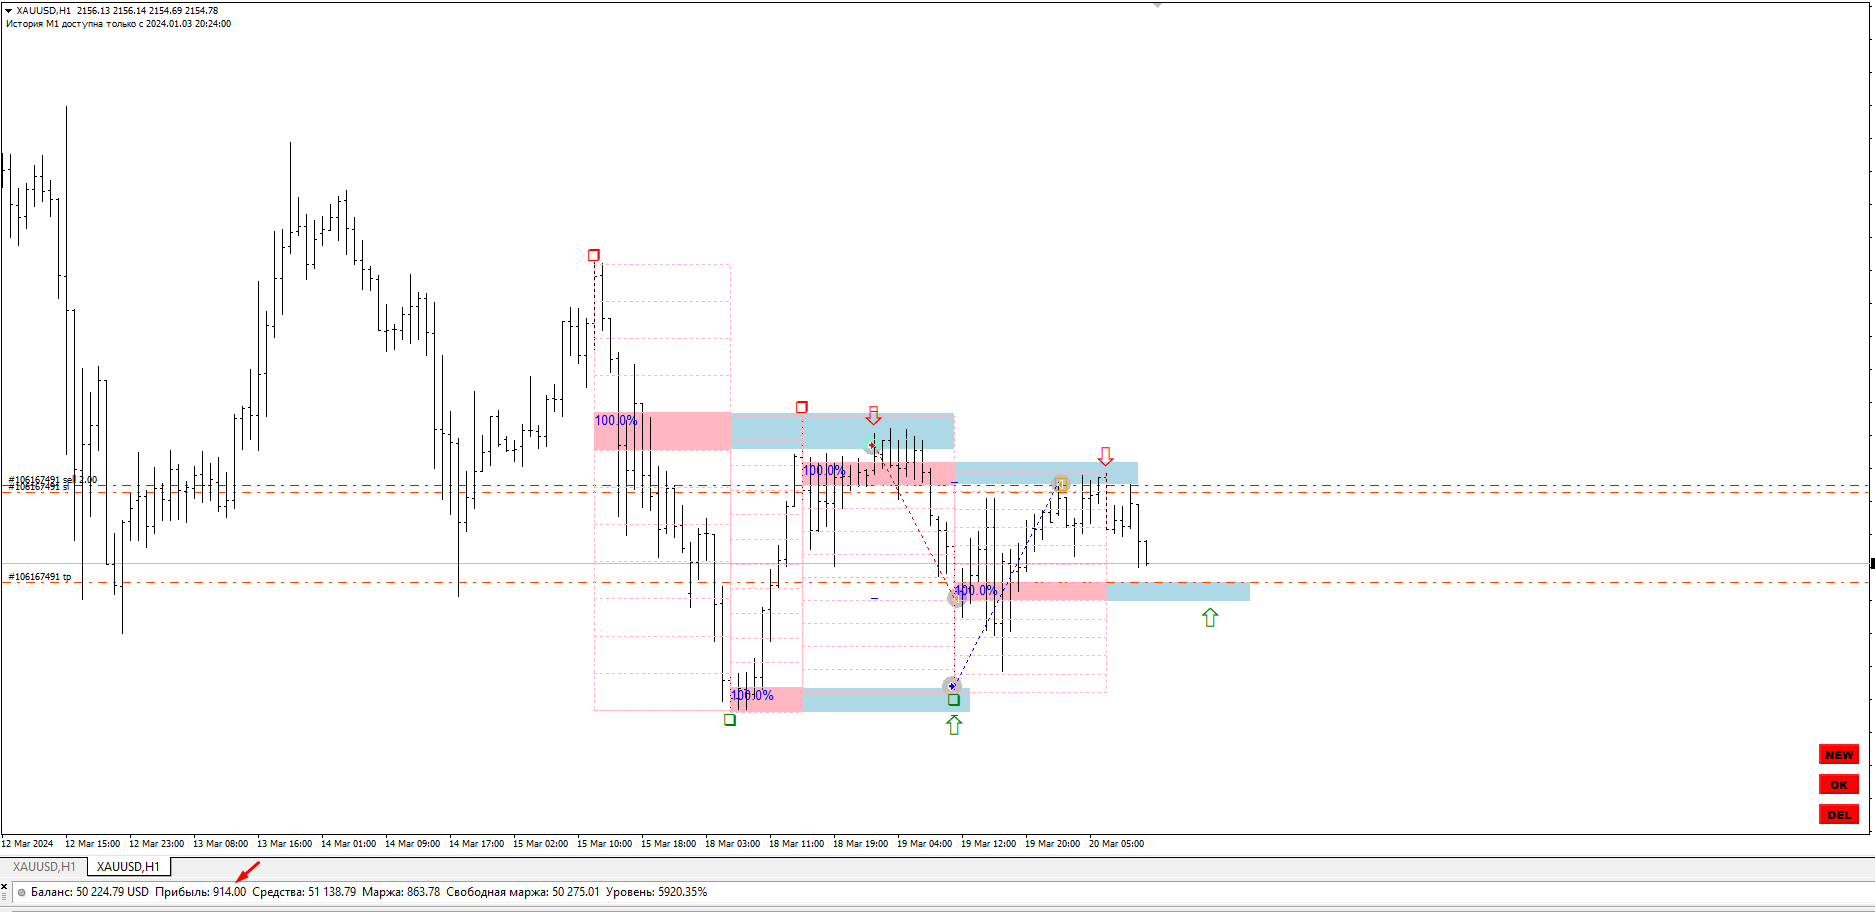
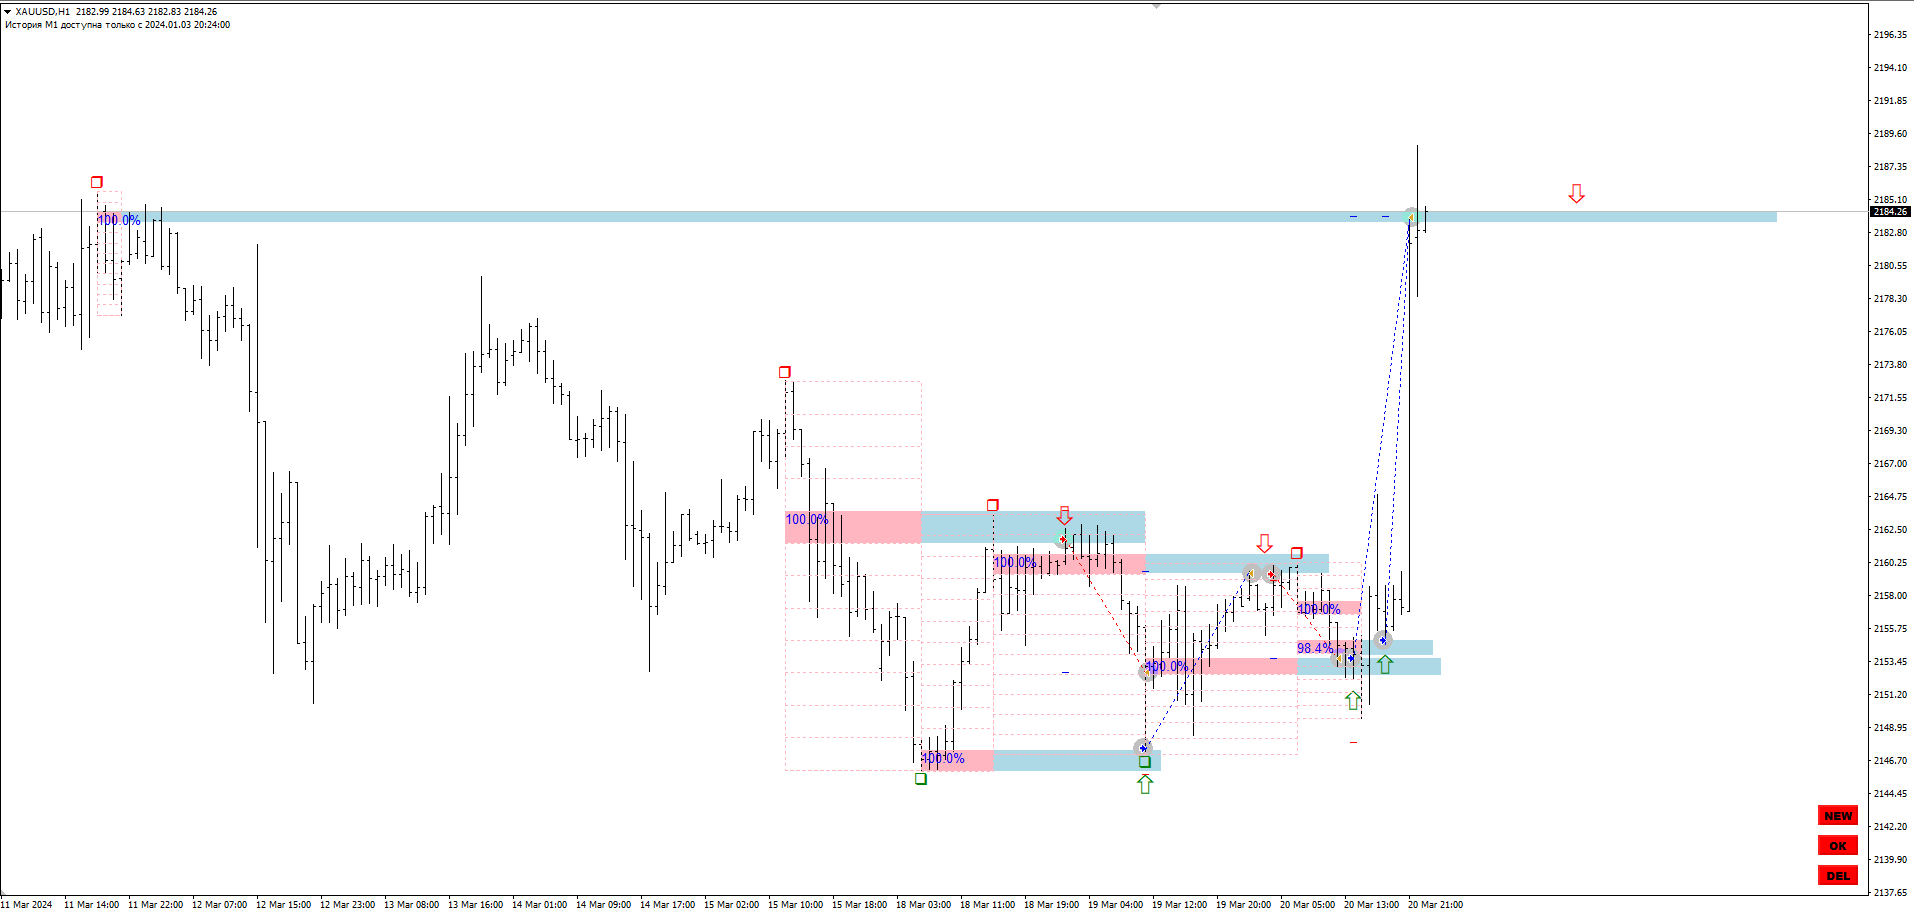
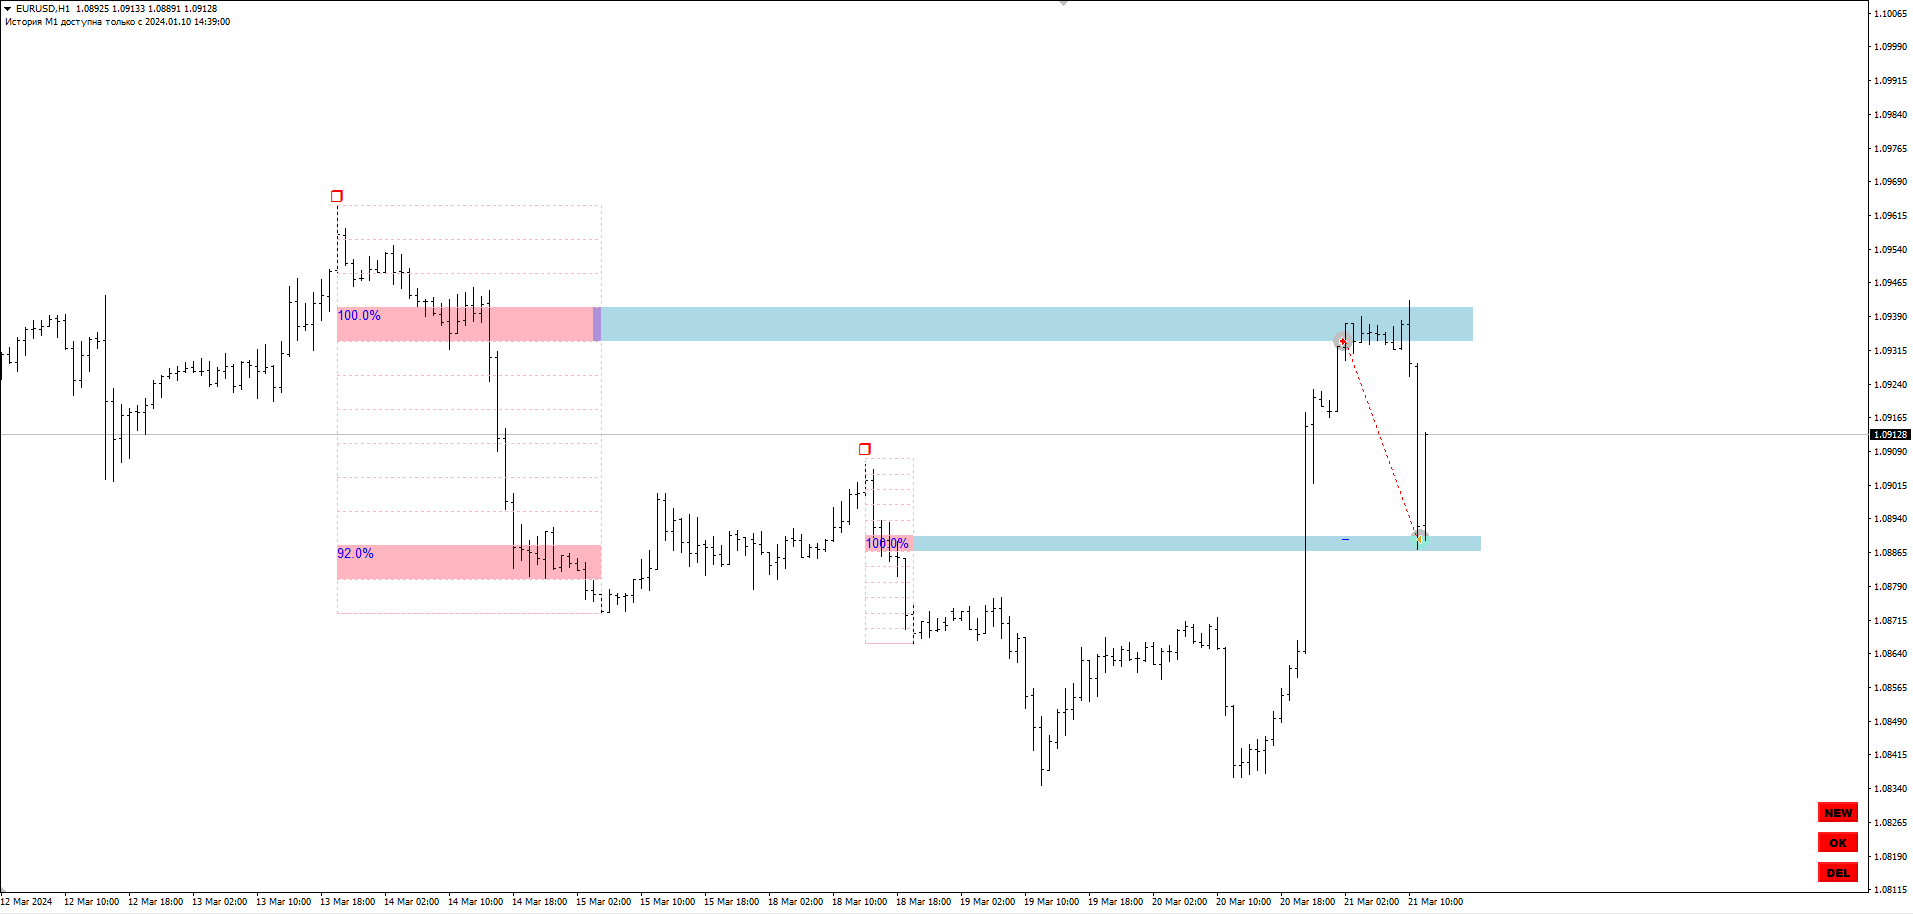
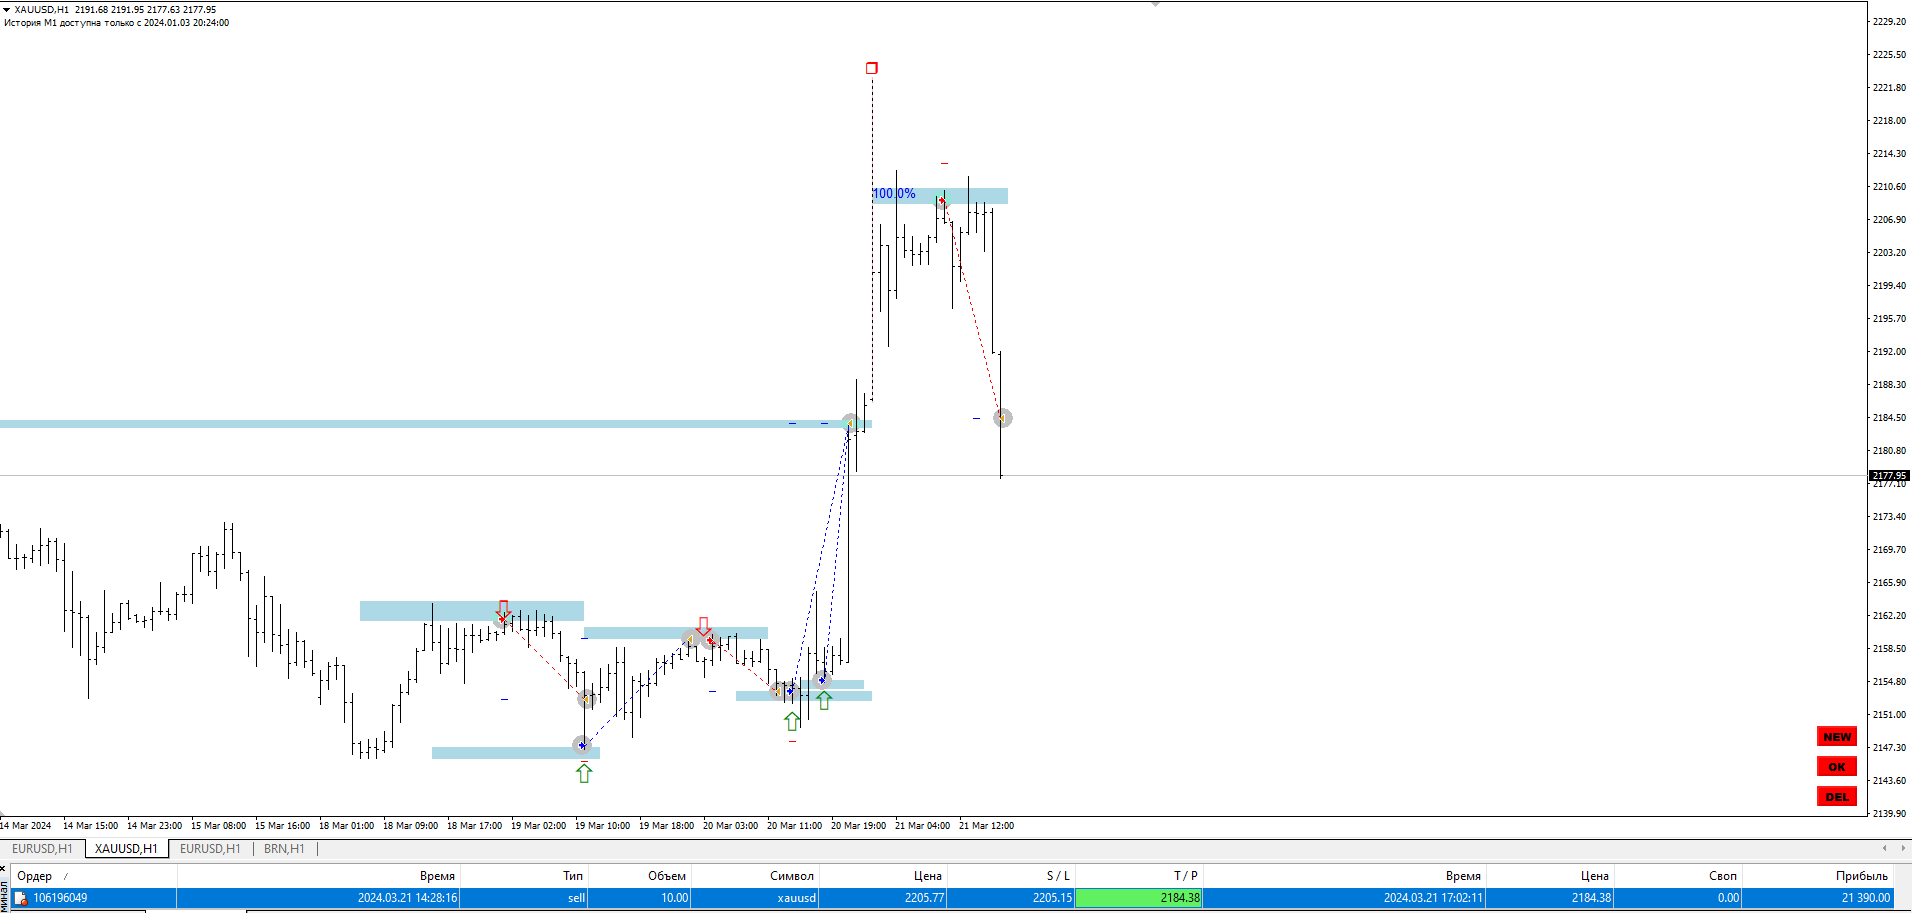
This indicator is based on the mathematics of the great trader W.D. Ganna. With its help, you can easily find strong levels by analyzing swings to find the optimal entry point. The indicator works on all instruments and all timeframes. The indicator is fully manual and has control buttons. All you need to do is press the NEW button, a segment will appear, which you can place on any movement, swing or even 1 candle that you want to analyze. By placing the segment, press the OK button. A grid (the parameters of which can be adjusted) will appear inside it, in which the percentage will be written (the parameters of which can also be adjusted). On what level the percentage is higher, there will be a greater likelihood of a reversal or correction. The work is based on working with levels.
Important note: Before using it, make sure to load the M1 history.
Just started interacting with Kirill’s Gann Swing Structure indicator so still learning on the proper usage However told to my self the idea of deciphering/calculating stats/probabilities from inside Gann swing and Kirill being quite confident in using 100 probability is pretty amazing. 500$ for such a functionality is a steal/very generous price! Also as someone being exposed to WD Gann’s work since 2006 can confirm that Kirill could very much be pioneer in this area of research pertaining to Gann’s work. Can also confirm once you load sufficient amount of M1 data to support higher timeframes Percentage stats off Gann swing appears to be accurate. What I’ve meant to say they match Kirill’s YouTube videos that price will Revisit 100% level. Pretty amazing to witness first hand if you ask me. Yes, this indicator I suppose is for niche application however I don’t see a reason why anyone couldn’t utilize Kirill’s research assuming proper rules being followed (very similar to support and demand zones). You just need to keep an open mind that there’s whole world beyond traditional technical analysis. To something classical analysts may say “no it’s not possible”. :). If you have an open mind and willing to venture into areas some may define as “fringe” and willing to drastically improve your manual trading prowess this indicator will be perfect addition pertaining to your position exit/TPs. Enjoy! Alex.