Combo View Impulse System
- Indicatori
-
Illia Zhavarankau
 I program in MQL4 trading robots. I am looking for interesting people who are interested in this direction.
I run my blog https://botrader.org. - Versione: 1.0
- Attivazioni: 5
This indicator combines several functionalities:
-
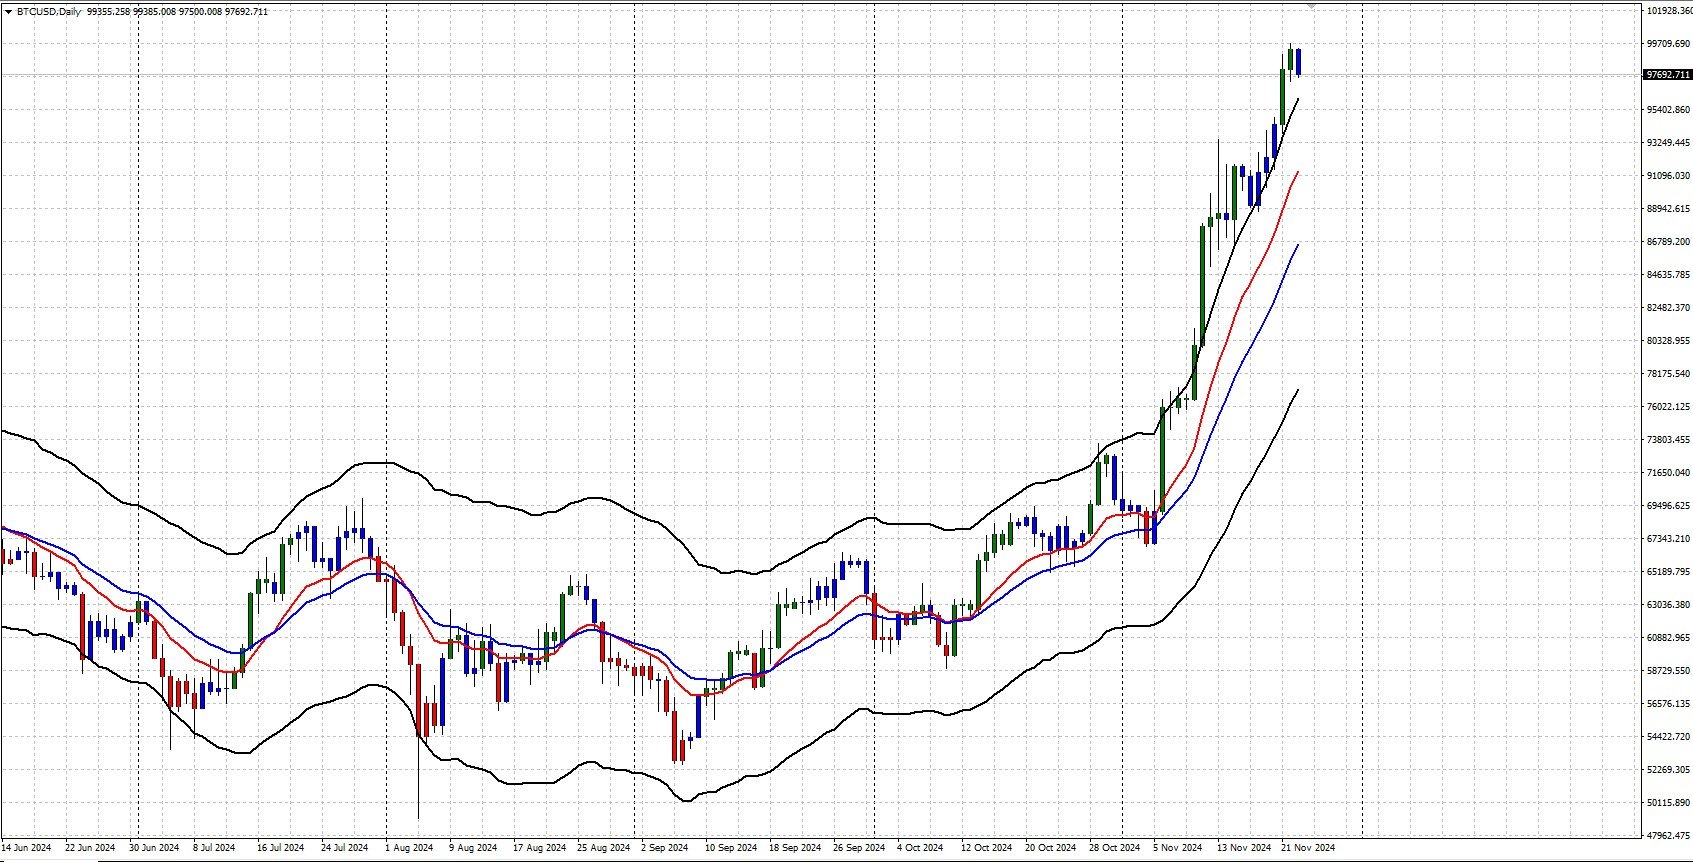
Value Zone
- Displays two exponential moving averages (EMAs):
- 13-period EMA in red.
- 22-period EMA in blue.
- Displays two exponential moving averages (EMAs):
-
Impulse System (based on Dr. Alexander Elder's methodology)
- Candles are color-coded to indicate trade restrictions:
- Red candles prohibit buying.
- Green candles prohibit selling.
- Blue candles allow both buying and selling.
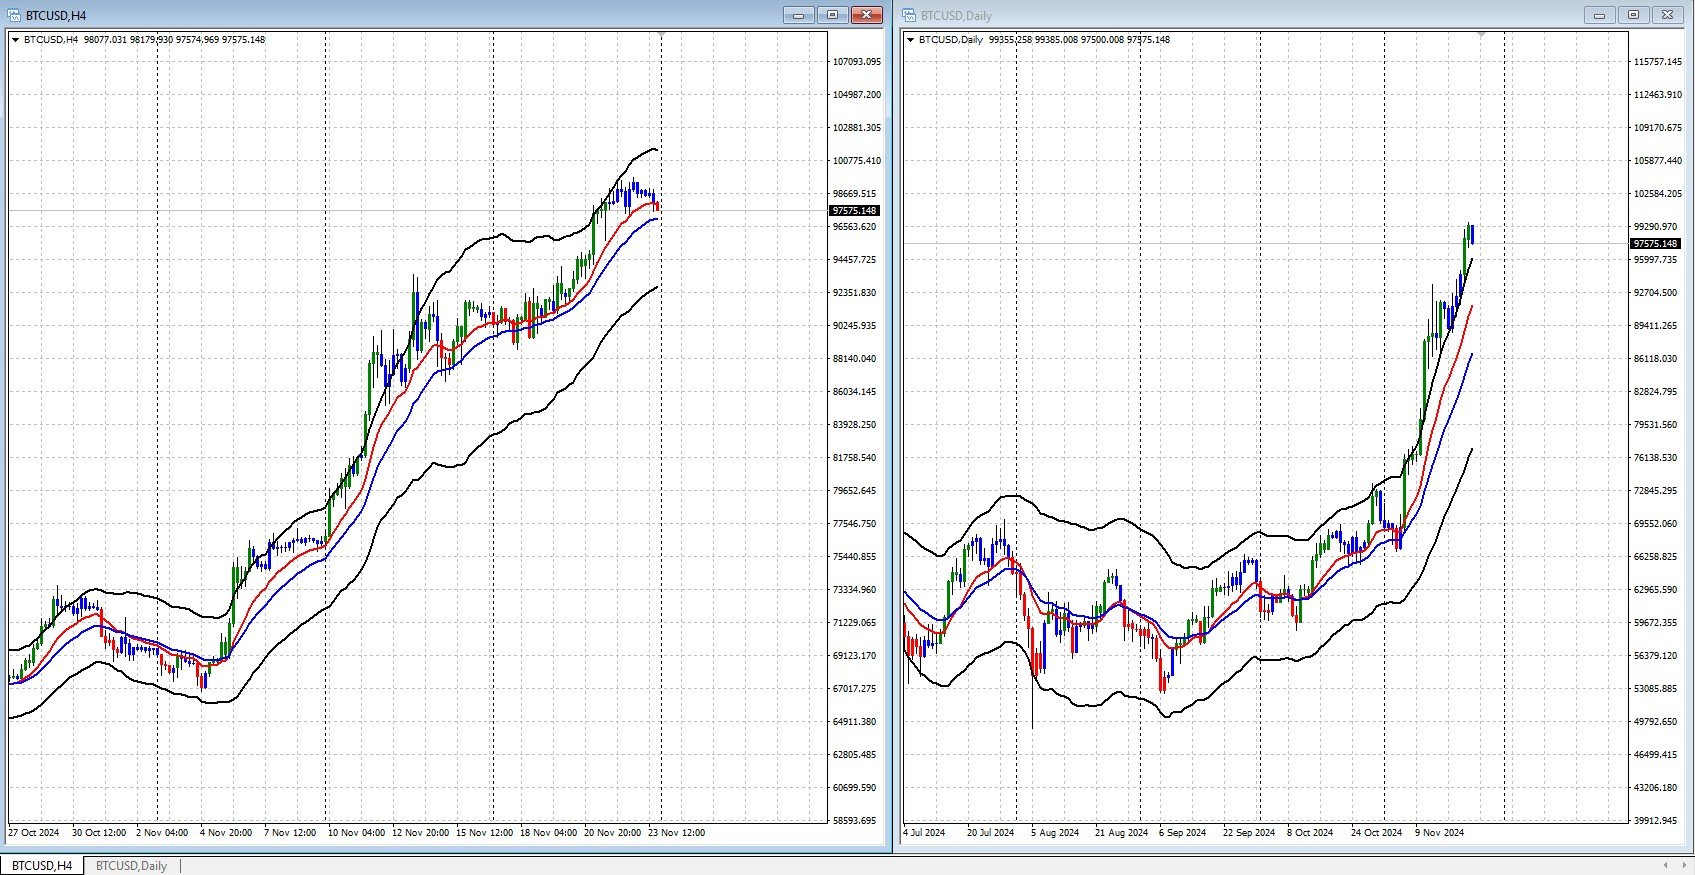
- Recommended for use on two timeframes for enhanced analysis.
- Candles are color-coded to indicate trade restrictions:
-
3x ATR Channel
- A channel based on 3 times the ATR (Average True Range) of the blue EMA.
- Recommendations:
- Avoid opening buy trades above the upper channel line.
- Avoid opening sell trades below the lower channel line.
- The channel also marks areas ideal for partial profit-taking when price approaches these levels.
This indicator integrates seamlessly with Combo OsMA, forming a unified analytical tool. However, it can also be used as a standalone indicator.
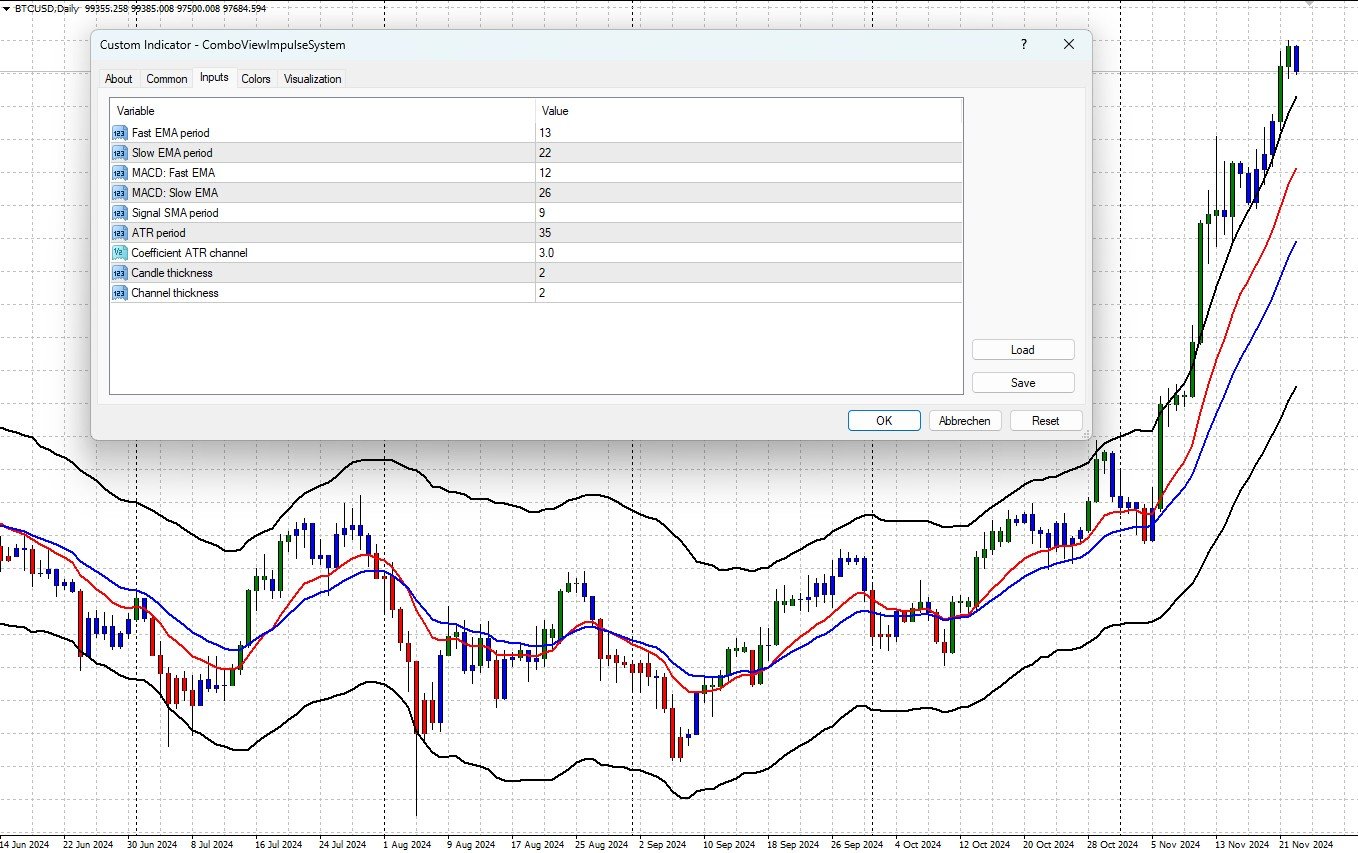
Input Parameters
- Fast EMA Period (13) – Period for the fast EMA in the value zone.
- Slow EMA Period (22) – Period for the slow EMA in the value zone.
- MACD: Fast EMA (12) – Short EMA for the MACD calculation.
- MACD: Slow EMA (26) – Long EMA for the MACD calculation.
- Signal SMA Period (9) – Smoothing period for the MACD signal line.
- Applied Price (PRICE_CLOSE) – The price used for calculations.
- ATR Period (35) – Period for ATR calculation.
- ATR Channel Coefficient (3.0) – Multiplier for defining the ATR-based channel.
- Candle thickness (2) – Thickness of the line inside the candlestick candle.
- Channel thickness (2) – Thickness of the line.