Enhanced Heiken Ashi Window Version
- Indicatori
-
David Ben Svaiter
 Sono uno sviluppatore MQL5 da molti anni, che crea soluzioni personalizzate per aziende e investitori. Ho oltre 40 anni di esperienza nella sicurezza informatica e sono uno sviluppatore di soluzioni in .NET (VB e C#), MS-SQL, SQLite, ASMx32 e x64.
 - Versione: 2.1
- Attivazioni: 5
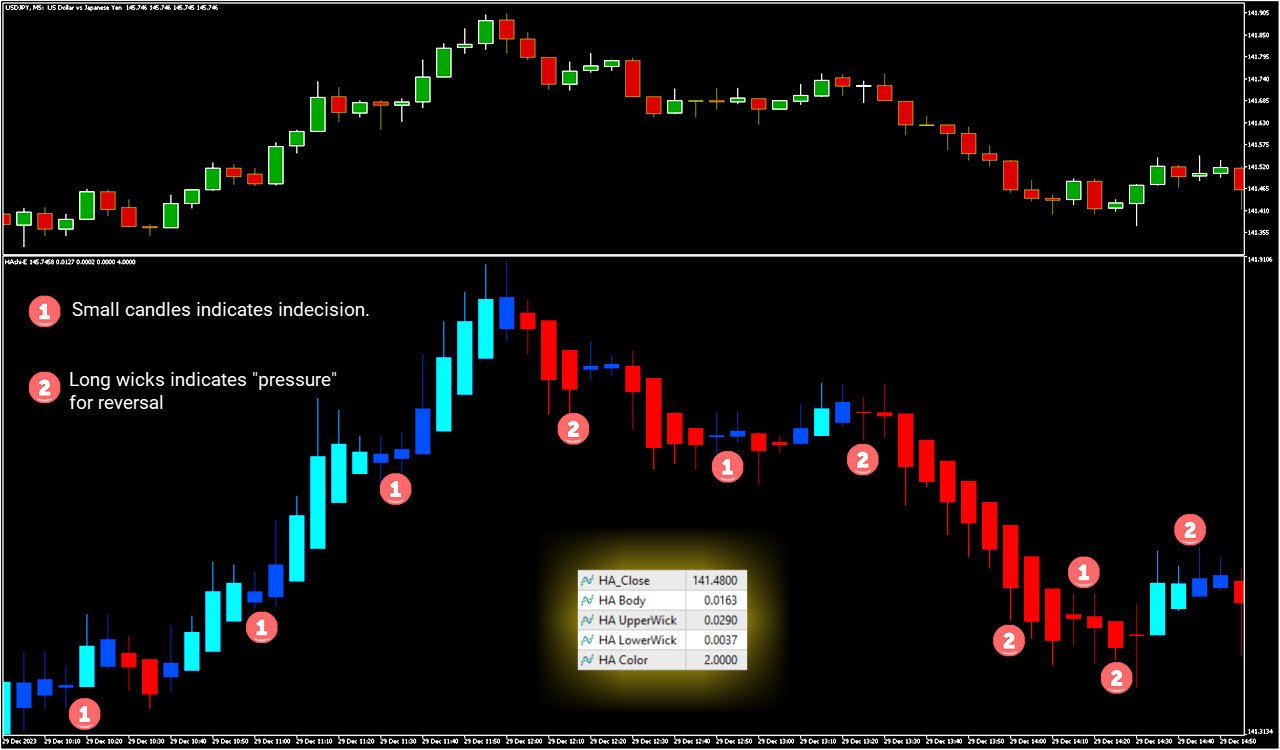
HAshi-E è un modo migliorato di analizzare i segnali Heiken-Ashi.
Briefing:
L'Heiken-Ashi è particolarmente apprezzato per la sua capacità di filtrare la volatilità a breve termine, che lo rende uno strumento privilegiato per identificare e seguire le tendenze, aiuta a prendere decisioni sui punti di entrata e di uscita e aiuta a distinguere tra falsi segnali e vere inversioni di tendenza. A differenza dei tradizionali grafici a candele, le candele Heiken-Ashi sono calcolate utilizzando i valori medi delle barre precedenti, creando una rappresentazione visiva più fluida e facilmente interpretabile.
Il suo principale vantaggio è anche il motivo per cui la maggior parte delle persone non lo legge come dovrebbe. Poiché le candele Heiken-Ashi contengono informazioni sulle medie e sono solitamente collocate davanti alle candele dell'asset, è normale che le persone siano confuse dai colori e dalle forme e che in genere entrino o escano in un momento inappropriato o tardivo.
Per questo motivo abbiamo creato HAshi-E, una visualizzazione migliorata del tradizionale indicatore Heiken-Ashi!
Caratteristiche di HAshi-E (versione a finestra separata):
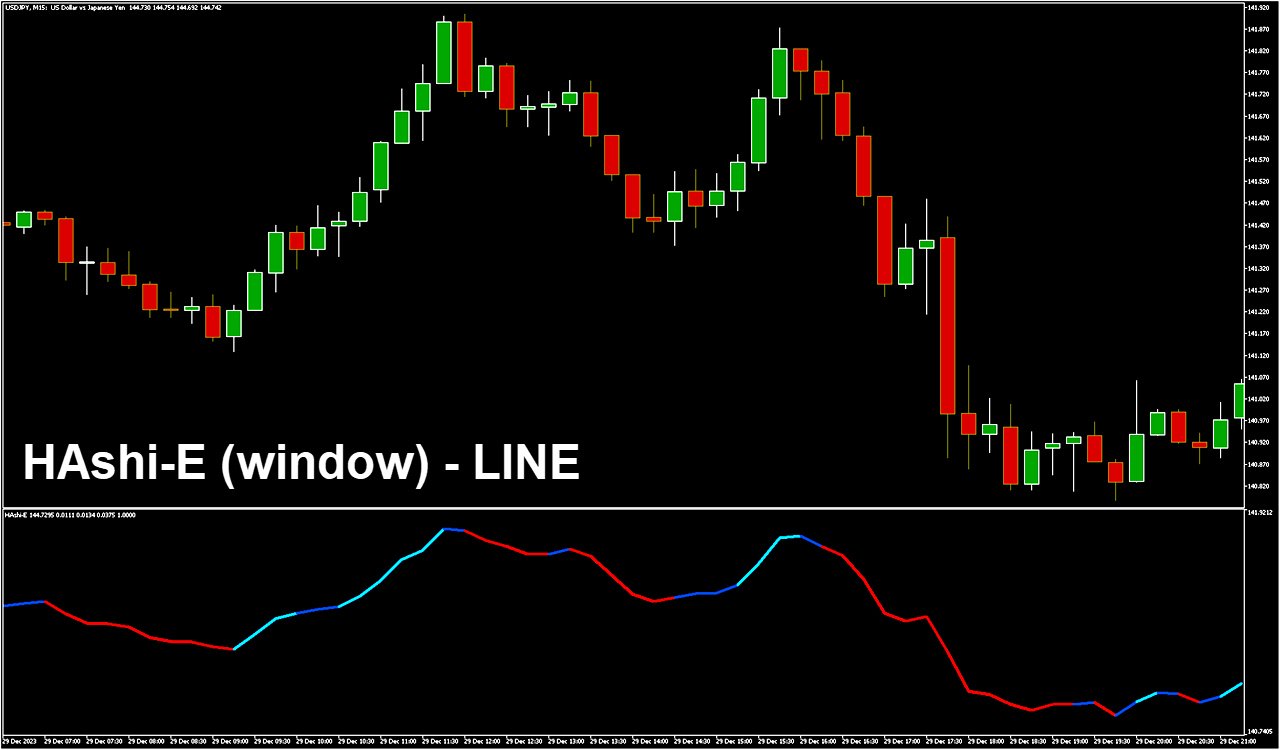
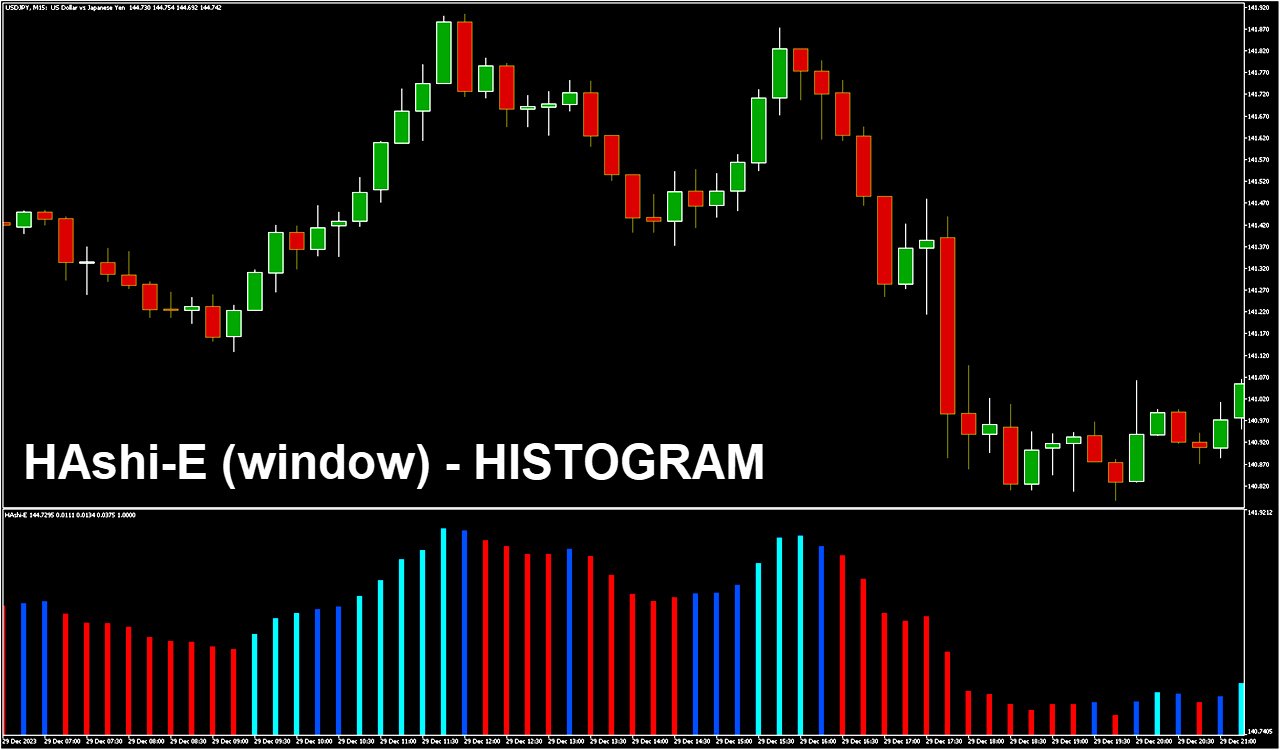
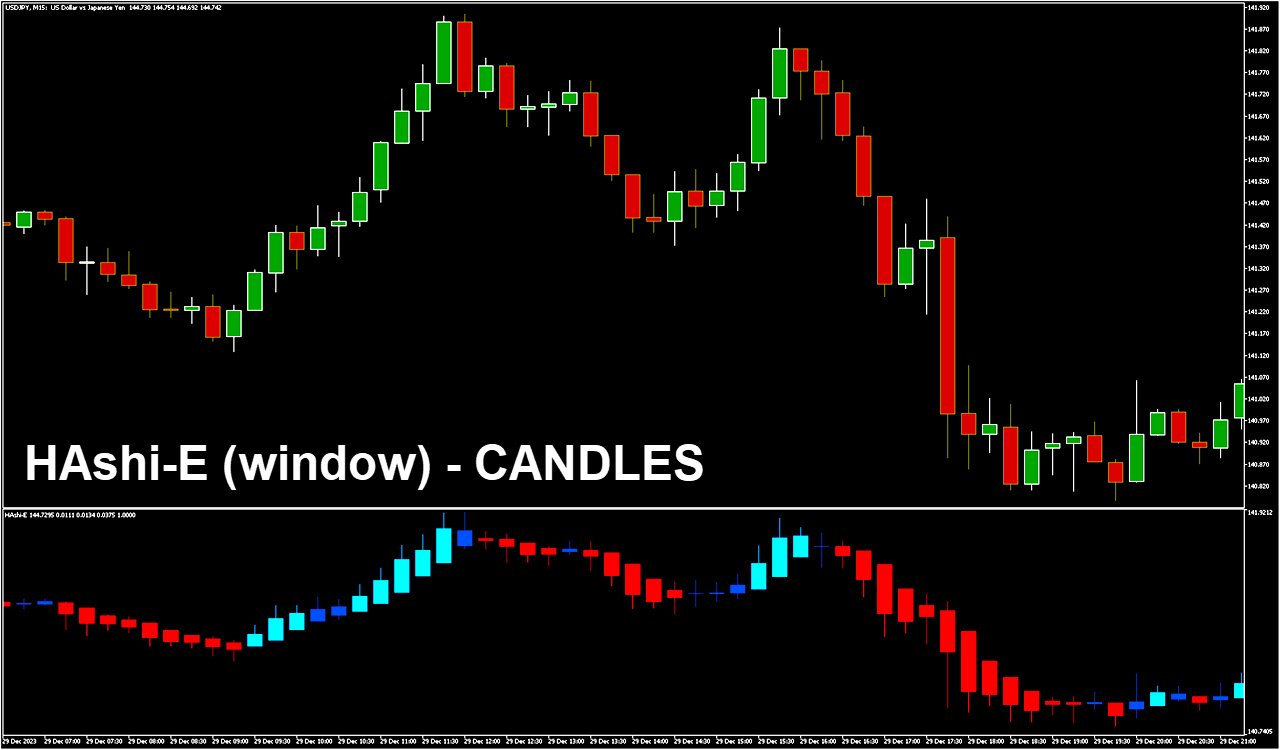
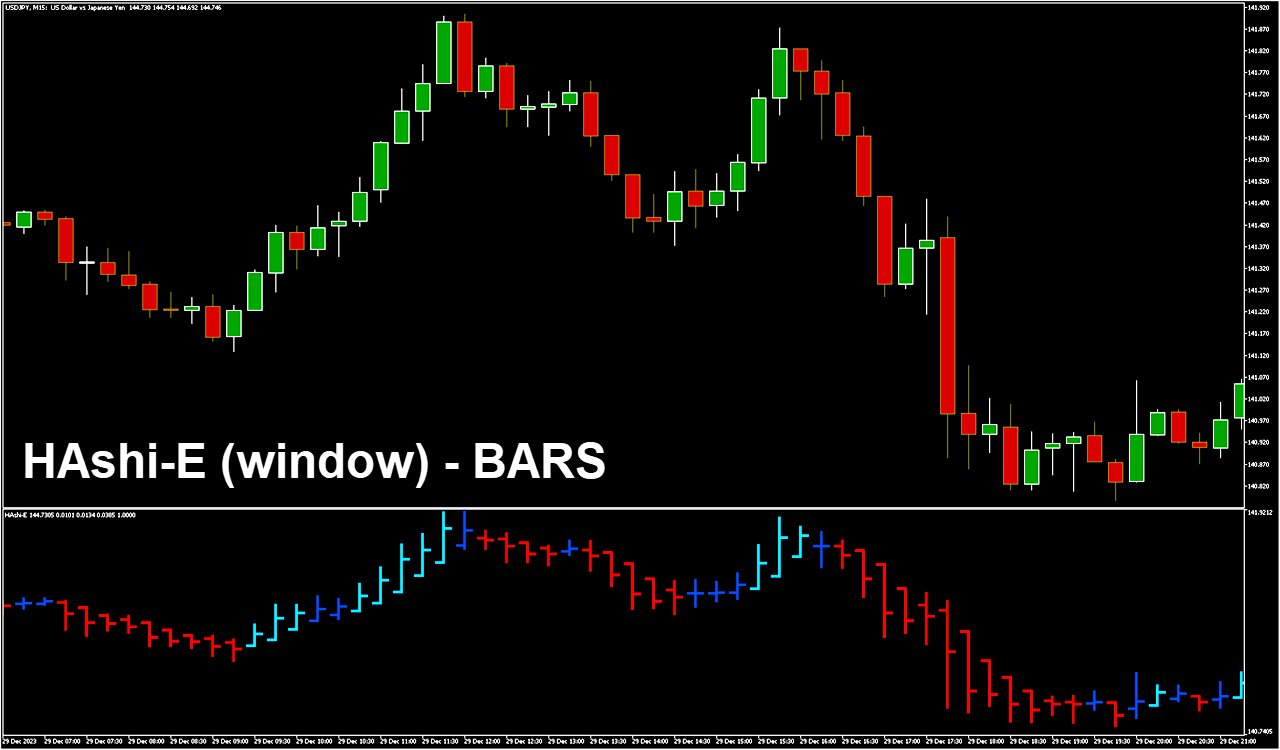
- Diverse visualizzazioni degli stessi dati: HAshi-E può tracciare non solo le tradizionali candele Heiken-Ashi, ma anche linee, istogrammi e barre.
- Colori personalizzati in modalità Heat Map: HAshi-E non si affida a due soli colori, ma a QUATTRO per fornire una sorta di mappa di calore, rendendo più facile per gli utenti individuare la forza del trend.
- Niente più candele oscurate: Molti sostengono che le candele Heiken-Ashi sono difficili da interpretare e mettono in ombra le candele originali. Con il nostro Hashi-E (versione a finestra separata), è possibile ottenere le candele colorate Heat-Map in una finestra separata per una più facile visualizzazione.
- Facile integrazione con gli Expert Advisor (EA): HAshi-E si estende al dominio degli Expert Advisor, offrendo un netto vantaggio per le strategie di trading automatizzate supportate dai tradizionali indicatori Heiken-Ashi, ovvero l'inclusione dei principali campi Heiken (corpo e stoppini), nonché del nostro campo colore che semplifica l'implementazione della strategia che fa perno sui cambiamenti di colore del trend. Questa integrazione perfetta ed efficiente migliora le capacità degli EA nell'analisi dei trend.
OBS: se preferite HASHI-E nella finestra CHART, lo troverete qui nel Mercato.