MP Candle Size for MT4
- Indicatori
- Versione: 1.10
- Aggiornato: 6 gennaio 2024

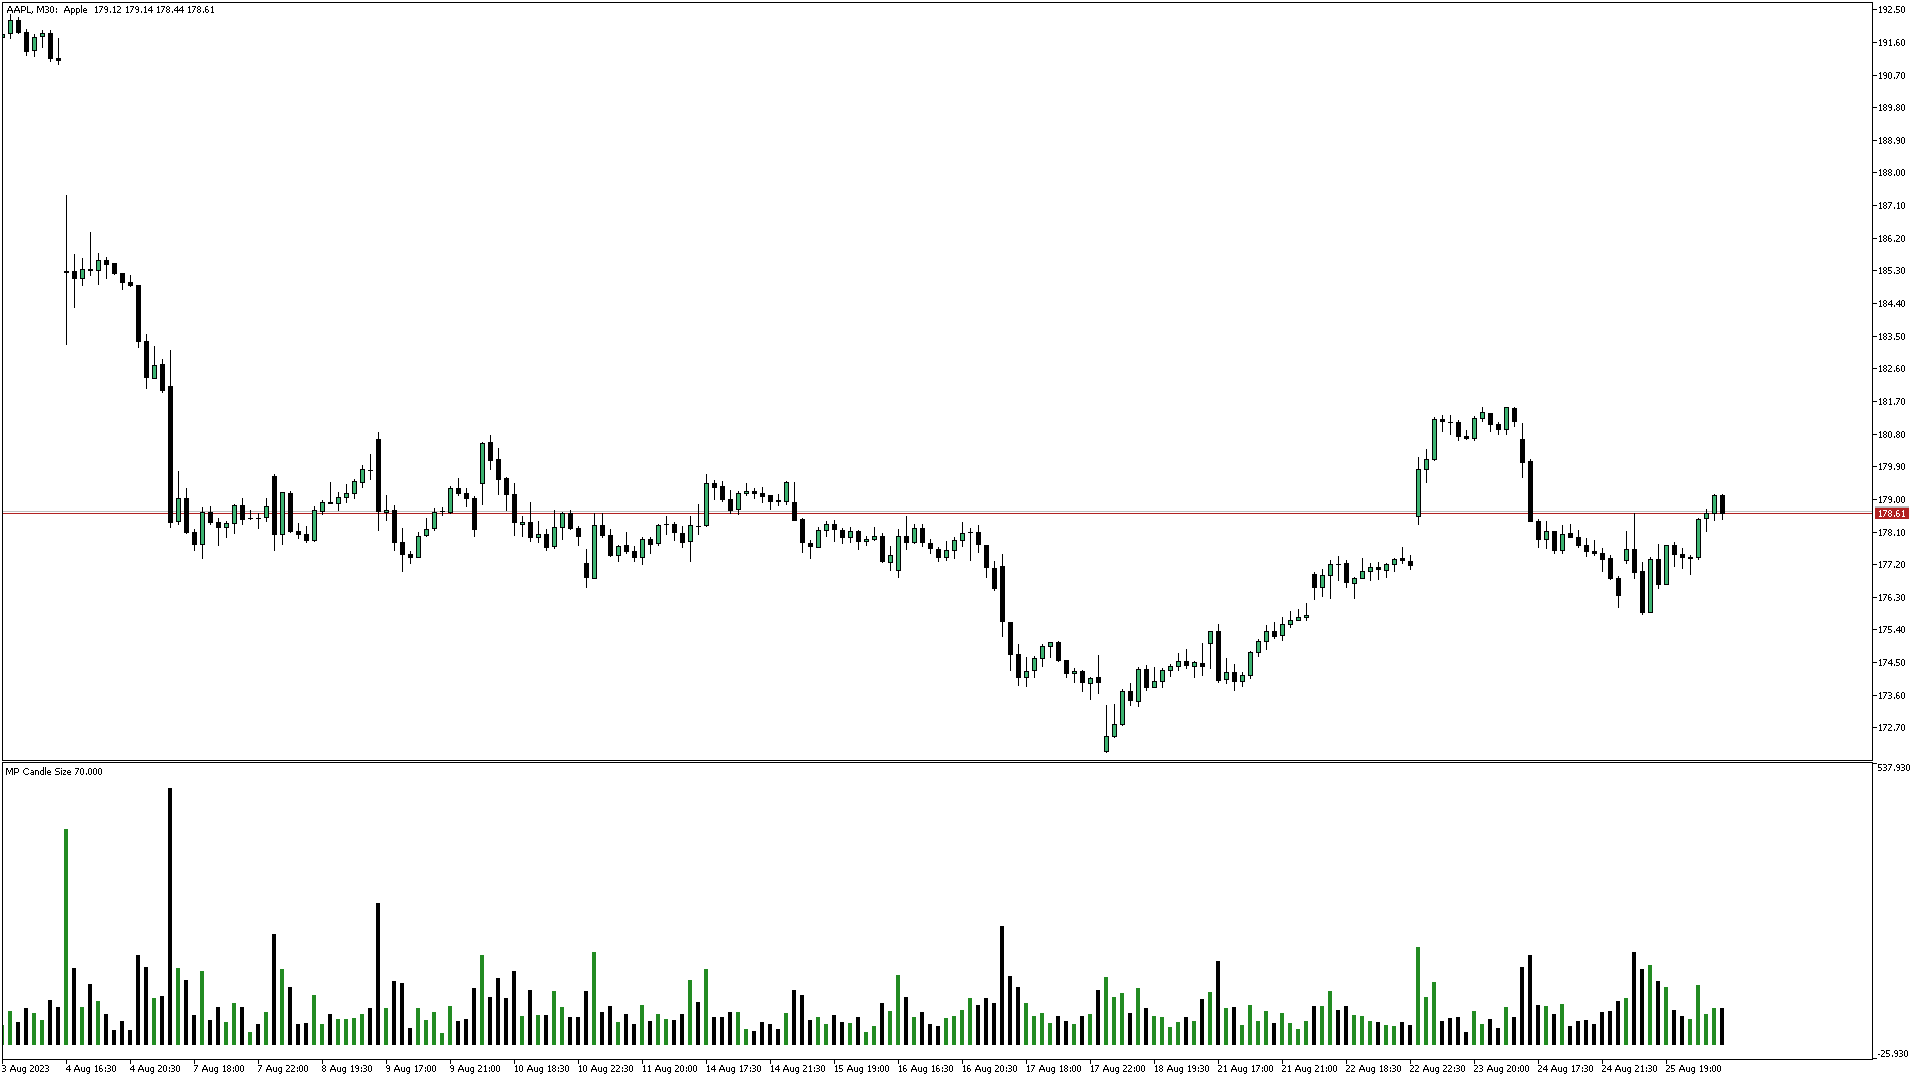
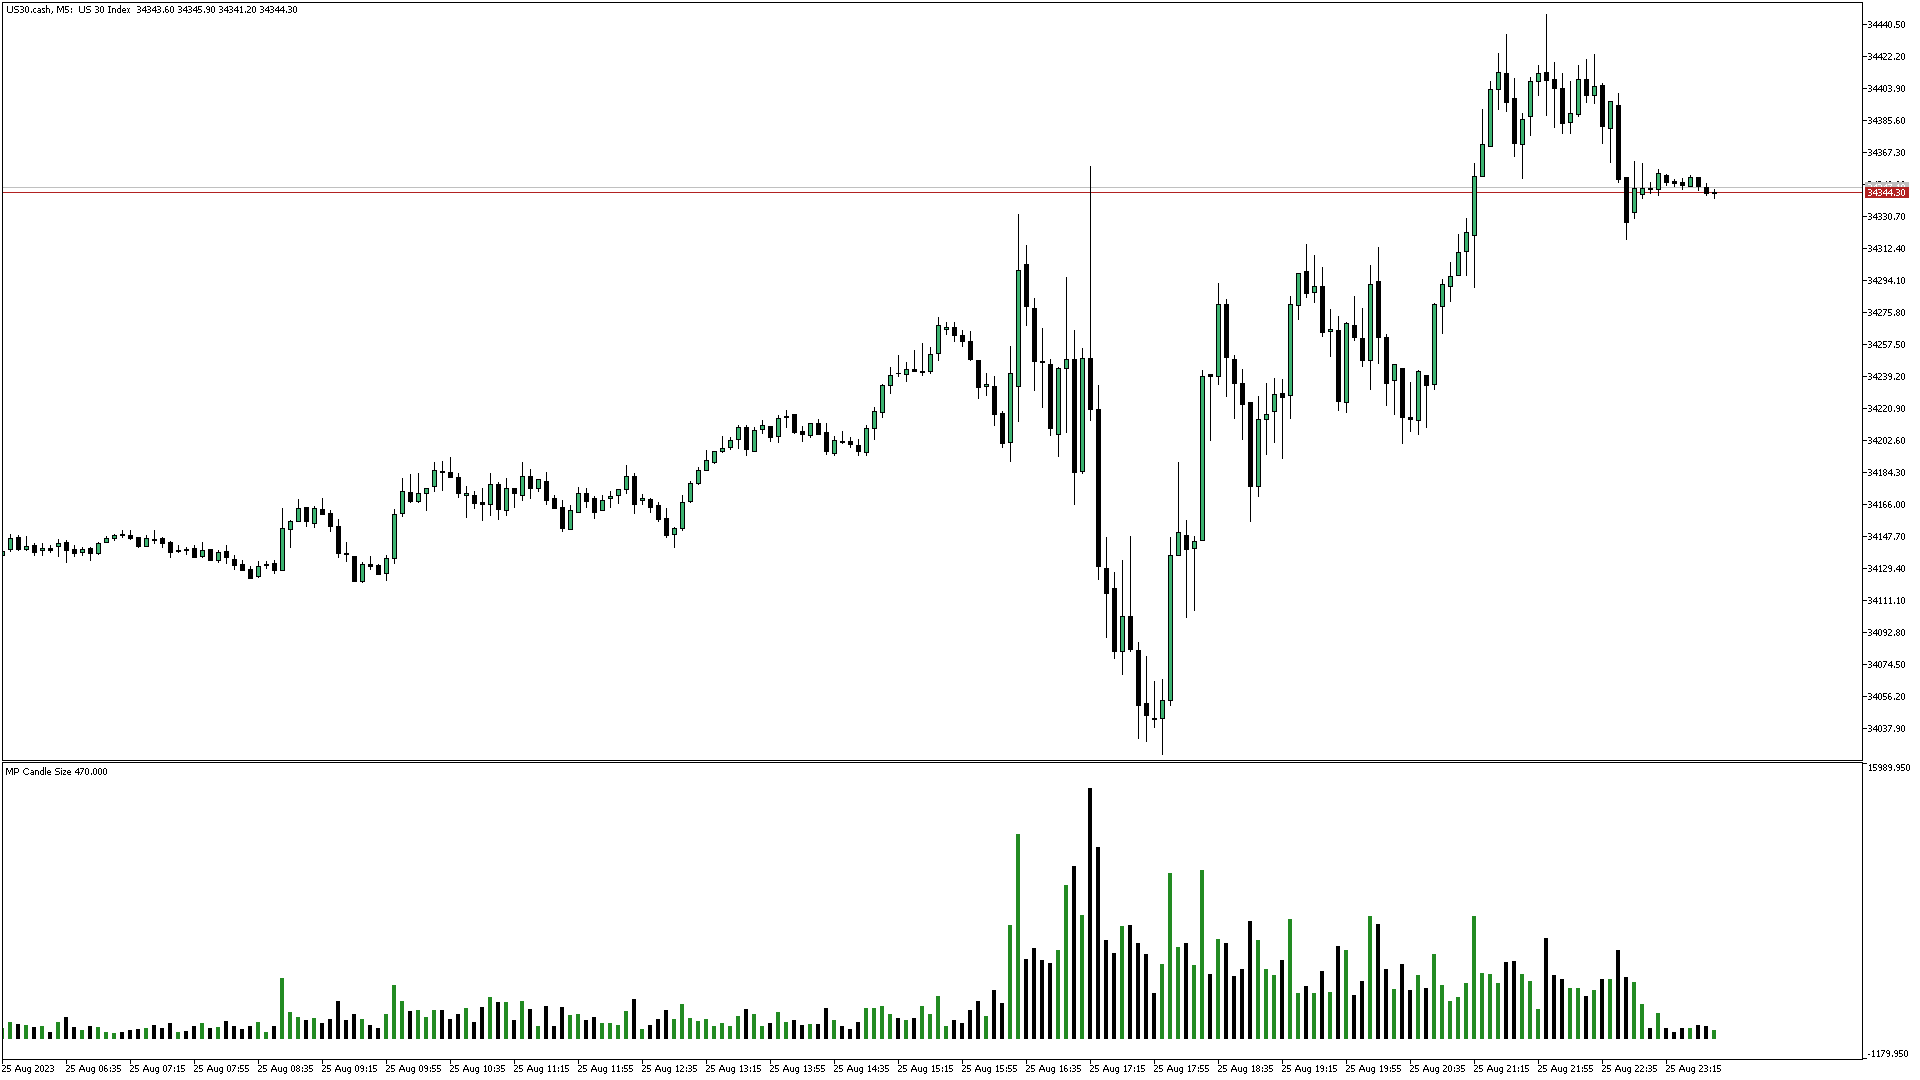
Candle size oscillator is an easy to use tool to figure out candle size from highest to lowest price of each candle. It's a powerful tool for price action analysts specifically for those who works intraday charts and also a perfect tool for short term swing traders.
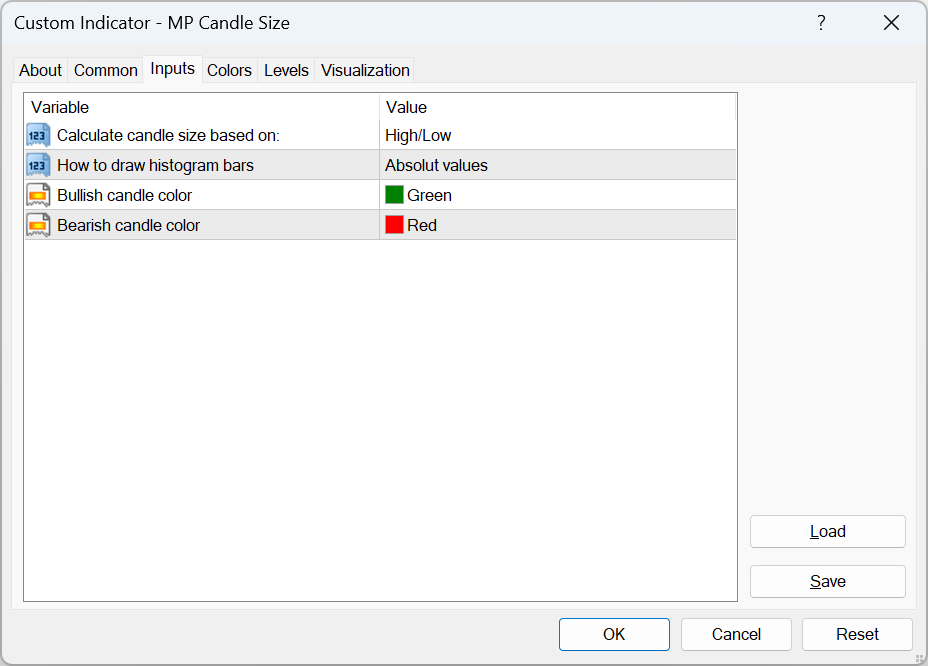
Kindly note that you can also edit the Bullish and Bearish candles with different colors.
___________________________________________________________________________________
Disclaimer:
Do NOT trade or invest based upon the analysis presented on this channel. Always do your own research and due diligence before investing or trading. I’ll never tell you what to do with your capital, trades or investments. I’ll also never recommend for you to buy, sell, long or short any asset, commodity, security, derivative or cryptocurrency related instrument as it's extremely HIGH RISK! You should always consult with a professional/licensed financial adviser before trading or investing in any type of assets.
L'utente non ha lasciato alcun commento sulla valutazione.