 MetaTrader 5
 Sistemi Esperti
 Indicatori
 Script
 Librerie
 Archiviazione
Guarda come scaricare robot di trading gratuitamente
Ci trovi su Twitter!
Unisciti alla nostra fan page
Unisciti alla nostra fan page
Ti è piaciuto lo script? Provalo nel Terminale MetaTrader 5
- Visualizzazioni:
- 28135
- Valutazioni:
- Pubblicato:
- Aggiornato:
-
 Ti stai perdendo delle opportunità di trading:
- App di trading gratuite
- Oltre 8.000 segnali per il copy trading
- Notizie economiche per esplorare i mercati finanziari
Registrazione AccediAccetti la politica del sito e le condizioni d’uso
Se non hai un account, registrati -
 Hai bisogno di un robot o indicatore basato su questo codice? Ordinalo su Freelance
Vai a Freelance
Pendulum 1_01.mq4
Copyright © BFE2006
BFE2006@yandex.ru
The Parameters of Working
- Places two starting pending orders for buying and selling (the size of the lot is calculated automatically on the basis of the deposit size and the maximum increase of leverage from 0.01 to 0.07 lots) taking into account the size of two previous daily bars (the distance between the current price, the size of trailing and pipsing)- The pending orders are "trailed" following the price until one of them has triggered.
- Pipses the triggered order by modifying the opposite order by the leverage level. Disables trailing, so the trading frontiers are defined.
- When the price reverses and an order with a leverage is opened, it places a pending order with a larger leverage in the reversed direction at the price of the first opened order, etc. (the maximum lot is increased by 2*218), creating the pendulum. The pipsing is disabled.
- Controls the gross profit and loss (automatically calculates the percentage of profits from 2% to 0.2%). Closes all orders in case of the profit presence.
Strategy Tester Report
Pendulum 1_01
iPForex-Server (Build 216)
Symbol EURUSD (Euro vs US Dollar)
Period Day (D1) 2005.01.03 00:00 - 2008.05.30 00:00 (2005.01.01 - 2008.06.01)
Model Every tick (the most precise method based on all available least timeframes)
Bars in test 1889 Ticks modelled 6589765 Modelling quality n/a
Initial deposit 700.00
Total net profit 1430.68 Gross profit 10835.78 Gross loss -9405.11
Profit factor 1.15 Expected payoff 1.01
Absolute drawdown 78.47
Maximal drawdown 530.91 (31.39%)
Relative drawdown 39.42% (422.88)
Total trades 1417 Short positions (% won) 704 (78.69%) Long positions (% won) 713 (87.10%)
Profit trades (% of total) 1175 (82.92%) Loss trades (% of total) 242 (17.08%)
Largest profit trade 617.73 loss trade -606.91
Average profit 9.22 loss trade -38.86
Maximum consecutive wins (profit in money) 27 (44.91) consecutive losses (loss in money) 1 (-606.91)
Maximum consecutive profit (count of wins) 617.73 (1) consecutive loss (count of losses) -606.91 (1)
Average consecutive wins 5 consecutive losses 1
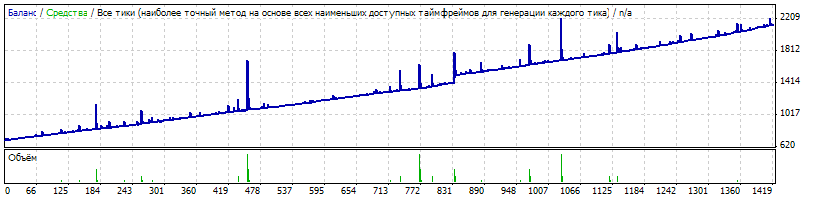
Figure 1
Symbol EURUSD (Euro vs US Dollar)
Period Day (D1) 2005.01.03 00:00 - 2008.05.30 00:00 (2005.01.01 - 2008.06.01)
Model Every tick (the most precise method based on all available least timeframes)
Initial deposit 5000.00
Total net profit 6162.48
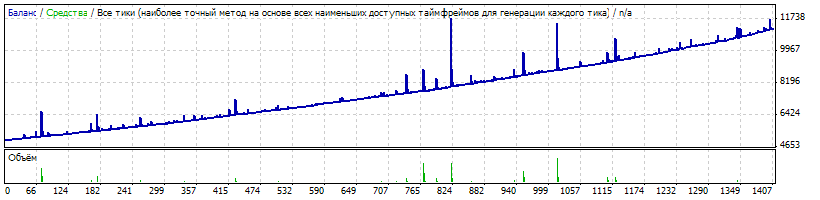
Figure 2
Tradotto dal russo da MetaQuotes Ltd.
Codice originale https://www.mql5.com/ru/code/8223
 L_Correlation
The correlation coefficient between the quotes charts of two currency pairs.
 The pattern MACD - head and shoulders. Good but on rare occasions.
A trade strategy that functions with the pattern MACD "head and shoulders"
 b-SharingDoW
The receiving of the EA testing results by the days of week.
An indicator of support and resistance levels
An indicator of support and resistance levels. The levels themselves are not calculated, as for example the pivot ones, but they are read from the text file of a specific format.