Guarda come scaricare robot di trading gratuitamente
Ci trovi su Twitter!
Unisciti alla nostra fan page
Unisciti alla nostra fan page
Ti è piaciuto lo script? Provalo nel Terminale MetaTrader 5
- Visualizzazioni:
- 26020
- Valutazioni:
- Pubblicato:
- Aggiornato:
-
Hai bisogno di un robot o indicatore basato su questo codice? Ordinalo su Freelance Vai a Freelance
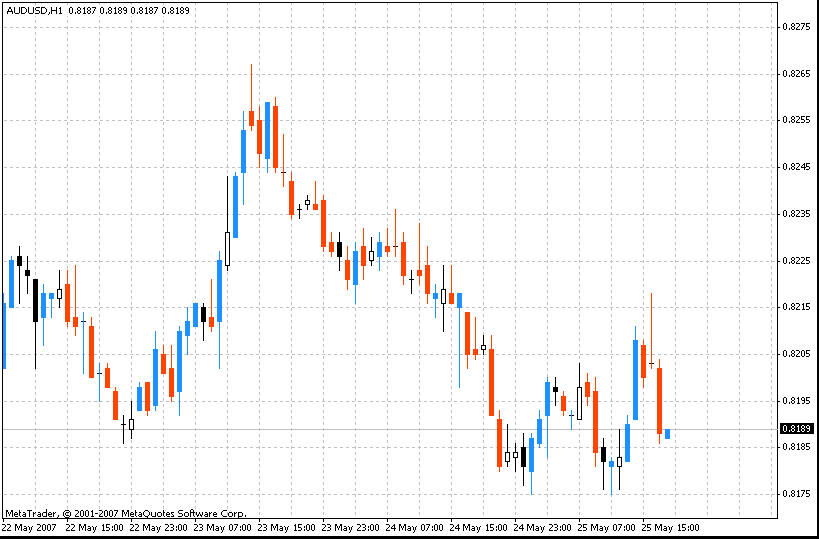
The difference between the high and low of a candle divides into three parts each one corresponding 1/3 of the candle. The indicator calculates where the candle opened and where it closed. It is recommended to hide the initial chart by setting the following parameters: option "Chart on foreground" unchecked (menu "Charts"-> "Properties" or press F8, tab "Common").
Bullish Pattern:
1-1
2-1
3-1
Bearish Pattern:
1-3
2-3
3-3

 i-HighLow
i-HighLow indicator draws the channel with borders correspond to highest high and lowest low values of the bar's shadows for the last N bars.
 i-Breakeven
i-Breakeven groups the open position by symbol and for the each of group shows: 1. The current equity level. 2. The estimated breakeven level.
 i-5days
5days indicator marks the first bar of each new day.
 FX5_Divergence
This indicator will detect divergence between the price and OsMA indicator. It will give buy or sell signal according to the type of divergence that was detected.