Guarda come scaricare robot di trading gratuitamente
Ci trovi su Twitter!
Unisciti alla nostra fan page
Unisciti alla nostra fan page
Ti è piaciuto lo script? Provalo nel Terminale MetaTrader 5
- Visualizzazioni:
- 33366
- Valutazioni:
- Pubblicato:
- Aggiornato:
-
Hai bisogno di un robot o indicatore basato su questo codice? Ordinalo su Freelance Vai a Freelance
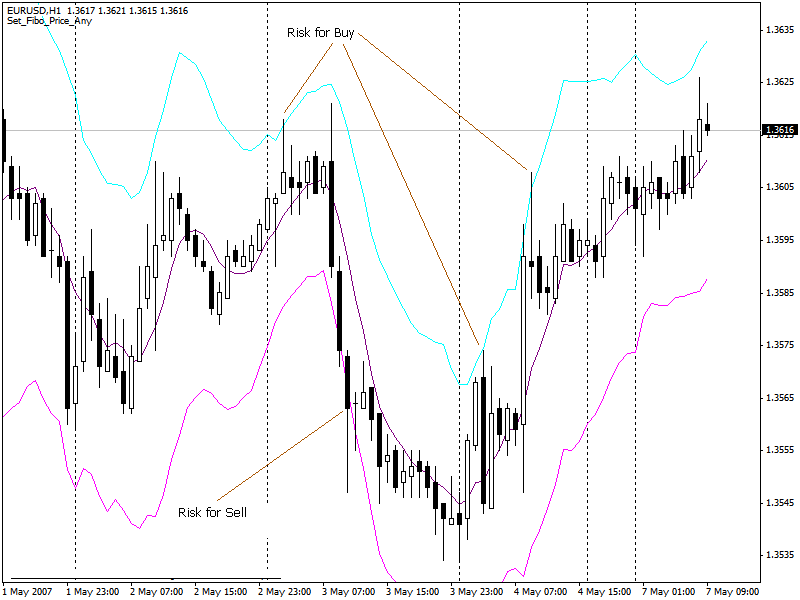
Developed by Manning Stoller in the early 1980s, the bands will contract and expand depending on the fluctuations in the average true range component.
STARC (or Stoller Average Range Channels) bands are calculated to incorporate market volatility.
The original Stoller formula is:
Upper Band: SMA(6) + 2 * ATR(15)
Lower Band: SMA(6) - 2 * ATR(15)
The function of Starc Bands is different than other Bands based indicators.
If price action rises to upper band there is a high risk to buy and a lower risk to sell. As inverse, if price action rises to lower band there is a high risk to sell and a lower risk to buy.

 Waddah Attar Weekly CAMERILLA
This Indicatro Draw Weekly CAMERILLA Levels H1 H2 H3 H4 L1 L2 L3 L4 with back test.
 Waddah Attar Dayly CAMERILLA
This Indicator Draw Dayly CAMERILLA Levels H1 H2 H3 H4 L1 L2 L3 L4 with back test.
 Disparity Index
Disparity Index indicator is a percentage display of the latest close to a chosen moving average. For more in depth interpretation of the Disparity Index refer to Steve Nison's book "Beyond Candlesticks".
 Waddah Attar RSI Level
You never see like this indicator before. This indicator draw Dayly RSI Level on your chart like CAMERILLA and Pivot. The levels is very powerful and very matchful. Try it quickly.