 MetaTrader 5
 Sistemi Esperti
 Indicatori
 Script
 Librerie
 Archiviazione
Guarda come scaricare robot di trading gratuitamente
Ci trovi su Facebook!
Unisciti alla nostra fan page
Unisciti alla nostra fan page
Ti è piaciuto lo script? Provalo nel Terminale MetaTrader 5

Volatility Quality Stridsman (histo) - indicatore per MetaTrader 5

- Visualizzazioni:
- 11679
- Valutazioni:
- Pubblicato:
- Aggiornato:
-
 Ti stai perdendo delle opportunità di trading:
- App di trading gratuite
- Oltre 8.000 segnali per il copy trading
- Notizie economiche per esplorare i mercati finanziari
Registrazione AccediAccetti la politica del sito e le condizioni d’uso
Se non hai un account, registrati -
 Hai bisogno di un robot o indicatore basato su questo codice? Ordinalo su Freelance
Vai a Freelance
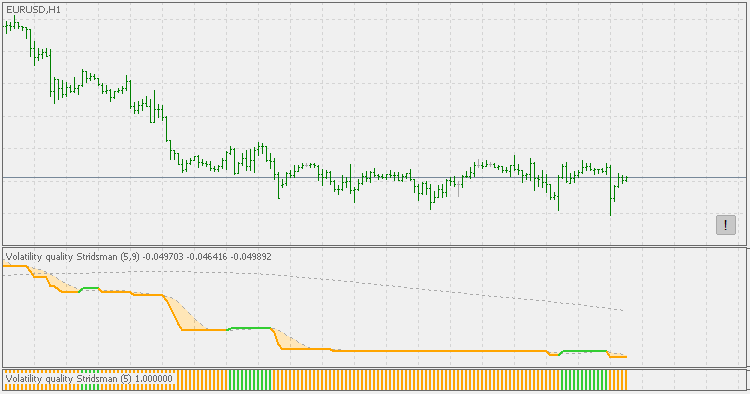
Volatility quality Stridsman indicator (Thomas Stridsman is the inventor of that indicator, and this version is coded the way how original version is, not like some variations that are commonly used) — histogram version.
This version, unlike the "regular" version, plots only 1 value:
- a histogram that is indicating the short term direction of the VQ slope
Smoother std adaptive
Smoother - standard deviations adaptive.
Averages rainbow
Plotting up to 256 averages on chart.
Volatility Quality Stridsman
Volatility quality Stridsman.
High and Low Custom levels
High and Low. For levels, you can specify an offset. You can specify the interval (PERIOD_D1) on which to search for levels.