Unisciti alla nostra fan page
- Visualizzazioni:
- 21171
- Valutazioni:
- Pubblicato:
- Aggiornato:
-
Hai bisogno di un robot o indicatore basato su questo codice? Ordinalo su Freelance Vai a Freelance
Real author:
Maks aka ug
The indicator uses the construction method described by Vladislav Antonov (for those who read his session reviews on Viac or Alpari). Here is a small excerpt from his method:
No need to explain the meaning of resistance and support. There are many methods to determine price levels, but I use my calculations. Dynamic levels of support/resistance are defined using MA lines, and statistic lines are calculated using the higher timeframe.
- To calculate intraday levels for one hour, use High, Low and Close of the previous hour candlestick.
- To calculate intraday levels for one day, use High, Low and Close of the previous one day candlestick.
- To calculate intraday levels for one week, use High, Low and Close of the previous one week candlestick.
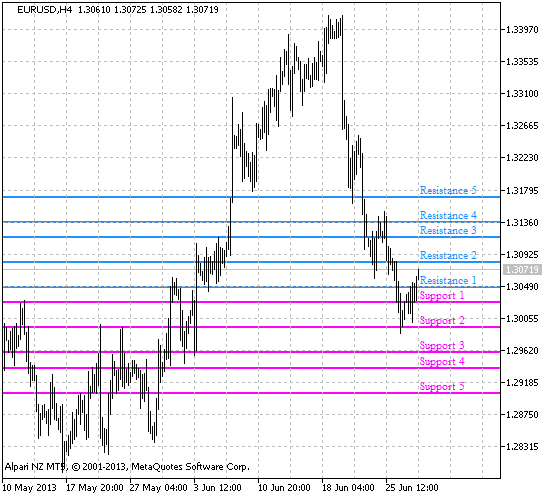
In this review I calculate support and resistance levels using the daily candlestick of the previous day. Thus, the price levels will be valid for the entire day, and the next day they should be recalculated. Example. For example, take daily candle 02.11.06: High = 1.2786 Low = 1.2736 Close = 1.2780. We get the levels for the current day, and use them on all charts smaller than the daily timeframe. The next day, new levels are calculated.
There are 3 methods of calculation, depending on the size of the previous candlestick:
- Reduced - support and resistance levels for the weak market. If the market has closed with a large candlestick of more than 200 points, it is better to use this calculation as a correction is expected and the market will be weak;
- Normal - support and resistance levels for the medium volatility of the market. Day candlesticks from 100 to 200 points. Normal works well during the formation of a steady growth or decline, and candlesticks are of a similar size;
- Extended - support and resistance levels for a strong market. When the market movement gets confined to a triangle and becomes weak, we expect that there will be a strong move, and use the levels with the extended price range.
To decide which method of calculation to use, you should do your own research and gather the statistics of the levels. As to me, I don't keep up with the items described above (this is averagely for the pound). So far, I choose methods guided by my intuition and by the expected price pattern
If you want to read more: http://www.viac.ru/ds/21950.
This indicator was first implemented in MQL4 and published in Code Base at mql4.com on 24.02.2008.

Figure 1. The Levels indicator.
Tradotto dal russo da MetaQuotes Ltd.
Codice originale https://www.mql5.com/ru/code/1794
 ImpulseOsMA
The indicator draws bars based on Elder's impulse system.
 Relative Momentum Index (RMI)
The RMI (Relative Momentum Index) indicator is an improved version of RSI, momentum is included in the calculation.
 Three Screen Elder Arrows
An indicator in the form of arrows on the basis of Elder's trading system.
 Visual Аnalysis AfterTesting
Easier visual analysis of graphical objects created by the strategy tester.