 MetaTrader 5
 Sistemi Esperti
 Indicatori
 Script
 Librerie
 Archiviazione
Guarda come scaricare robot di trading gratuitamente
Ci trovi su Twitter!
Unisciti alla nostra fan page
Unisciti alla nostra fan page
Ti è piaciuto lo script? Provalo nel Terminale MetaTrader 5

FigureBuilder - indicatore per MetaTrader 5

- Visualizzazioni:
- 11228
- Valutazioni:
- Pubblicato:
- Aggiornato:
-
 Ti stai perdendo delle opportunità di trading:
- App di trading gratuite
- Oltre 8.000 segnali per il copy trading
- Notizie economiche per esplorare i mercati finanziari
Registrazione AccediAccetti la politica del sito e le condizioni d’uso
Se non hai un account, registrati -
 Hai bisogno di un robot o indicatore basato su questo codice? Ordinalo su Freelance
Vai a Freelance
The tool draws a shape based on a number of points added to a chart. Press and hold Ctrl and left-click on a chart to add a point. Once the 'Dots Max Number' points is added to chart, the program plots a shape.
All commands:
- Ctrl + Left Click - add a point on the chart.
- Ctrl + Backspace - undo the last action.
- Ctrl + Delete - delete all graphical objects from the chart. The command deletes all graphical objects with the names starting with the characters specified in 'Objects prefix name'. The prefix can be specified as 'name' or 'name*' – the two ways work the same.
Settings
- Objects prefix name - the prefix, based on which all objects whose name start with the specified set of characters will be deleted. The prefix can be specified as 'name' or 'name*' – the two ways work the same. If an empty string is specified here, 'Figure' will be used as the prefix.
The "Dot" Block
- Dots Max Number - number of points; once they are added, the program will draw a shape.
- Empty Dot Code - the code of an empty point.
- Empty Dot Width - the width of an empty point.
- Filled Dot Code - point code of a drawn shape.
- Filled Dot Width - the width of a point of the drawn shape.
The "Line" Block
- First Dot Line Left Ray - drawing the line on the first point as a ray to the left.
- Last Dot Line Right Ray - drawing the line on the last point as a ray to the right.
- Lines color - the color of the shape lines.
- Lines Style - the style of the shape lines.
- Lines Width - the width of the shape lines.
Examples
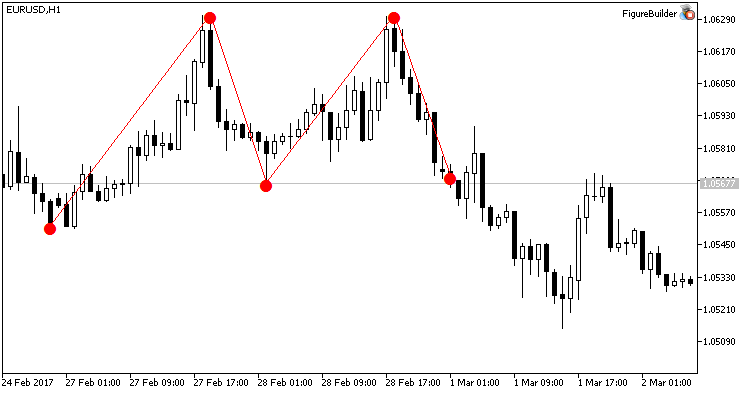
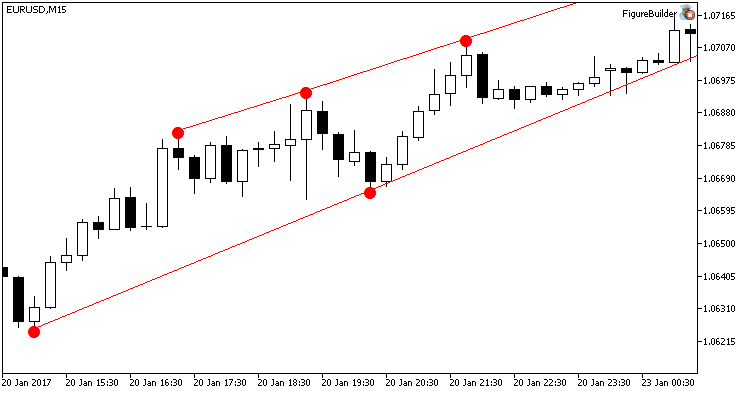
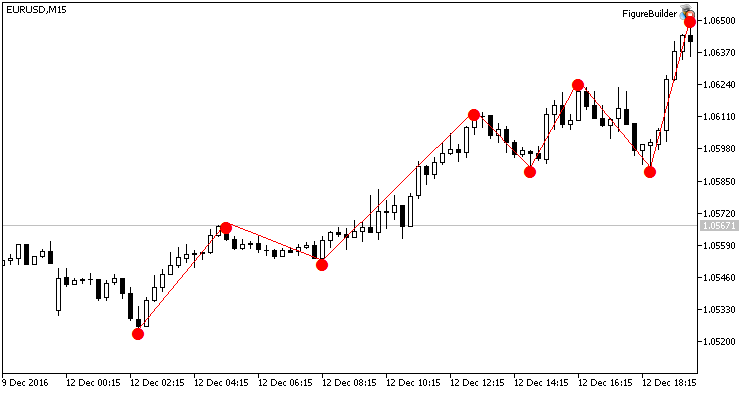
Tradotto dal russo da MetaQuotes Ltd.
Codice originale https://www.mql5.com/ru/code/17671
 Exp_CGOscillator_X2
The Exp_CGOscillator_X2 trend trading system based on the signals from two CGOscillator indicators.
ColorSTD_Histogram
The smoothed Simple Trend Detector with the color indication of overbought/oversold level breakouts and of the histogram direction.
ThreeCandles
The ThreeCandles indicator, which features alerts, sends emails and push notifications.
KhaosAssault_HTF
The KhaosAssault indicator with the timeframe selection option available in input parameters