Unisciti alla nostra fan page

Bollinger Band Width calculation with Neural Network using - sistema esperto per MetaTrader 5

- Visualizzazioni:
- 35209
- Valutazioni:
- Pubblicato:
- Aggiornato:
-
 Ti stai perdendo delle opportunità di trading:
- App di trading gratuite
- Oltre 8.000 segnali per il copy trading
- Notizie economiche per esplorare i mercati finanziari
Registrazione AccediAccetti la politica del sito e le condizioni d’uso
Se non hai un account, registrati -
 Hai bisogno di un robot o indicatore basato su questo codice? Ordinalo su Freelance
Vai a Freelance
Hai bisogno di un robot o indicatore basato su questo codice? Ordinalo su Freelance
Vai a Freelance
I have been searching for a BB Width Expert Advisor, but I couldn't find it anywhere. Then I decided to create my own, and as a part of my studies I did this. This Expert Advisor follows Neural Network method.
Test Result:
- Initial Deposit 10000.
- Gross Profit of 36000.
- Time span 3.5 months.
What is Bollinger Band Width?
Bollinger Band Width is band formation in Bollinger Bands. In his book ("Bollinger on Bollinger Bands"), John Bollinger refers to Bollinger Band Width as one of two indicators that can be derived from Bollinger Bands. The other indicator is %B.
BandWidth measures the percentage difference between the upper band and the lower band. BandWidth decreases as Bollinger Bands narrow and increases as Bollinger Bands widen. Because Bollinger Bands are based on the standard deviation, falling BandWidth reflects decreasing volatility and rising BandWidth reflects increasing volatility.
Important Patterns!
- Narrowness: Narrow BandWidth is relative. BandWidth values should be gauged relative to prior BandWidth values over a period of time. It is important to get a good look-back period to define BandWidth range for a particular Symbol.
- The Squeeze: Bollinger BandWidth is best known for identifying the Squeeze. This occurs when volatility falls to a very low level, as evidenced by the narrowing bands. The upper and lower bands are based on the standard deviation, which is a measure of volatility. The bands narrow as price flattens or moves within a relatively narrow range. The theory is that periods of low volatility are followed by periods of high volatility. Relatively narrow BandWidth (a.k.a. the Squeeze) can foreshadow a significant advance or decline. After a Squeeze, a price surge and subsequent band break signal the start of a new move. A new advance starts with a Squeeze and subsequent break above the upper band. A new decline starts with a Squeeze and subsequent break below the lower band.
"An Idea Can Change Your Life" ;-)
I got the inspiration to work on Neural Networks after Reading this article. The author Fyords helped me a lot at the finishing part of coding. This Expert Advisor takes the value of last 14 periods and minimizes it with the Neural Network method formula (please read the article for the best implementation of Neural Network).
Width Calculation I have used the classical method: (BBupperBand - BBLlowerBand) / BBMidleBand. Formula:
inputs[i*2]=(((iBands_Upperbuf[i] - iBands_Lowerbuf[i]) / iBands_Basebuf[i]) - (x_min+x_minn) * (d2-d1)) / ((x_maxx+x_max) - (x_min+x_minn)) + d1;
It looks complicating but in reality it is just like A, B, C, D... The above article can help you a lot.
Expert Advisor test result is good, I have taken the period from 2013.01.01 to 2013.04.13. Balance:
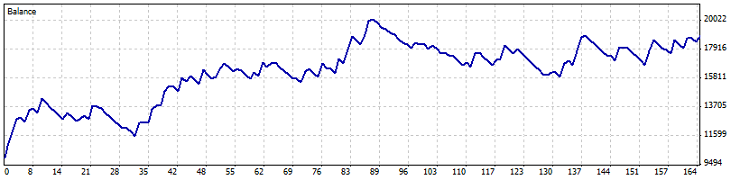
I have attached the complete test result in the zip file.
Recommendations:
- I don't recommend to use this Expert Advisor in real account.
- In the same code you can use some volume indicator combination (CCI, MFI etc.).
Thank You,
Suresh B. Kakkattil,
Kerala, India.
 MorningFlat
This indicator displays the levels of the "morning flat" and shows possible targets
Exp_QQECloud
Trading system using the Exp_QQECloud trend indicator.