Unisciti alla nostra fan page
- Pubblicati da::
-
Olexiy Polyakov
 I am a regular trader who trades hands in the futures market, as they do not believe in the possibility of profitable fully automated trading
 - Visualizzazioni:
- 112941
- Valutazioni:
- Pubblicato:
- Aggiornato:
-
 Ti stai perdendo delle opportunità di trading:
- App di trading gratuite
- Oltre 8.000 segnali per il copy trading
- Notizie economiche per esplorare i mercati finanziari
Registrazione AccediAccetti la politica del sito e le condizioni d’uso
Se non hai un account, registrati -
 Hai bisogno di un robot o indicatore basato su questo codice? Ordinalo su Freelance
Vai a Freelance
Hai bisogno di un robot o indicatore basato su questo codice? Ordinalo su Freelance
Vai a Freelance
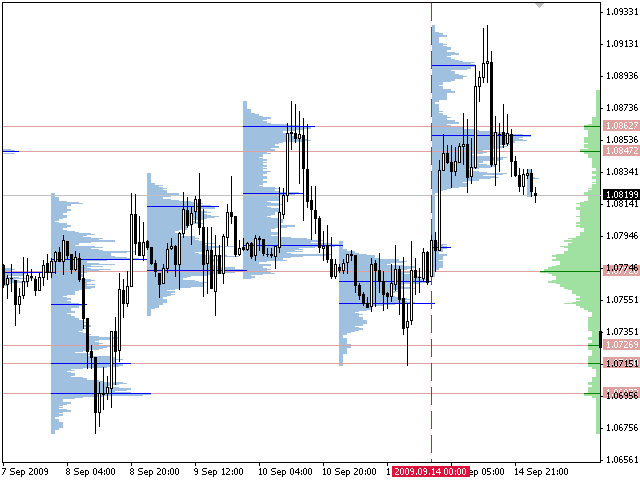
Volume Profile + Range v6.0 (former TPO). Distribution of deals by price levels at a given time interval. Displayed as a histogram. The width of the histogram at the level means the number of transactions carried out on it.
If a broker provides data on a real volume, the indicator is able to display distribution on it as well.
Key features:
- VP: display distributions with a step equal to standard periods
- VP-Range: display distributions for any selected period using various methods of setting the calculation boundaries
- configuring displayed data (histogram, modes, maximum)
- ability to launch several indicators on a single chart
VP divides the chart into intervals (equal by time) displaying distribution for each of them. The ranges can be equal only to standard timeframe values not lower than the current one. For example, for H1, the range can be specified as H1, H4, D1, W1, MN1. MT5 features intermediate timeframes.
VP-Range works only by a single range. The boundaries can be specified by one of the following ways:
- arbitrarily by vertical lines
- using the number of the last chart minutes
- setting the right border and number of minutes to it
When specifying the borders by lines, the bar of the right border is not considered in the calculations. This is done in order to prevent source data and distribution type from changing when switching timeframes.
Bars from higher timeframes may contain less bars from lower ones compared to our expectations. This occurs due to natural gaps in quote history caused by low liquidity and operation interruptions. Therefore, if we make the indicator show a week before a bar, the time of the left boundary may not coincide with the time of the right one. In different dealing centers, the data may be different but the result turns out to be similar due to a large amount of applied data.
Calculation method
The calculation method is summing the number of deals performed at a certain price. Alternatively, the volumes at a certain price can be summed if the real volume type is set in the parameters.
The trade data is interpolated based on the most accurate terminal data available (М1 timeframe data). Each bar is divided into several trades based on the estimated price movement inside the bar. This is a distinguishing feature of the product setting it apart from other ones that have no interpolation and use the timeframe the indicator is launched at.
A further accuracy improvement without the use of additional sources could have been reached due to more reliable interpolation of M1 data to ticks. But almost every broker using MetaTrader 4 has its own quote flow making such improvements practically useless. Tests show that distributions look almost similar at all brokers. Used methods provide results comparable to distributions received using the most accurate data.
Distributions maximums (modes) are usually used as support/resistance levels. There is no point in searching for a maximum mode when determining a good level due to a "shading problem" - the next price cluster greatly affects the previous one sometimes hiding it completely, and vice versa. Study the chart carefully and specify the levels by constructing distributions on the most interesting segments with the help of VP-Range. Distributions at a bigger range may have greater weight.
The version 6.0 features the ability to specify a data source timeframe. MetaTrader 5 also provides the ability to use ticks provided by a broker. See "Data source" parameter.
Installation
Open the terminal settings (Tools\Options). Set the maximum number of bars depending on how you will use the indicator on the Charts tab. Each day is 1440 minutes (not more than 1440 minute bars). For example, if "Max bars in chart" is 250000, the indicator will be able to receive data for 250000/1440=173 working days in case M1 timeframe data is available for them. The value of 65000 provides data for 45 working days (two months and a couple of days).
Setting the number of bars
Restart the terminal after changing the parameters. In case a large value is specified for "Max bars in chart" parameter, the terminal may significantly slow down and require more memory even without the indicators. Please keep in mind that not all dealing centers provide deep chart history.
Installing the indicator:
- close the terminal
- download the archive with the indicators and unzip it
- copy the indicator files (*.mq4 or *.mq5) to the indicator folder of your terminal. The working folder can be seen in the journal when launching the terminal
- launch the terminal
VP and VP-Range general parameters
| Parameter | Description |
|---|---|
| Mode step (points) | The minimum step between the modes (selected subjectively for each symbol). |
| Point scale | Point scale when drawing the histogram. The greater the value, the faster the operation but the more rough the display. |
| Volume type | Volume type (tick or real). If a broker does not provide real volume, the indicator will show nothing. |
| Data source | Data source:
|
| Bar style | Histogram bar style:
|
| Color 1 | Histogram color 1. Set to None to use a chart background color. |
| Color 2 | Histogram color 2. Set to None to use a chart background color. |
| Line width | Line width when drawing a histogram. |
| Mode color (None=disable) | Local maximum color (distribution mode). Set None to disable. |
| Maximum color (None=disable) | Maximum color. Set None to disable. |
| Median color (None=disable) | Median color. Set None to disable. |
| VWAP color (None=disable) | VWAP color (average weighted by price volume). Set None to disable. |
| Mode line width | Mode line width. |
| Median & VWAP line style | Style of median lines and VWAP. |
| Identifier | Indicator ID, use different values for several indicator instances on a single chart. |
VP parameters
| Parameter | Description |
|---|---|
| Range period | Timeframe, only standard values from M1 to MN1 (1, 5, 15, 30, 60, 240, 1440, 10080, 43200). MT5 also allows using intermediate timeframes. |
| Range count | Number of ranges. |
| Time shift | Time shift from -12 to +12 hours with a one hour step. |
| Draw direction | Histogram drawing direction - left to right or right to left. |
VP-Range parameters
| Parameter | Description |
|---|---|
| Range mode | Range boundary indication method:
|
| Range minutes | Number of minutes for RangeMode 1 and 2. |
| Histogram position | Histogram location:
|
| Mode level line color (None=disable) | Color of levels plotted by modes. Set None to disable. |
| Mode level line style | Style of mode level lines. |
Tradotto dal russo da MetaQuotes Ltd.
Codice originale https://www.mql5.com/ru/code/15440
 Multicurrency trading panel or a game system
An example of using the MasterWindows library for creating a multicurrency game trade panel.
 XDPO_HTF_Signal
XDPO_HTF_Signal shows a trend direction or a signal for performing a deal generated by XDPO_Sign indicator at the chosen bar as a graphic object with colored trend indication or deal direction and sends alerts or audio signals in case of a market entry moment
XTRIX
TRIX indicator provides the ability to change the averaging algorithm
ColorXTRIX_Histogram
TRIX indicator is displayed as a colored histogram and provides the ability to change the averaging algorithm