Unisciti alla nostra fan page

Derivative - indicatore per MetaTrader 5

- Visualizzazioni:
- 6954
- Valutazioni:
- Pubblicato:
- Aggiornato:
-
 Ti stai perdendo delle opportunità di trading:
- App di trading gratuite
- Oltre 8.000 segnali per il copy trading
- Notizie economiche per esplorare i mercati finanziari
Registrazione AccediAccetti la politica del sito e le condizioni d’uso
Se non hai un account, registrati -
 Hai bisogno di un robot o indicatore basato su questo codice? Ordinalo su Freelance
Vai a Freelance
Hai bisogno di un robot o indicatore basato su questo codice? Ordinalo su Freelance
Vai a Freelance
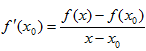
In mathematics, the value of the derivative is calculated according to the following simple formula:
 , (1)
, (1)
where:
- x0 — current value of the argument,
- x — value of the argument to the right of the chart,
- f(x0) — value of the function at point x0,
- f(x) — value of the function at point х.
In the original definition the difference between x and x0 is infinitesimal, i.e. the limit of the function is used. Using the formula (1) it is possible to calculate the approximate value of the derivative using the fuction values, avoiding direct differentiation.
Regarding the price chart, x0 is the current bar, and x is the upcoming bar, which will be formed after a number of chart periods. Respectively, f(x0) is the price value on the current bar, and f(x) is the price value of the upcoming bar. We find that (1) contains two unknowns — f(x0) and f(x). Since we do not have additional expressions which contain the same two unknowns, the solution of equation (1) in this case is absent.
Known values must be taken as f(x) and f(x0) to make it possible to find the derivative f'(x0). For that purpose it is necessary to take a point to the left of the current bar as x0, and to designate the current bar as x. As a result, f(x0) and f(x) become certain values (prices at points x and x0 correspond to the price values visible on the chart).
Although, the calculated value will characterize an area already known to a trader, in which the price growth or fall can be judged without the help of the derivative. In this case the useful information is not simply the value of the derivative, but the comparison of two values of the derivative at adjacent bars. In case the signs of the calculated values are different the price has passed an extremum. The type of the extremum can be easily determined using the combination of signs: transition from negative value to positive value is minimum, positive to negative — maximum.
The described principle of calculation of a derivative is implemented in the Derivative indicator. As a result it displays the difference of prices between the examined bar and the bar spaced from the examined one by a number of bars set in the "Delay" parameter.
The easiest way to use the indicator is this: the line crosses the zero level from below — you should buy, from above — you should sell.
Originally this indicator has been written in MQL4 and was first published in the Code Base on mql5.com on 09.09.2015.

Fig.1. The Derivative indicator
Tradotto dal russo da MetaQuotes Ltd.
Codice originale https://www.mql5.com/ru/code/13902
KalmanFilterStDev
The KalmanFilter indicator with additional trend strength indication using colored dots based on the standard deviation algorithm.
 Number of objects in the specified chart
An example of counting the number of objects in the chart window.
Karacatica_HTF_Signal
The Karacatica_HTF_Signal indicator shows the trend direction or the signal based on the Karacatica indicator.
Derivative_HTF
The Derivative indicator with the timeframe selection option available in the input parameters.