Unisciti alla nostra fan page

Detection of the divergences - indicatore per MetaTrader 4

- Visualizzazioni:
- 44712
- Valutazioni:
- Pubblicato:
- Aggiornato:
-
 Ti stai perdendo delle opportunità di trading:
- App di trading gratuite
- Oltre 8.000 segnali per il copy trading
- Notizie economiche per esplorare i mercati finanziari
Registrazione AccediAccetti la politica del sito e le condizioni d’uso
Se non hai un account, registrati -
 Hai bisogno di un robot o indicatore basato su questo codice? Ordinalo su Freelance
Vai a Freelance
Hai bisogno di un robot o indicatore basato su questo codice? Ordinalo su Freelance
Vai a Freelance
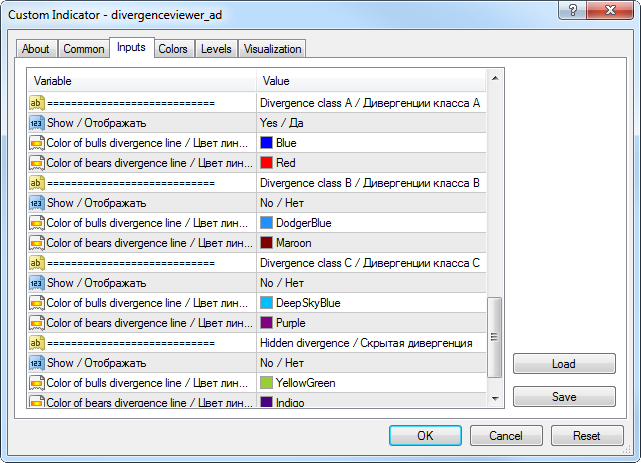
The indicator displays divergences in the form of two matched lines: one on the price chart, the other — on the indicator chart. It allows to register four classes of divergences. For each of the divergence class there is a switch to indicate the necessity of its registration, as well as the color selection of the bull and the bear divergence lines:
One of the six standard indicators included in the DivergenceViewer (RSI, MACD, Momentum, RVI, Stochastic, Standard Deviation) is used as an indicator that serves as data source for the lookup of the divergences with the price (in the indicator's terminology — the base indicator). The indicator can also operate with two non-standard indicators: Derivative and William Blau.
The parameters of the base indicator are set in the input parameter block with the same name:
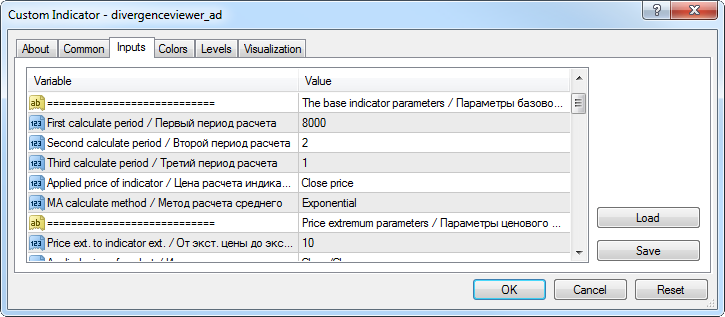
The parameters should be set in the same order as they are presented in the standard indicator. For example, for the Stochastic base indicator the accordance will be as follows:
- "The first calculation period" — %K,
- "The second calculation period" — %D,
- "The third calculation period" — slowing.
If the number of the base indicator parameters is less than three, then the corresponding calculation periods are simply not displayed, and the values of these parameters are ignored. So, for the RSI and the Momentum indicators it is sufficient to set the values of only two parameters: "The first calculation period" and "Indicator calculation price".
If some other indicator needs to used as the base indicator, then choose the value "Custom" in the "Base indicator" parameter, and fill the following lines in the "Custom indicator" block:
- "Indicator name" — the name of an indicator, which is present in the "Navigator" window of the terminal. Specified without the extension.
- "Index of the buffer for data pickup" — the index of the indicator line, values of which will be used for plotting the base indicator chart (most often — 0).
- "Number of the indicator parameters" — specify the amount of the input parameters used by the indicator. If set to 0, then the default parameter values will be used for the base indicator.
- "Value of the N-th parameter" — set the values of the corresponding parameters of the base indicator.
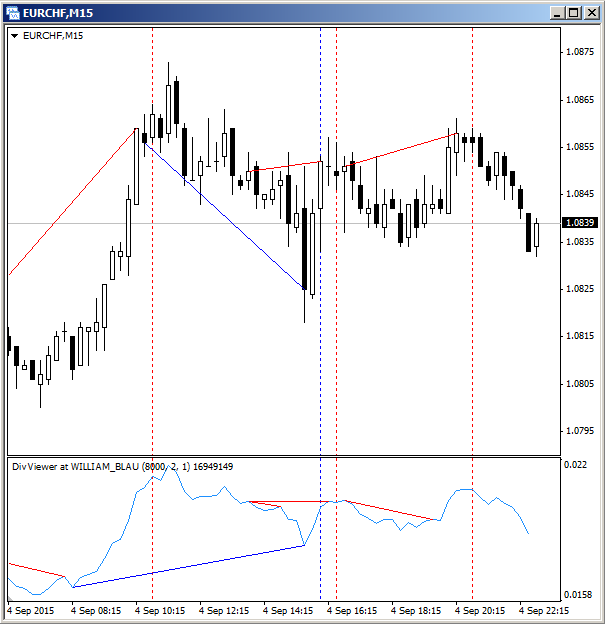
After setting up the base indicator it is necessary to determine the maximum length of the divergence by filling the "Depth of the 2-nd support point lookup" parameter, and to define how much the price extremums must match the indicator extremums — the "From price extremum to indicator extremum" parameter.
The divergence registration is based on the local extremum lookup. To form any extremum at least three bars are needed, the central of which is the extremum. For that reason, the registration of the divergences is made with a two bar delay. The figure shows the class A divergences and bars marked with vertical lines (not part of the indicator), which show the divergence registration places.
The full description of the indicator capabilities and its formation logic is available in the "Divergences on the current chart" article.
Tradotto dal russo da MetaQuotes Ltd.
Codice originale https://www.mql5.com/ru/code/13784
 OrderTimeAlert
The Expert Advisor watches the market orders and generates a sound signal after a predefined time from the moment of order opening.
Elementary trailing stop
Elementary trailing stop able to distinguish its "own" orders among others by comment and/or Magic number. It also distinguishes the financial instrument that needs to be trailed.
Derivative
The indicator performs the calculation of the derivative of the price.
Road Map
The indicator displays the series of waves, breakthrough points and targets for Take Profit.