Unisciti alla nostra fan page
- Visualizzazioni:
- 10162
- Valutazioni:
- Pubblicato:
- Aggiornato:
-
 Ti stai perdendo delle opportunità di trading:
- App di trading gratuite
- Oltre 8.000 segnali per il copy trading
- Notizie economiche per esplorare i mercati finanziari
Registrazione AccediAccetti la politica del sito e le condizioni d’uso
Se non hai un account, registrati -
 Hai bisogno di un robot o indicatore basato su questo codice? Ordinalo su Freelance
Vai a Freelance
Hai bisogno di un robot o indicatore basato su questo codice? Ordinalo su Freelance
Vai a Freelance
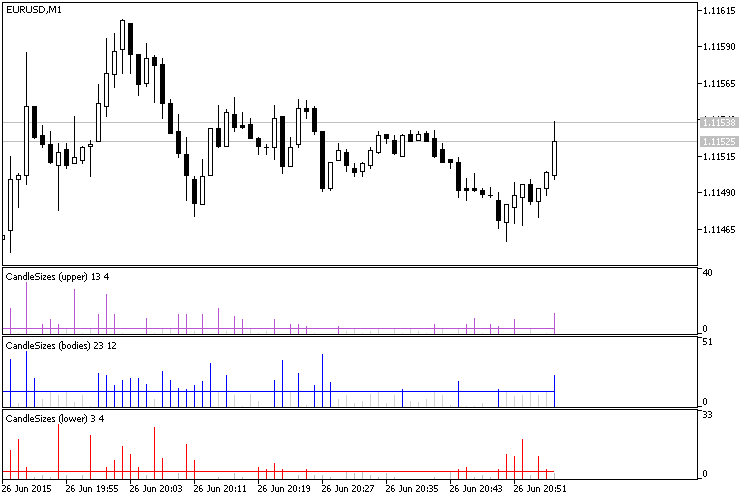
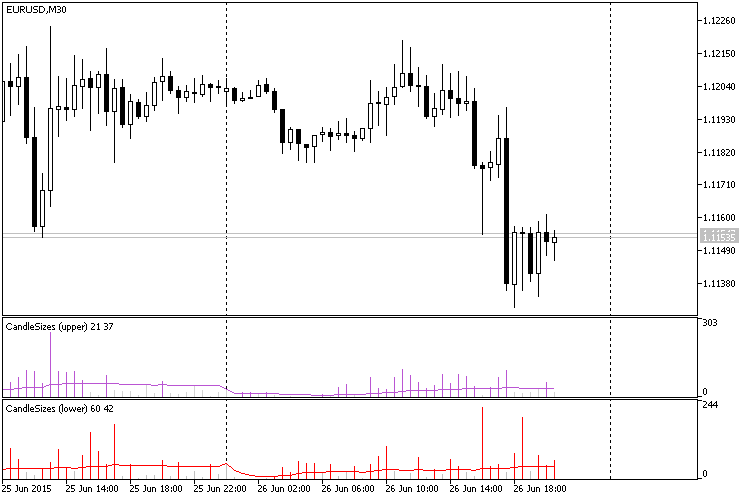
The indicator shows the size of candlestick elements. One histogram bar corresponds to a certain element size on a current candlestick, the histogram line indicates the daily average value of selected elements. A histogram bar changes its color to the color of the line if the element size exceeds the daily average.
Input Parameters:
- inpType — display type (show the size of upper shadows, lower shadows or bodies);
- inpClr — histogram color (if the element size exceeds the daily average);
- inpNeutralClr — neutral color, if the element size doesn't exceed the daily average.
Tips:
- Analyze the values of upper shadows after an uptrend movement, and the values of lower shadows — after a downtrend movement (trend reversal).
- It can be used as a confirming signal to determine important price levels (instead of a candlestick patterns indicator).
- It can be used as a basis for developing candlestick indicators.
- The indicator can work on timeframes up to Н2.
Tradotto dal russo da MetaQuotes Ltd.
Codice originale https://www.mql5.com/ru/code/13329
 ColorZerolagMomentumOSMACandle
The ColorZerolagMomentumOSMA indicator implemented as a sequence of candlesticks.
ColorZerolagMomentumOSMA_HTF
The ColorZerolagMomentumOSMA indicator with the timeframe selection option available in the input parameters.
FractalsNoRedraw
Bill Williams' fractals indicator based on the built-in Fractals indicator. The distinctive feature of this indicator is that it doesn't repaint.
 Exp_ColorZerolagMomentumOSMA
The Exp_ColorZerolagMomentumOSMA Expert Advisor is based on the ColorZerolagMomentumOSMA histogram's change of direction.