Abu Atheer Lines

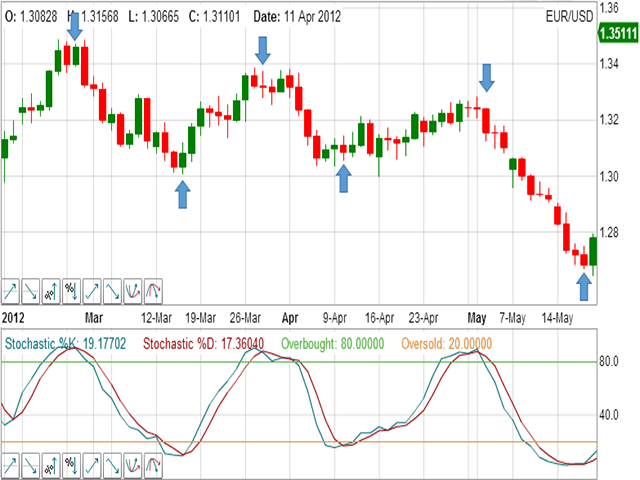
Signal lines are used in technical indicators, especially oscillators, to generate buy and sell signals or suggest a change in a trend. They are called signal lines because when another indicator or line crosses them it is a signal to trade or that something potentially important is happening with the price of an asset. It could be that the price was trending, pulled back, and is now starting to trend or again, or it could signal that a new uptrend or downtrend is starting.


Produits recommandés
Smart Money Trap Detector identifie les pieges de liquidite aux sommets et creux oscillants. Il detecte quand le prix depasse un niveau cle et revient, signalant un potentiel piege haussier ou baissier mis en place par les acteurs institutionnels. Chaque piege detecte recoit un score de force de 1 a 5 base sur la taille de la meche, la vitesse de retournement et le volume.   Fonctionnement L'indicateur suit les sommets et creux oscillants avec une periode de retrospection configurable. Lorsque l
Double HMA lines MTF
Pavel Zamoshnikov
5 (1)
This is a multi-timeframe version of the popular Hull Moving Average (HMA). The Double HMA MTF Light indicator combines two timeframes on a single chart. The HMA of the higher timeframe defines the trend, and the HMA of the current timeframe defines short-term price movements. The indicator is freely distributed and hasn't audio signals or messages. Its main function is the visualization of price movements. If you need advanced functionality of the HMA multi-timeframe indicator (information ab
FREE
Extremum Reverse Bar
Yurij Izyumov
2.8 (5)
This indicator has been created for finding the probable reversal points of the symbol price. A small candlestick reversal pattern is used it its operation in conjunction with a filter of extremums. The indicator is not redrawn! If the extremum filter is disabled, the indicator shows all points that have a pattern. If the extremum filter is enabled, the condition works – if the history Previous bars 1 candles back contains higher candles and they are farther than the Previous bars 2 candle, such
FREE
Auto Fibonacci displays the 38.2, 61.8, and 78.6 Fib levels directly on the chart, helping traders who use these key retracement zones consistently for trade planning or confluence. Drawing Fibonacci levels manually over and over again can take time, especially when done with wick-to-wick precision. Auto Fibonacci removes that friction by detecting the latest trend leg and placing the main Fibonacci levels automatically. Key Benefits Shows only the major Fibonacci levels to keep the chart clean
FREE
Double Price Tap
Vitalii Krasil'nikov
Double Price Tap — an MT4 indicator that reliably shows large players' limit levels, reversal points, and likely breakout zones. Short summary Double Price Tap detects real price holding: when two consecutive bars hit the exact same price pip‑to‑pip and fail to break it, that forms a real price boundary. The indicator marks these spots on the chart and highlights where a bounce or an imminent breakout is likely. How to read the signals Up arrow — two consecutive bars touched the same high (p
This is an indicator that helps you to scan the whole timeframe then informs you about the last candle position Engulfing Candlestick pattern was formed. The indicator also send alert to your mobile when a new engulfing candle is formed.  For the visual; 1. Green up arrow indicates a bullish engulfing candlestick pattern  2. Red down arrow indicates a bearish engulfing candlestick pattern
FREE
Machine Learning Adaptive SuperTrend - Take Your Trading to the Next Level! Introducing the   Machine Learning Adaptive SuperTrend , an advanced trading indicator designed to adapt to market volatility dynamically using machine learning techniques. This indicator employs k-means clustering to categorize market volatility into high, medium, and low levels, enhancing the traditional SuperTrend strategy. Perfect for traders who want an edge in identifying trend shifts and market conditio
L'indicateur Symmtric Trangle Pattern MT4 est conçu pour améliorer les stratégies de trading en identifiant des motifs de triangles symétriques en temps réel sur MetaTrader 4. Cet outil puissant bénéficie aux traders à la recherche de signaux fiables indiquant une continuation ou une inversion potentielle de tendance, aidant ainsi à une prise de décision plus éclairée. Avec son algorithme avancé, l'indicateur simplifie le processus de trading en fournissant des signaux visuels clairs et des aler
FREE
Free automatic Fibonacci is an indicator that automatically plots a Fibonacci retracement based on the number of bars you select on the BarsToScan setting in the indicator. The Fibonacci is automatically updated in real time as new highest and lowest values appears amongst the selected bars. You can select which level values to be displayed in the indicator settings. You can also select the color of the levels thus enabling the trader to be able to attach the indicator several times with differe
FREE
Stoch Color Indicator
Adrian Hernandez Castellanos
Oscillateur stochastique avec coloration Cet indicateur colore l'arrière-plan en fonction de la tendance de l'indicateur. L'indicateur colore l'arrière-plan en fonction de la valeur de l'oscillateur stochastique, qu'il s'agisse d'une tendance haussière ou baissière. La couleur de l'arrière-plan est déterminée par les paramètres de l'oscillateur stochastique, ne peignant que les 400 dernières barres (voir notes). Paramètres modifiables : %K Period : période %K %D Period: période %D Slowing: pério
Trend Forecasting
Mohamed Hassan
4.76 (17)
Summer Sale: 50% OFF!!! Promotion is valid until 08 August 2025!  This indicator is unstoppable when combined with our other indicator called Katana. After purchase, send us a message and you could get Katana for FREE as a BONUS After purchase, send us a private message for your instructions.  The Trend Forecasting indicator is a very unique & easy tool that is able to make prediction about future price movement based on the signals generated by MACD . It helps you have an estimation on the are
Doji Engulfing Paths
Boubacar Tidiane Traore
Presentation Doji Engulfing Paths enables to get signals and data about the doji and the engulfing patterns on charts. It makes it possible to get opportunities from trends, and to follow the directional moves to get some profits on the forex and stocks markets. It is a good advantage to take all the appearing opportunities with reversal signals and direct signals in order to obtain some profits on the forex market. System features With fast execution, it allows to register directly the informa
Time to Trade Trading timing indicator is based on market volatility through 2 ATR indicators to determine the timing of a transaction. The indicator determines the times when the market has strong volatility in trend. When histogram is greater than 0 (blue) is a strong market, when histogram is less than 0 (yellow) is a weak market. Should only trade within histograms greater than 0. Based on the histogram chart, the first histogram value is greater than 0 and the second histogram appears, this
FREE
Swing or Scalp
Jermaine Wedderburn
Coloured price charts, generating black arrows.  User can change the colours of the arrows in the colour section of the indicator.  It is consider a great scalping tool on lower time-frames, while higher time frames will have fewer opportunities but trades will possibly last longer.  There is an input for Alert on or off.  This can be used effectively on M15/M30 Chart until up to H4 chart time.  It is best if the user has some experience with money management, utilising trailing stop to protect
Reverse Signal
Andrei Gerasimenko
3 (2)
The indicator marks the estimated market reversals in the form of arrows. The indicator is able to detect 3 types of reversals. The primary reversal signal. It is a stronger and more important reversal. Denoted by the largest arrow. Alternative signal - additional signal without additional filters in contrast to the primary. Suitable for scalping on small timeframes. A mixture of the primary and alternate reversals, but with the addition of the trend filter. Also shows good results on small time
PZ Three Drives
PZ TRADING SLU
5 (2)
This indicator finds Three Drives patterns. The Three Drives pattern is a 6-point reversal pattern characterised by a series of higher highs or lower lows that complete at a 127% or 161.8% Fibonacci extension. It signals that the market is exhausted and a reversal can happen. [ Installation Guide | Update Guide | Troubleshooting | FAQ | All Products  |  Get Help ] Customizable pattern sizes Customizable colors and sizes Customizable breakout periods Customizable 1-2-3 and 0-A-B ratios It impl
FREE
Super MA Trend indicator is an indicator designed to find trends. It uses a moving average, a set of candle combinations and High/Low levels to find trends. This indicator is a complete trading system. You can trade with this indicator as you like. Features and Recommendations You can use this indicator on all pairs except for the volatile pairs. It is recommended to use it on M15 and over graphics. The most important element in this indicator are alerts. Do not open orders unless you receive a
Necessary for traders: tools and indicators Waves automatically calculate indicators, channel trend trading Perfect trend-wave automatic calculation channel calculation , MT4 Perfect trend-wave automatic calculation channel calculation , MT5 Local Trading copying Easy And Fast Copy , MT4 Easy And Fast Copy , MT5 Local Trading copying For DEMO Easy And Fast Copy , MT4 DEMO Easy And Fast Copy , MT5 DEMO The homeopathic indicator is also called the CCI indicator. The CCI indicator was proposed
FREE
Triple RSI
Pablo Leonardo Spata
1 (1)
LOOK AT THE FOLLOWING STRATEGY WITH THIS INDICATOR. Triple RSI is a tool that uses the classic Relative Strength Indicator, but in several timeframes to find market reversals.    1.  ️ Idea behind the indicator and its strategy: In Trading, be it Forex or any other asset, the ideal is to keep it simple, the simpler the better . The triple RSI strategy is one of the simple strategies that seek market returns. In our experience, where there is more money to always be won, is in the marke
FREE
This indicator scans for you up to 30 trading instruments and up to 8 timeframes for occurrences of the high probability reversal patterns: Double Tops/Bottoms with fake breakouts . Please read also the blog post " Professional Trading With Double Tops/Bottoms And Divergences! " which explains the concepts behind the ULTIMATE Double Top/Bottom indicator and how you can use a professional top-down approach. This FREE Version of the Scanner scans only EURUSD and GBPUSD. The full version of the sca
FREE
The indicator determines a special pattern of Joe Dinapoli. It gives very high probability buy and sell signals. Indicator does not repaint. Indicator Usage Buy Signal ''B'' Entry : Market buy order at signal bar close Stop : Low of signal bar Take Profit : First swing high Sell Signal ''S'' Entry : Market sell order at signal bar close Stop : High of signal bar Take Profit : First swing low Indicator Parameters Fast EMA : External Parameter (should be kept as default) Slow EMA: External Parame
Constructeur automatique de lignes de tendance et de canaux avec notifications – Levels ResSup MT4 Fatigué de dessiner manuellement des lignes de tendance et des canaux ? Vous souhaitez recevoir des alertes en temps opportun sur la formation de nouvelles opportunités de trading ? Nous vous présentons l'indicateur Levels ResSup MT4 – votre assistant indispensable pour l'analyse automatique des tendances de prix ! Cet outil puissant identifie et affiche instantanément les principales lignes de ten
Virtual Targets
Hoang Van Dien
3.83 (6)
This indicator is very useful for day traders or short term traders. No need to calculate the number of pips manually, just look at the chart and you will see the Virtual Take Profit / Virtual Stop Loss target line and evaluate whether the entry point is feasible to reach the intended target or not. Enter the intended Take Profit / Stop Loss pips for your trade. The indicator will display Virtual Take Profit / Virtual Stop Loss lines for you to easily see if the target is feasible or not.
FREE
This indicator is meant for Harmonic Traders, it helps them in identifying the formed patterns by analyzing the market past data, looking for Harmonic Patterns. The Patterns that this indicator can detect are: AB=CD Butterfly Gartely Crab Bat The indicator shows the following: The completed pattern, with the critical zone highlighted in Gray box The suggested 3 take profit levels (in green) The Suggested Stop Loss level (in Red) The formed pattern ratios can be checked by hovering the mouse on t
MT Scanner
Niravkumar Maganbhai Patel
4 (2)
This indicator helps you to Scan symbols which are in the Market Watch Window  and filter out trends with alerts. It works based on the effective indicator "SUPERTREND" which is used by many traders for trading: When box color changes to " Green " or " Red " color, it indicates you for trend change for long and short entry. And also you will get alerted on screen. When it changes to " Green ", it indicates you that trend is going upwards, and you can take the long entry. If the color changes to
FREE
Over Trend MT4
Mansour Babasafary
Trend based indicator Identify trends with this indicator A simple-to-use trend indicator No complicated settings Attributes: Can be used in all symbols Can be used in all time frames Relatively high signals No complicated settings Specific to the trend Lifetime support Settings: Alarm Show Alert: By activating these settings, after receiving the signal, you will receive an alarm in Metatrader Alarm Show Notification: By activating these settings, after receiving the signal, you will receive a
This indicator Super Neuro Trend indicator.Indicator displays trend movement. Indicator helps to buy and sell. Features FiltPer- displays indicator period. deviation - displaus indicator deviation. Trend - displaus indicator trend.( true,false) Rectangle - displaus indicator rectangle. (true,false)  How to understand the status: If the trend color is green, trend is up. I f the trend color is red, trend is down. I f the trend waiting,trend waiting.     ///////////////////////////////////////////
Key Breakout and Jump/Fall levels. No lagging. No repaint. Trend line is useful for detecting pattern, which is intended for the triangle pattern, Support & Resistance lines, and as a breakout up or down line.  The trend lines are formed first before the price of the pair reach it. So it does not repaint.  Each line has a description, such as Support, Resistance, Current-Support as key breakout down, and Current-Resistance as a key breakout up.  Each broke out line turns into a new support or re
Discover the power of precision and efficiency in your trading with the " Super Auto Fibonacci " MT4 indicator. This cutting-edge tool is meticulously designed to enhance your technical analysis, providing you with invaluable insights to make informed trading decisions. Key Features: Automated Fibonacci Analysis: Say goodbye to the hassle of manual Fibonacci retracement and extension drawing. "Super Auto Fibonacci" instantly identifies and plots Fibonacci levels on your MT4 chart, saving you tim
FREE
This is indicator for checking your trades. Please see the pictures attachment, the indicator show info about: - Breakeven Level; - Margin Call Level; - Two volume info, past and current (With color exchange base on the past volume); - Spreads; - Swap Long and Swap Short (With color change, positive and negative swap); - Running Price; -Today High Low Pips; - Today Open to Current Running Price pips. This indicator not for trading entry, only to assist your trade management Regards
Les acheteurs de ce produit ont également acheté
Genesis Matrix Pro is a professional multi-timeframe trend detection indicator designed to help traders identify high-quality market alignment with clarity and structure. It combines 12 different technical indicators into one visual alignment matrix, allowing traders to quickly see when market conditions are bullish, bearish, or neutral. A signal is generated only when the selected strategies are aligned, helping reduce noise and improve decision-making. PLEASE CONTACT ME AFTER PURCHASE TO GET
Gann Made Easy
Oleg Rodin
4.83 (163)
Gann Made Easy est un système de trading Forex professionnel et facile à utiliser qui est basé sur les meilleurs principes de trading en utilisant la théorie de mr. WD Gann. L'indicateur fournit des signaux d'ACHAT et de VENTE précis, y compris les niveaux Stop Loss et Take Profit. Vous pouvez échanger même en déplacement en utilisant les notifications PUSH. VEUILLEZ ME CONTACTER APRÈS L'ACHAT POUR RECEVOIR GRATUITEMENT DES INSTRUCTIONS DE TRADING ET D'EXCELLENTS INDICATEURS SUPPLÉMENTAIRES! Vou
The Propfolio Master Suite is the ultimate all-in-one analytical workstation for professional traders. Combining the power of the Beat The Market Maker (BTMM) methodology, Smart Money Concepts (SND/Liquidity), and Advanced Volume Profile, this suite replaces multiple different indicators with one optimized engine. Monitor up to 14 pairs simultaneously from a single chart, instantly identify market cycles, and seamlessly map institutional footprints with the click of a button. The Command Center
Scalper Inside PRO
Alexey Minkov
4.74 (69)
Scalper Inside PRO Scalper Inside PRO is an intraday trend and scalping indicator for MetaTrader 4 that uses an exclusive algorithm to quickly detect market direction and key target levels. It automatically calculates entry, exit and multiple profit targets, and shows detailed performance statistics so you can see how different instruments and strategies performed. This helps you choose the most suitable trading instruments for the current market conditions. Additionally, you can easily integrat
M1 Sniper
Oleg Rodin
5 (23)
M1 SNIPER est un système d'indicateurs de trading facile à utiliser. Il s'agit d'un indicateur à flèche conçu pour l'unité de temps M1. Cet indicateur peut être utilisé seul pour le scalping sur l'unité de temps M1 ou intégré à votre système de trading existant. Bien que conçu spécifiquement pour le trading sur l'unité de temps M1, ce système peut également être utilisé avec d'autres unités de temps. Initialement, j'avais conçu cette méthode pour le trading du XAUUSD et du BTCUSD. Cependant, je
Le système PRO Renko est un système de trading très précis spécialement conçu pour le trading de graphiques RENKO. Il s'agit d'un système universel qui peut être appliqué à divers instruments de négociation. Le système neutralise efficacement ce qu'on appelle le bruit du marché en vous donnant accès à des signaux d'inversion précis. L'indicateur est très facile à utiliser et n'a qu'un seul paramètre responsable de la génération du signal. Vous pouvez facilement adapter l'outil à n'importe que
Auto Optimized Parabolic RSI : Moteur de Momentum 3D Avancé La plupart des indicateurs pour les particuliers échouent car ils s'appuient sur des paramètres statiques qui se brisent dès que la volatilité du marché change. L'Auto Optimized Parabolic RSI résout le problème de l'« obsolescence des indicateurs » en recalculant continuellement son propre avantage mathématique, apportant une adaptation quantitative de niveau institutionnel directement sur votre terminal MT5. L'Avantage Principal : Opti
NAM Order Blocks
NAM TECH GROUP, CORP.
3.67 (3)
MT4 Multi-timeframe Order Blocks detection indicator. Features - Fully customizable on chart control panel, provides complete interaction. - Hide and show control panel wherever you want. - Detect OBs on multiple timeframes. - Select OBs quantity to display. - Different OBs user interface. - Different filters on OBs. - OB proximity alert. - ADR High and Low lines. - Notification service (Screen alerts | Push notifications). Summary Order block is a market behavior that indicates order collection
Tout d'abord, il convient de souligner que cet outil de trading est un indicateur non repeint, non redessiné et non retardé, ce qui le rend idéal pour le trading professionnel. Cours en ligne, manuel utilisateur et démonstration. L'indicateur Smart Price Action Concepts est un outil très puissant à la fois pour les nouveaux et les traders expérimentés. Il regroupe plus de 20 indicateurs utiles en un seul, combinant des idées de trading avancées telles que l'analyse du trader Inner Circle et les
Quants HL Break
Ferhat Mutlu
5 (2)
Calcul avancé effectué par l'action pure des prix pour trouver les cassures LH et HL. Cela vous donnera d'excellents points d'inversion sur le marché.Les signaux LH et HL peuvent également être utilisés pour les évasions de traingle. Une fois que la cassure se produit, cela indique un fort renversement.Beau filtre pour les moyennes mobiles.Je suggère fortement de l'utiliser avec des indicateurs de tendance. Peut être utilisé comme une confirmation supplémentaire pour le support et la résistanc
Dynamic Forex28 Navigator
Bernhard Schweigert
4.43 (7)
Dynamic Forex28 Navigator - L'outil de trading Forex de nouvelle génération. ACTUELLEMENT 49 % DE RÉDUCTION. Dynamic Forex28 Navigator est l'évolution de nos indicateurs populaires de longue date, combinant la puissance de trois en un : Advanced Currency Strength28 Indicator (695 avis) + Advanced Currency IMPULSE avec ALERT (520 avis) + CS28 Combo Signals (Bonus). Détails sur l'indicateur https://www.mql5.com/en/blogs/post/758844 Qu'offre l'indicateur de force de nouvelle génération ? Tout
PZ Harmonacci Patterns
PZ TRADING SLU
3.17 (6)
Trade smarter, not harder: Empower your trading with Harmonacci Patterns This is arguably the most complete harmonic price formation auto-recognition indicator you can find for the MetaTrader Platform. It detects 19 different patterns, takes fibonacci projections as seriously as you do, displays the Potential Reversal Zone (PRZ) and finds suitable stop-loss and take-profit levels. [ Installation Guide | Update Guide | Troubleshooting | FAQ | All Products  ] It detects 19 different harmonic pric
RFI levels PRO
Roman Podpora
5 (1)
L'indicateur montre avec précision les points de retournement et les zones de retour des prix où le       Acteurs majeurs   . Vous repérez les nouvelles tendances et prenez des décisions avec une précision maximale, en gardant le contrôle de chaque transaction. VERSION MT5     -     Révèle son potentiel maximal lorsqu'il est combiné à l'indicateur   TREND LINES PRO Ce que l'indicateur montre : Structures et niveaux d'inversion avec activation au début d'une nouvelle tendance. Affichage des nive
Trend Catcher ind
Ramil Minniakhmetov
INDICATEUR DE DÉTECTEUR DE TENDANCE L'indicateur de détecteur de tendance analyse les mouvements de prix du marché grâce à une combinaison d'indicateurs d'analyse de tendance adaptatifs, propriétaires et personnalisés. Il identifie la véritable direction du marché en filtrant les fluctuations à court terme et en se concentrant sur la force de la dynamique sous-jacente, l'expansion de la volatilité et la structure des prix. Il utilise également une combinaison d'indicateurs personnalisés de lis
Apollo SR Master est un indicateur de support/résistance doté de fonctionnalités spéciales qui simplifient et fiabilisent le trading basé sur les zones de support/résistance. Cet indicateur calcule ces zones en temps réel, sans aucun décalage, en détectant les sommets et les creux locaux des prix. Pour confirmer la nouvelle zone de support/résistance, il affiche un signal spécifique indiquant que cette zone peut être prise en compte et utilisée comme un véritable signal d'achat ou de vente. Dans
Grabber System
Ihor Otkydach
5 (2)
Je vous présente un excellent indicateur technique : Grabber, qui fonctionne comme une stratégie de trading "tout-en-un", prête à l'emploi. En un seul code sont intégrés des outils puissants d'analyse technique du marché, des signaux de trading (flèches), des fonctions d'alerte et des notifications push. Chaque acheteur de cet indicateur reçoit également gratuitement : L'utilitaire Grabber : pour la gestion automatique des ordres ouverts Un guide vidéo étape par étape : pour apprendre à installe
Advanced Supply Demand
Bernhard Schweigert
4.91 (300)
Offre spéciale : 40 % de réduction La solution idéale pour les traders débutants comme experts ! Cet indicateur est un outil de trading unique, performant et abordable grâce à l’intégration de nombreuses fonctionnalités exclusives et d’une nouvelle formule. Cette mise à jour vous permet d’afficher des zones sur deux unités de temps. Vous pourrez ainsi visualiser non seulement une unité de temps supérieure, mais aussi l’unité de temps du graphique, ainsi que l’unité de temps supérieure : des z
Signal GoldRush Trend Arrow L'indicateur GoldRush Trend Arrow Signal fournit une analyse précise et en temps réel des tendances, spécialement conçue pour les scalpers à haute vitesse et à court terme sur la paire XAU/USD. Conçu spécialement pour les intervalles de temps d'une minute, cet outil affiche des flèches directionnelles indiquant clairement les points d'entrée, ce qui permet aux scalpers de naviguer en toute confiance dans des conditions de marché volatiles. L'indicateur se compose
Introduction to Fractal Pattern Scanner Fractal Indicator refers to the technical indicator that makes use of the fractal geometry found in the financial market. Fractal Pattern Scanner is the advanced Fractal Indicator that brings the latest trading technology after the extensive research and development work in the fractal geometry in the financial market. The most important feature in Fractal Pattern Scanner is the ability to measure the turning point probability as well as the trend probabi
ACTUELLEMENT 40% DE RÉDUCTION La meilleure solution pour tout débutant ou trader expert ! Cet indicateur est un outil de trading unique, de haute qualité et abordable car nous avons incorporé un certain nombre de caractéristiques exclusives et une nouvelle formule. Avec seulement UN graphique, vous pouvez lire la force de la devise pour 28 paires Forex ! Imaginez comment votre trading va s'améliorer parce que vous êtes capable de repérer le point de déclenchement exact d'une nouvelle tendance
Cycle Sniper
Elmira Memish
4.39 (36)
Please contact us after your purchase and we will send you the complimentary indicators to complete the system Cycle Sniper is not a holy grail but when you use it in a system which is explained in the videos, you will feel the difference. If you are not willing to focus on the charts designed with Cycle Sniper and other free tools we provide, we recommend not buying this indicator. We recommend watching the videos about the indiactor and system before purchasing. Videos, settings  and descri
Market Structure Patterns MT4
Samuel Manoel De Souza
5 (18)
Market Structure Patterns   est un indicateur basé sur les   Smart Money Concepts   qui affiche les   éléments SMC/ICT   pouvant améliorer vos décisions de trading. Profitez des   alertes ,   notifications push   et   emails   pour être informé lorsqu’un élément se forme sur le graphique, que le prix franchit un niveau et/ou entre dans une zone. Les développeurs peuvent accéder aux valeurs des éléments de l’indicateur via les   variables globales , permettant l’automatisation des décisions de tr
Advanced UT BOT ALERTS for MT4 Système professionnel de détection de tendance multi-filtres | Version améliorée du moteur UT BOT Nous proposons uniquement des indicateurs de haute qualité. Advanced UT BOT est conçu pour un usage professionnel, avec une logique de signal stable et un calcul sécurisé qui évite tout retard ou mise à jour erronée. Il ne redessine, ne supprime ni ne modifie aucun signal passé. Tous les signaux BUY et SELL sont générés uniquement après la clôture de la bougie , garant
Contactez-moi après l'achat pour obtenir un EA en bonus basé sur cet indicateur. La Self Optimizing Double MA Strategy est un outil de trading de niveau professionnel conçu pour éliminer les approximations de paramètres. Propulsé par un moteur d'auto-optimisation intégré, il s'adapte continuellement aux conditions changeantes du marché en simulant des milliers de combinaisons de paramètres en arrière-plan afin de maintenir un avantage statistique. Au lieu de s'appuyer sur des paramètres statiqu
Day Trader Master est un système de trading complet pour les day traders. Le système se compose de deux indicateurs. Un indicateur est un signal fléché pour acheter et vendre. C'est l'indicateur de flèche que vous obtenez. Je vous fournirai le deuxième indicateur gratuitement. Le deuxième indicateur est un indicateur de tendance spécialement conçu pour être utilisé conjointement avec ces flèches. LES INDICATEURS NE RÉPÉTENT PAS ET NE TARDENT PAS! L'utilisation de ce système est très simple. Il v
Candle Power Pro
Thushara Dissanayake
4.5 (8)
Le       Candle Power Pro       est un outil de trading sophistiqué conçu pour décoder       pression réelle sur le volume, déséquilibres des données de ticks et dynamique du flux d'ordres institutionnels       en mesurant le       bataille entre les tics haussiers et les tics baissiers       en temps réel. Cet indicateur transforme les données brutes       données de volume en informations exploitables   , aidant les traders à identifier       Mouvements d'argent intelligent, chasses aux liqui
Si vous tradez sur le marché du Forex, disposer d'informations détaillées sur la force des devises et la corrélation entre les paires de devises peut élever votre trading à un niveau supérieur. La corrélation vous aidera à réduire votre risque de moitié, tandis que l'analyse de la force maximisera vos profits. Cet indicateur propose une approche hybride pour sélectionner les paires de devises les plus appropriées en combinant l'analyse de la force des devises et la corrélation des paires. Comme
Route Lines Prices - est un indicateur conçu pour identifier les directions des prix. Son interface simple intègre plusieurs algorithmes de calcul du comportement des prix et de leur direction future. Ces algorithmes incluent le calcul de la volatilité et le lissage des prix en fonction des unités de temps utilisées. L'indicateur possède un unique paramètre permettant de modifier la valeur « Calculating price values ». La valeur par défaut de 1 assure un calcul automatique équilibré, utilisabl
KURAMA GOLD SIGNAL PRO (MT4) — Système de Trading XAUUSD Complet avec Filtre à 7 Couches, TP/SL Automatique et Notation de Qualité PAS DE REPAINT. PAS DE REDESSIN. PAS DE RETARD. Chaque signal est permanent. Ce que vous voyez est ce que vous obtenez. BONUS : Achetez la licence à vie et recevez AI Zone Radar (valeur $59) + manuel PDF complet GRATUIT. Envoyez-moi un message après l'achat. AI Zone Radar : https://www.mql5.com/en/market/product/175834 CONFIANCE DES TRADERS : Déjà utilisé par une
Master head and shoulders patterns for better trading decisions A head and shoulders pattern is a chart formation that resembles a baseline with three peaks, the outside two are close in height and the middle is highest. It predicts a bullish-to-bearish trend reversal and is believed to be one of the most reliable trend reversal patterns. It is one of several top patterns that signal, with varying degrees of accuracy, that a trend is nearing its end. [ Installation Guide | Update Guide | Trouble
Plus de l'auteur
CycleIdentifier
Amyr Shryf Mhmd Salh
The Cycle Identifier MT4 indicator is a great choice of custom indicator for both short-term and long-term traders. The Cycle Identifier MT4 generates filtered price action signals to assist traders to identify when the conditions are right to open buy and sell positions. How it works The Cycle Identifier MT4 indicator displays on a separate indicator chart below the main chart where it draws an oscillating gray line. This gray line is characterized by upward and downward spikes that are accompa
Tow lines
Amyr Shryf Mhmd Salh
What is 2 Line MACD Indicator MT4? The 2 Line MACD Indicator, in short, is a technical indicator that assists in identifying the trend as well as its strength, and the possibility of the trend reversal. It is a widespread forex technical indicator that is made of three essential components, i.e. 1. MACD histogram 2. MACD: 12-period exponential moving average (12 EMA) – 26 period EMA 3. MACD Signal Line: the 9-period EMA of the MACD. This Indicator is one that ensures a trader stays profitable o
Three S Turbo
Amyr Shryf Mhmd Salh
3C JRSX H Indicator   represents a trend-following forex trading oscillator that signals for both market trends and its possible swing areas. Besides, it supports all sorts of timeframe charts available within the forex MT4 platform. Therefore, it can serve all kinds of financial traders providing supports for both scalping and day trading activities. This Indicator can be applied to all kinds of forex currency pairs available in the market. Moreover, its simplicity of use and easy chart demons
The Market Profile Indicator for MT4 displays the price levels and zones where increased trading activity happens. These zones with substantial forex trading activity provide the forex traders with the best entry levels, support, and resistance levels. Moreover, price levels indicate the best reversal zones. As a result, forex traders can identify BULLISH and BEARISH market trends and BUY and SELL entry points as well as the best reversal points. The indicator works well in all intraday timefram
Filtrer:
Aucun avis
Répondre à l'avis